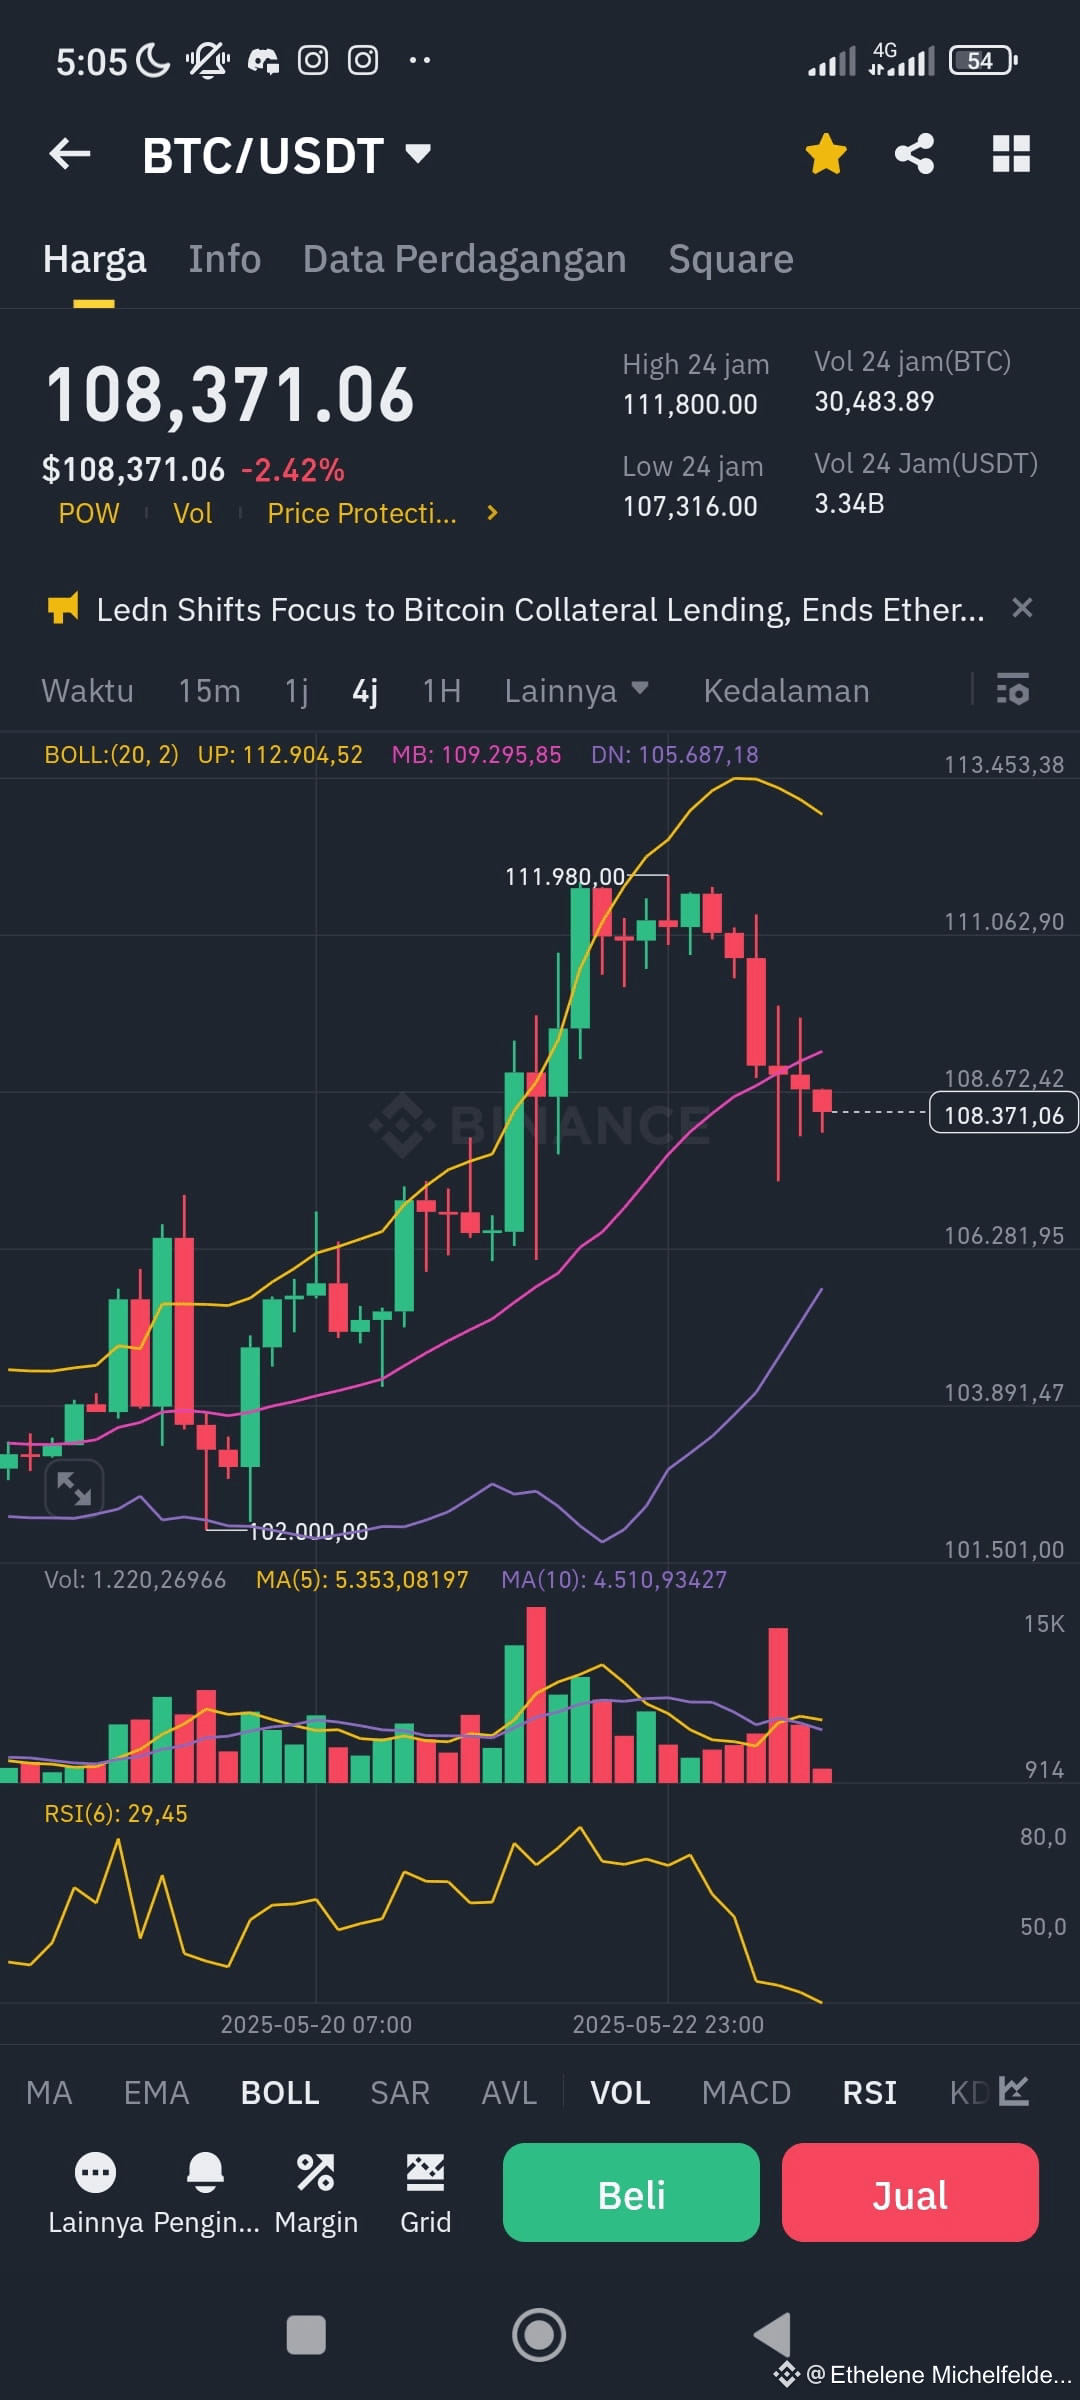
Based on the BTC/USDT chart with a 4-hour timeframe and technical indicators, here is the analysis for the next 1 day to 1 week:
1. Technical Analysis
a. Current Price:
$108,371.06 (down -2.42%)
b. RSI Indicator (Relative Strength Index):
RSI(6) = 29.45
Has been in the oversold area (<30), which may indicate potential short-term rebound, but there is yet to be confirmation of trend reversal.
c. Bollinger Bands (BOLL):
Upper Band: 112,904
Middle Band (MA20): 109,295
Lower Band: 105,687
Current price is near the lower band, indicating quite high selling pressure, but could also indicate that the price is close to the selling saturation point.
d. Candlestick Patterns & Volume:
There was a sharp decline from the peak of $111,980.
Volume has started to decrease, indicating that seller momentum is starting to weaken.
No reversal patterns such as hammer/bullish engulfing have been seen yet.
2. Important Support & Resistance
LevelDescription107,316Nearest daily support (24-hour low)105,687Lower Bollinger Band102,000Previous strong support111,800Strong resistance (24-hour high)112,904Upper Bollinger Band
3. Market Sentiment and Breaking News
Reported news that:
"Ledn Shifts Focus to Bitcoin Collateral Lending, Ends Ethereum Support"
This indicates an increased institutional focus on Bitcoin, which could be a positive medium-term signal for BTC, but may exert short-term pressure on ETH and the altcoin ecosystem.
4. Movement Predictions (Short-Term)
Bullish Scenario (Rebound):
If the price can stay above $107,300–$105,600, and RSI rises >30, the potential bounce to $109,300 (MA20) or even $111,000 is quite strong.
Bearish Scenario (Breakdown):
If it breaks below $105,600, it may continue to fall to $103,800 or even test $102,000.
#TrumpTariffs $BTC
1. Technical Analysis
a. Current Price:
$108,371.06 (down -2.42%)
b. RSI Indicator (Relative Strength Index):
RSI(6) = 29.45
Has been in the oversold area (<30), which may indicate potential short-term rebound, but there is yet to be confirmation of trend reversal.
c. Bollinger Bands (BOLL):
Upper Band: 112,904
Middle Band (MA20): 109,295
Lower Band: 105,687
Current price is near the lower band, indicating quite high selling pressure, but could also indicate that the price is close to the selling saturation point.
d. Candlestick Patterns & Volume:
There was a sharp decline from the peak of $111,980.
Volume has started to decrease, indicating that seller momentum is starting to weaken.
No reversal patterns such as hammer/bullish engulfing have been seen yet.
2. Important Support & Resistance
LevelDescription107,316Nearest daily support (24-hour low)105,687Lower Bollinger Band102,000Previous strong support111,800Strong resistance (24-hour high)112,904Upper Bollinger Band
3. Market Sentiment and Breaking News
Reported news that:
"Ledn Shifts Focus to Bitcoin Collateral Lending, Ends Ethereum Support"
This indicates an increased institutional focus on Bitcoin, which could be a positive medium-term signal for BTC, but may exert short-term pressure on ETH and the altcoin ecosystem.
4. Movement Predictions (Short-Term)
Bullish Scenario (Rebound):
If the price can stay above $107,300–$105,600, and RSI rises >30, the potential bounce to $109,300 (MA20) or even $111,000 is quite strong.
Bearish Scenario (Breakdown):
If it breaks below $105,600, it may continue to fall to $103,800 or even test $102,000.
#TrumpTariffs $BTC