



The basic Binance chart is a trading window without any additional chart settings. In fact, it is not bad in itself because candles, trading volume, and moving averages are provided by default.
However, there are definitely those who want to add other indicators and seek new strategies. Therefore, while trying various things, it is not as easy as it seems.
Today, I will explain the method for setting up the Binance chart very simply. I will cover it in detail in the following content.
Binance Chart Settings
First, please access Binance on your PC. The reason for accessing through a computer is that adding indicators is limited on mobile, so it is recommended to access Binance on your computer for accurate trading, even if it is a bit cumbersome.
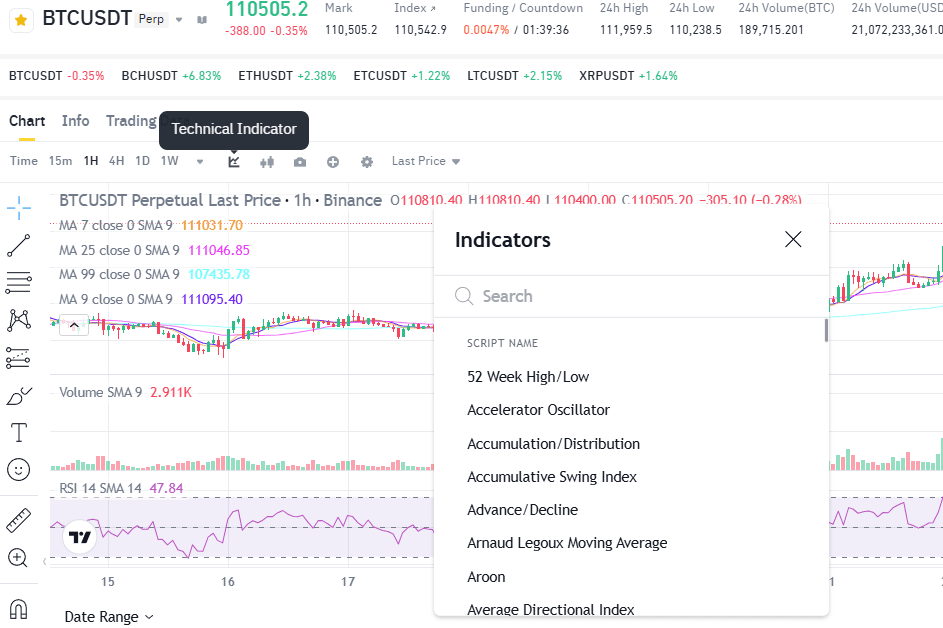
Next, please enter the futures trading screen and select Indicator. After that, you can add the desired indicators.
However, for beginners in investing, it is not easy to choose what is good. Therefore, in this post, I would like to introduce two indicators that anyone can easily apply.
These are Bollinger Bands and RSI. I will explain each one.
Bollinger Bands
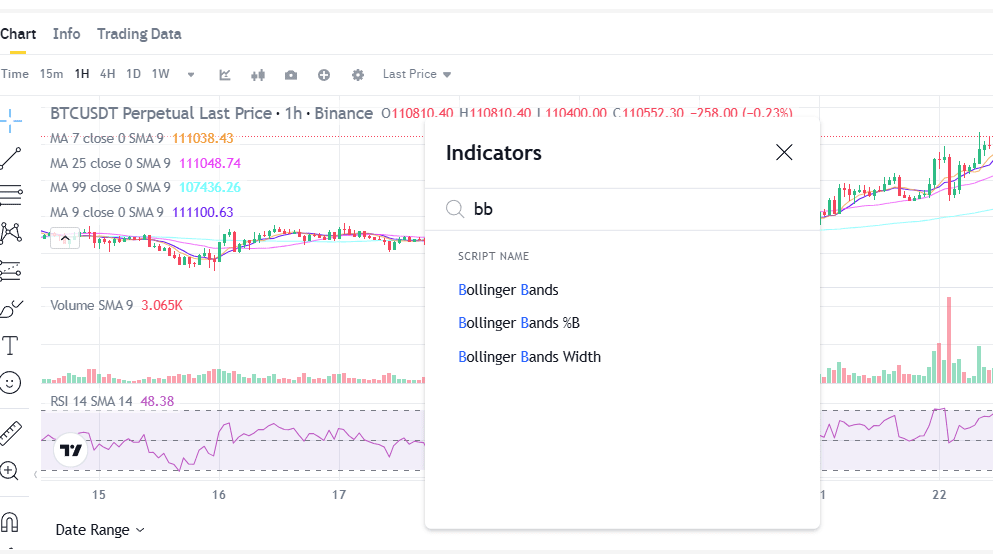
First of all, we have Bollinger Bands. You may have heard of it a lot, but to put it simply, it is an indicator created by a financial analyst named John Bollinger.
First, search for Bollinger Bands and complete the Binance chart settings.
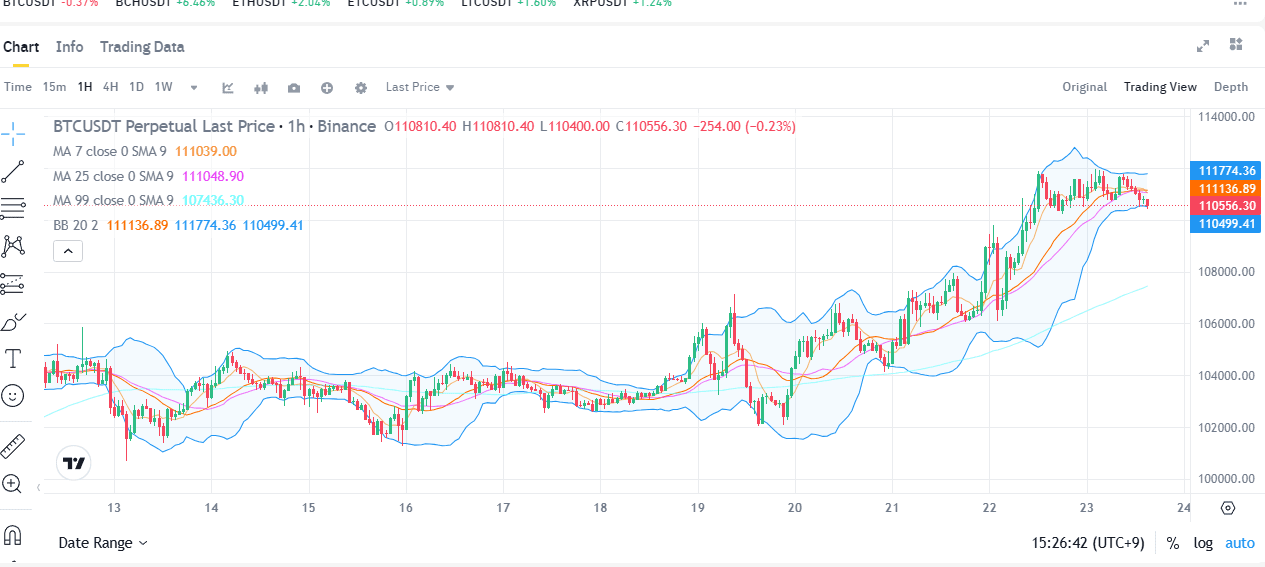
So, the key is how to look at this. The method is simple.
As you can see, you can buy when the width expands significantly in a short period and the price is rising. So, when should you sell?
This is also very simple, but you can sell when the candles are trying to break through the Bollinger Bands or when they actually break through.
However, this indicator is not 100% accurate. Therefore, if you make a mistake in cutting losses or taking profits, you could suffer significant losses at once. So please understand it as a reference rather than placing too much faith in it.
RSI
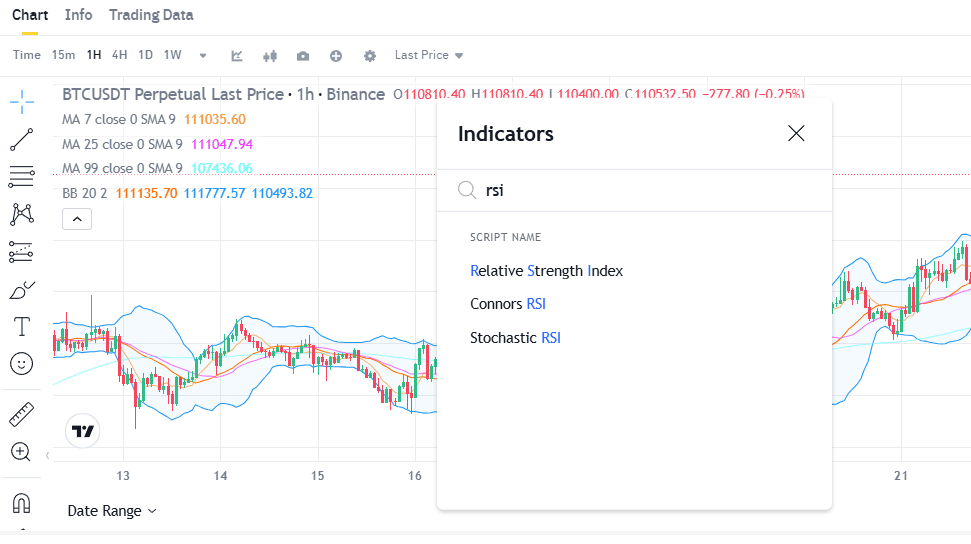
Next, we will look at the RSI. This stands for Relative Strength Index and is an indicator that compares the pressure of price increases and decreases.
This is a technique that I personally recommend because it is much simpler than Bollinger Bands. Once you complete the Binance chart setup like this, you will see a screen like the one above.
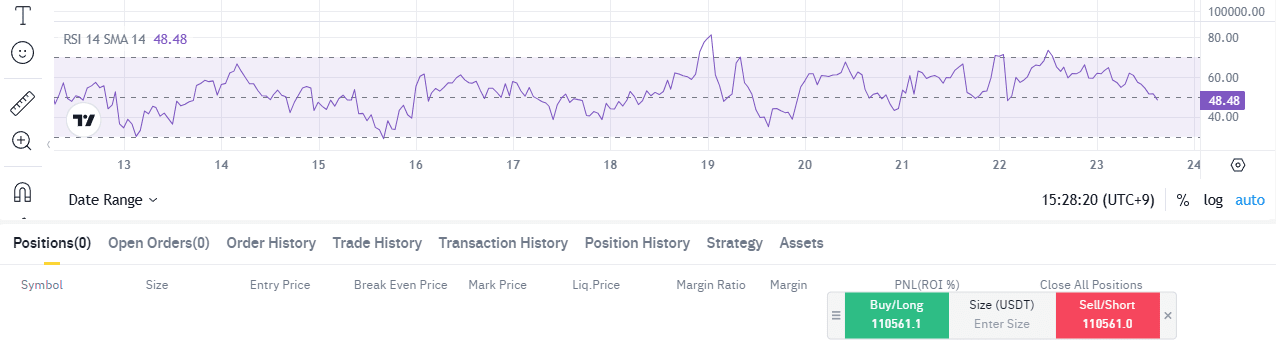
At this time, if the RSI is below 40 based on the weekly chart, it can be considered undervalued, and if the RSI is above 60, it can be judged as overvalued.
On the other hand, when looking closely at the 1-hour candle, it is generally at the low point when the RSI is around 25. Therefore, I think it would be good for you reading this to focus on the two indicators mentioned today for your judgment.
Today, we briefly learned about how to set up the Binance chart. I hope you remember to focus on the 'basics' rather than cramming various indicators into your head by setting multiple indicators.
If you have not yet registered for Binance, please sign up using the link below. By signing up through this link, you can receive a 20% discount on fees, which is a very simple benefit available upon initial registration. Therefore, I recommend that you do not miss out on this opportunity.