#MyEOSTrade $BTC
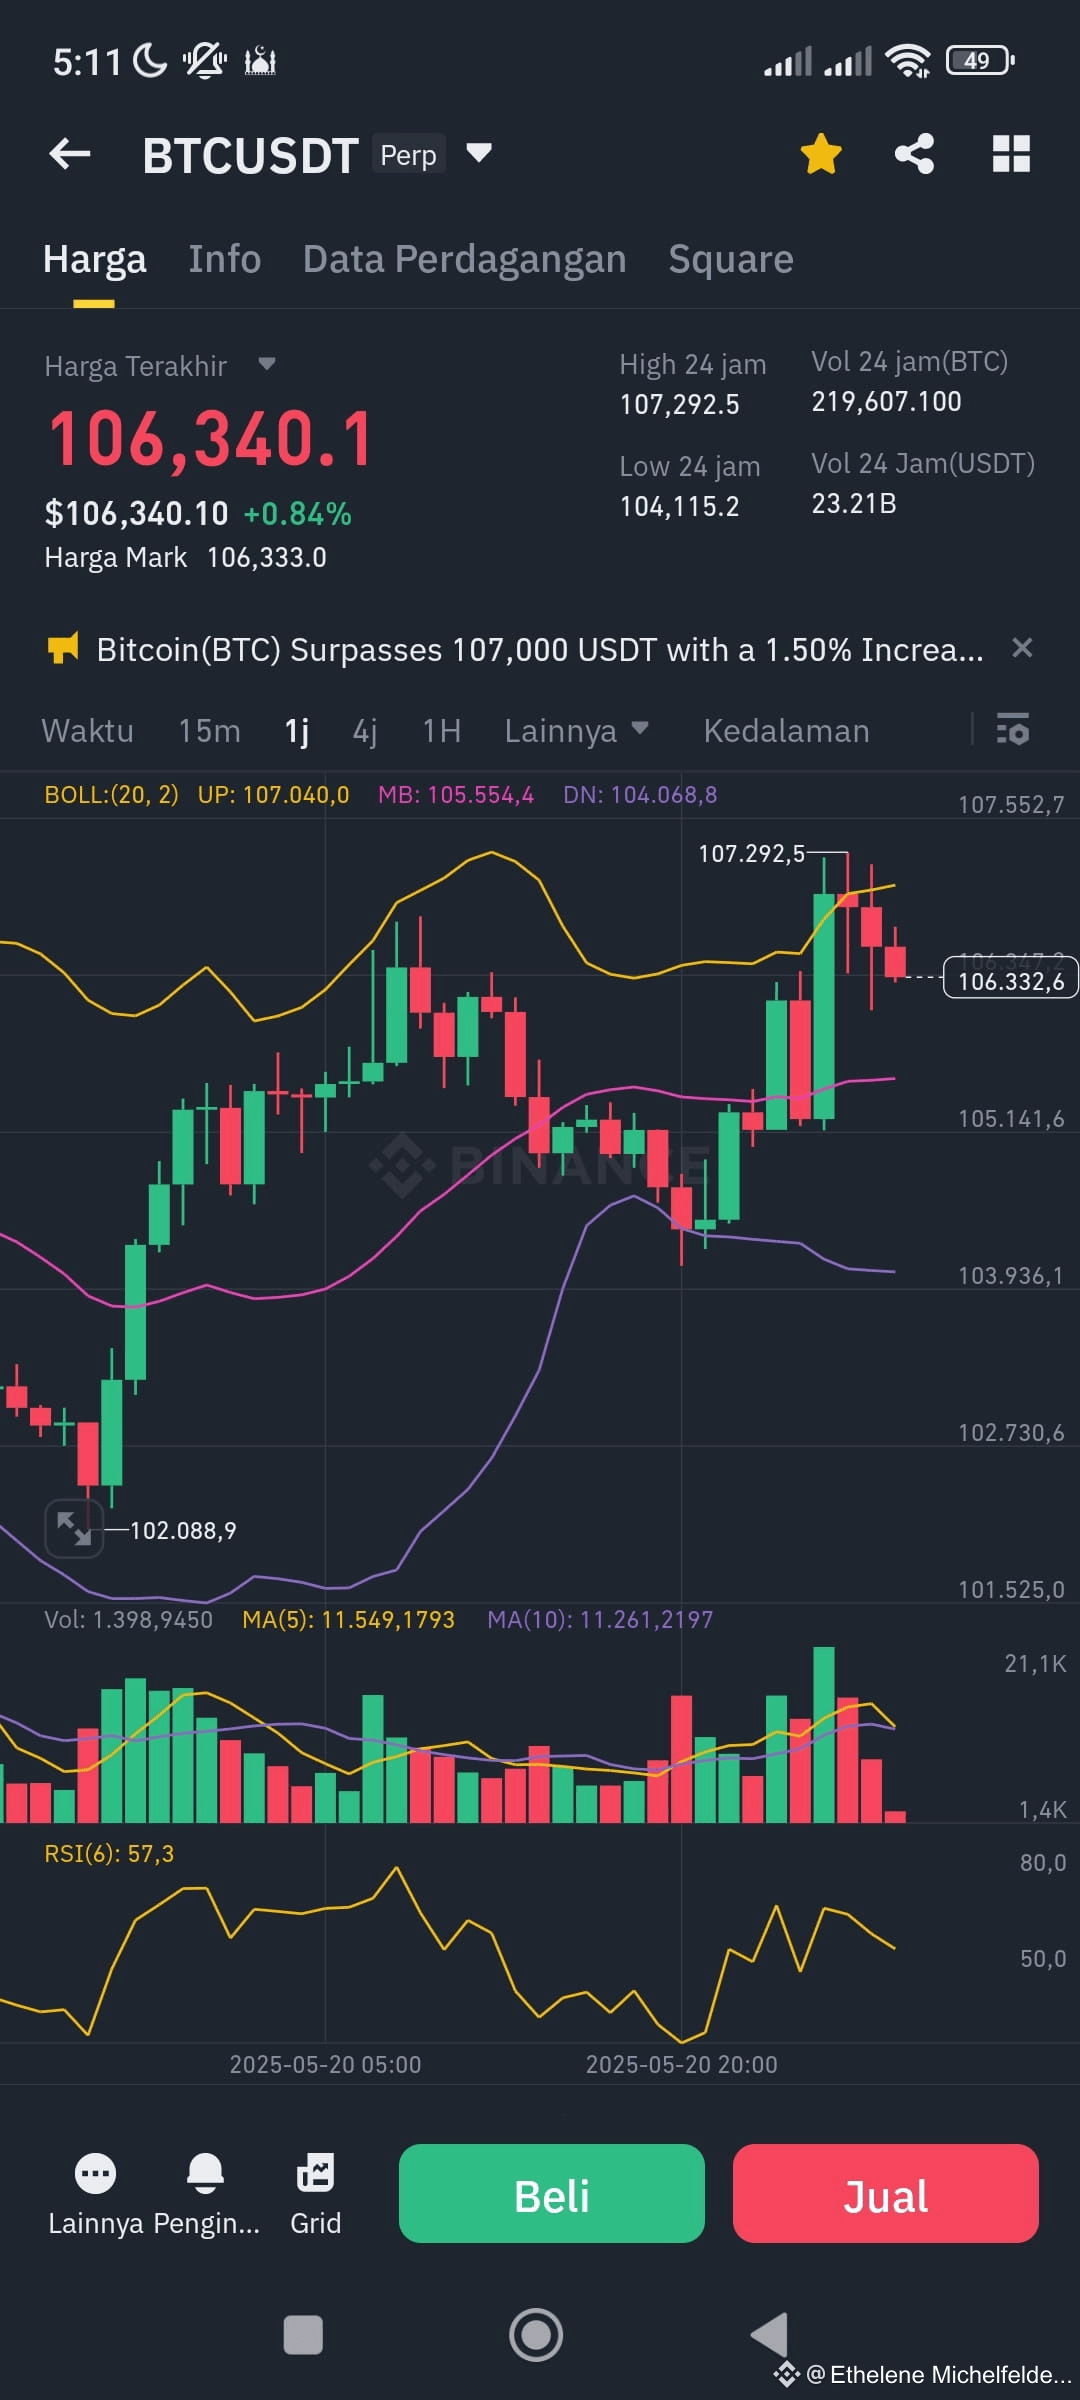
Based on the chart (1-hour timeframe for the BTC/USDT pair), here are some technical analysis points and a brief prediction for the next 2 hours:
1. Current Price Trend:
Last price: 106,340 USDT.
The price touched 107,292 USDT (resistance).
Currently, a correction is occurring after a sharp rise.
2. Bollinger Bands Indicator:
The price touched the upper band and started to decline.
This usually indicates overbought conditions and potential correction (which is currently happening).
3. Volume:
High volume occurred when the price rose, and slightly decreased during the correction — this indicates that buyers are still active, but momentum is starting to weaken.
4. RSI (6):
RSI value: 57.3 — this is still neutral leaning upwards, not yet overbought (>70) or oversold (<30).
5. Moving Average (MA5 and MA10):
MA5 is still above MA10, but starting to converge. This could be an early sign of a reversal if the price continues to decline.
Prediction for the Next 2 Hours (Short-term):
If there are no major market sentiments:
Scenario 1 (most likely): The price is likely to move sideways in the range of 105,800 – 106,800 USDT, due to a correction after a strong surge.
Scenario 2 (bullish): If the price holds above 106,000 and buying volume increases, it could retest the resistance at 107,000+.
Scenario 3 (bearish): If there is a breakdown of support at 105,800, it could continue to drop to 105,200 or even 104,800.
Conclusion: In the next 2 hours, it is highly likely that there will be consolidation or a light correction. There are no strong signals for a major breakout or breakdown yet. Monitor the volume and support at 105,800 closely.
Based on the chart (1-hour timeframe for the BTC/USDT pair), here are some technical analysis points and a brief prediction for the next 2 hours:
1. Current Price Trend:
Last price: 106,340 USDT.
The price touched 107,292 USDT (resistance).
Currently, a correction is occurring after a sharp rise.
2. Bollinger Bands Indicator:
The price touched the upper band and started to decline.
This usually indicates overbought conditions and potential correction (which is currently happening).
3. Volume:
High volume occurred when the price rose, and slightly decreased during the correction — this indicates that buyers are still active, but momentum is starting to weaken.
4. RSI (6):
RSI value: 57.3 — this is still neutral leaning upwards, not yet overbought (>70) or oversold (<30).
5. Moving Average (MA5 and MA10):
MA5 is still above MA10, but starting to converge. This could be an early sign of a reversal if the price continues to decline.
Prediction for the Next 2 Hours (Short-term):
If there are no major market sentiments:
Scenario 1 (most likely): The price is likely to move sideways in the range of 105,800 – 106,800 USDT, due to a correction after a strong surge.
Scenario 2 (bullish): If the price holds above 106,000 and buying volume increases, it could retest the resistance at 107,000+.
Scenario 3 (bearish): If there is a breakdown of support at 105,800, it could continue to drop to 105,200 or even 104,800.
Conclusion: In the next 2 hours, it is highly likely that there will be consolidation or a light correction. There are no strong signals for a major breakout or breakdown yet. Monitor the volume and support at 105,800 closely.