Shiba Inu (SHIB) is currently hovering around a critical market level, with new technical indicators and on-chain data suggesting a potential price reversal.
This moment is particularly important for investors, as price trends show a key turning point in market dynamics.
Price firmly holds the demand zone, market competes for momentum.
Shiba Inu's price is currently stable above the demand zone of $0.00001413, which has historically provided support to buyers.
Despite a pullback after the local high of $0.00001764, SHIB's price still hovers above this area, indicating that the market is in a phase of momentum struggle.
Although the pullback has raised concerns among some holders, the overall market structure remains bullish.

Traders are closely watching these price levels, and historical data also suggests that SHIB's price has a high likelihood of bouncing back strongly in similar areas.
Random RSI shows rebound potential.
Currently, the Relative Strength Index (RSI) is close to the oversold area, which is often a precursor to price reversals.
The market generally believes that this demand area is likely to trigger a reversal, attracting the attention of traders.
Historical patterns show that a deeply oversold random RSI, combined with strong support levels, often indicates an imminent sharp price rebound.
In summary, these technical indicators enhance the potential for SHIB's upward movement.
On-chain data reveals market complexity.
On-chain data provides a more detailed market perspective.
Since May 11, the number of active addresses has significantly decreased from over 5,000 to about 3,200, which may indicate a weakening of market demand and a decrease in retail investor participation.

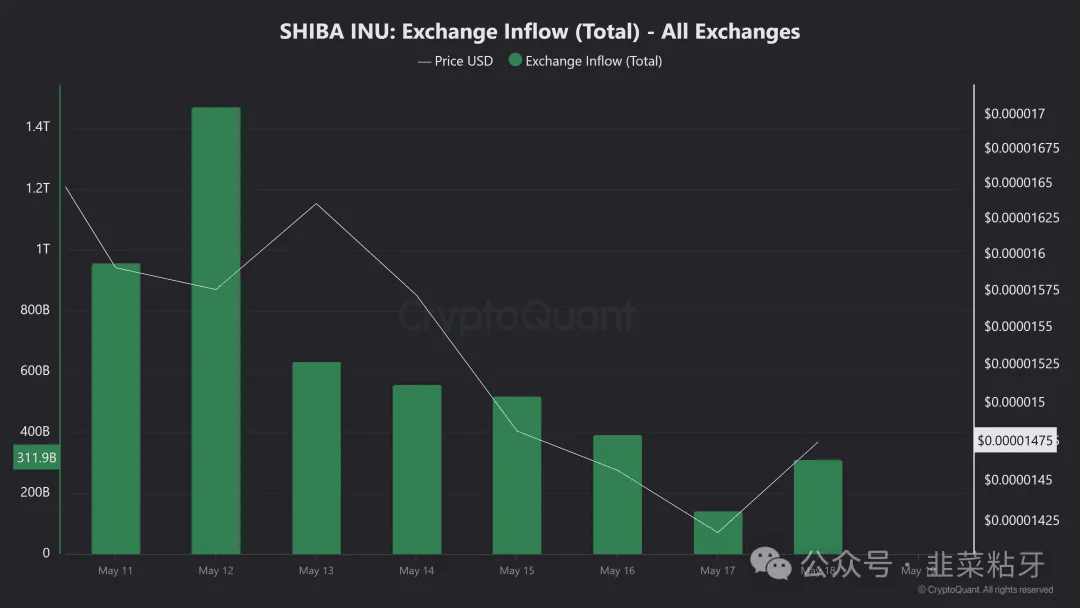
However, despite the generally bearish market, the significant increase in exchange inflow over the past 24 hours indicates that traders may be preparing for impending price fluctuations.
The surge in inflow, combined with technical signals from the demand zone and RSI, may suggest that investors are adopting accumulation strategies rather than simple sell-offs.
Technical signals vs. fundamental tug-of-war.
The current market shows a tug-of-war between bullish technical signals and bearish network activity.
Technical indicators show a certain bullish trend, indicating that bullish sentiment may gradually recover.
As long as SHIB's price remains above the support area of $0.00001413, it is likely to continue rising, attracting more traders and investors' attention.
Conclusion: Challenges and opportunities coexist, and investors need to pay close attention.
Overall, Shiba Inu's current price trend is both challenging and full of opportunities.
The combination of technical indicators and on-chain data provides investors with a unique market perspective.
As SHIB's price hovers near a key demand zone, investors need to closely monitor price changes and related indicators to make informed decisions at the right time.