

You have now learned about the RSI indicator. But you need to know how to use the RSI indicator effectively. It's time to look at how to trade using the Relative Strength Index. Here are some examples of RSI settings to use in different trading strategies:
RSI Indicator Strategy: OBOS Levels
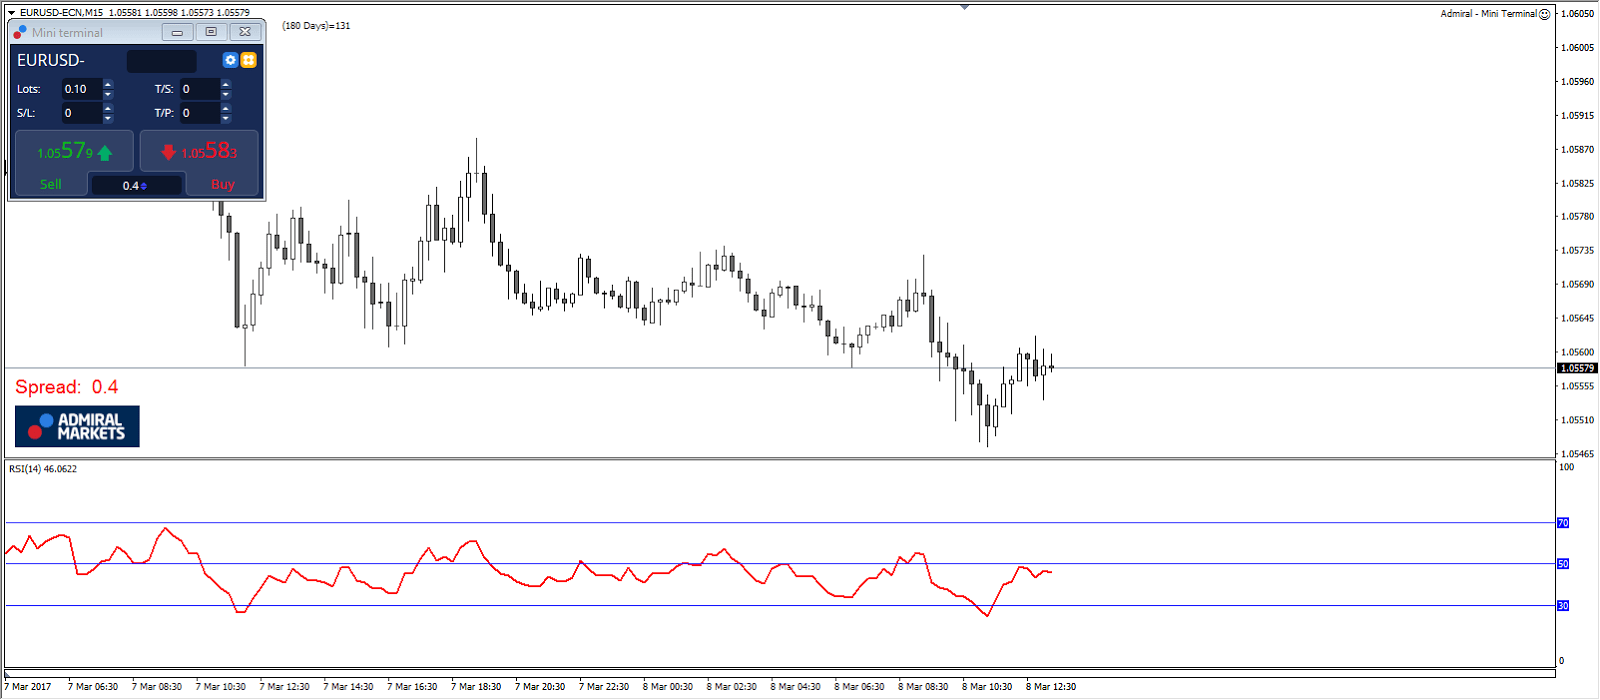
If the RSI is below 30, it means the market is in the oversold zone, and the price may eventually rise. Once a reversal is confirmed, a buy order can be placed. Conversely, if the RSI is above 70, it means it is in the overbought zone and the price may soon decline. After confirming the reversal, a sell order can be placed. The level of 50 is the midpoint that separates the upper (bullish) regions from the lower (bearish) regions. In a bullish trend, the RSI is usually above 50, while in a bearish trend, it is below 50.
RSI Indicator Strategy: Divergence in Two Periods
Apply the short-term RSI indicator (RSI 5) above the longer-term (default) RSI 14, and then watch for transitions. With the RSI 14, there are times when the market does not reach oversold or overbought levels before a trend shift occurs. The short-term RSI is more reactive to recent price changes, so it can show early signs of reversals. When the RSI 5 crosses above the RSI 14, it means that recent prices are rising.
A signal (buy) occurs when the crossover of 5 versus 14 happens when the (RSI 5) blue reaches the oversold zone (below 30). When the RSI 5 crosses below the RSI 14, it indicates that recent prices are declining. The RSI 5 crossover with RSI 14 should occur when the 5 period (blue) is in the overbought area (above 80). Experienced traders may find that their trading performance significantly benefits from combining the RSI trading strategy with Pivot Points.

RSI Indicator Strategy: RSI Trend Lines
Connect the peaks and troughs on the RSI indicator chart itself and trade the breakout of the trend line. To draw an upward RSI trend line, connect three or more points on the RSI line while it is rising. A downward trend line is drawn by connecting three or more points on the declining RSI. A break of the RSI trend line may indicate a potential continuation in prices or a reversal. Keep in mind that a break of the RSI trend line usually precedes a break of the trend line on the price chart, providing an early warning and a very early trading opportunity.

Source: Example on MetaTrader 4 - EURUSD - Please note: past performance does not indicate future results, nor is it a reliable indicator of future performance.
RSI Indicator Strategy: Classic Divergence
The bearish divergence of the RSI (Relative Strength Index) occurs when the price makes a new higher peak than the previous one, while the RSI indicator declines and forms a smaller peak. You will typically see RSI divergence forming at the top of a bull market, which is known as a reversal pattern. Traders anticipate a reversal when RSI divergence is formed. It is a preliminary warning of a reversal, as it appears in many candles before the bullish trend changes direction and breaks below its support line.
Conversely, bullish divergence of the RSI will form when the price makes a new lower low, and the RSI makes a higher low. This is a preliminary warning signal that the trend may change from bearish to bullish. RSI divergence is widely used in forex technical analysis. Some traders prefer to use higher time frames (4 hours or daily) to trade the RSI. By using these optimal RSI settings, you can gain multiple buy and sell signals from the RSI.

