

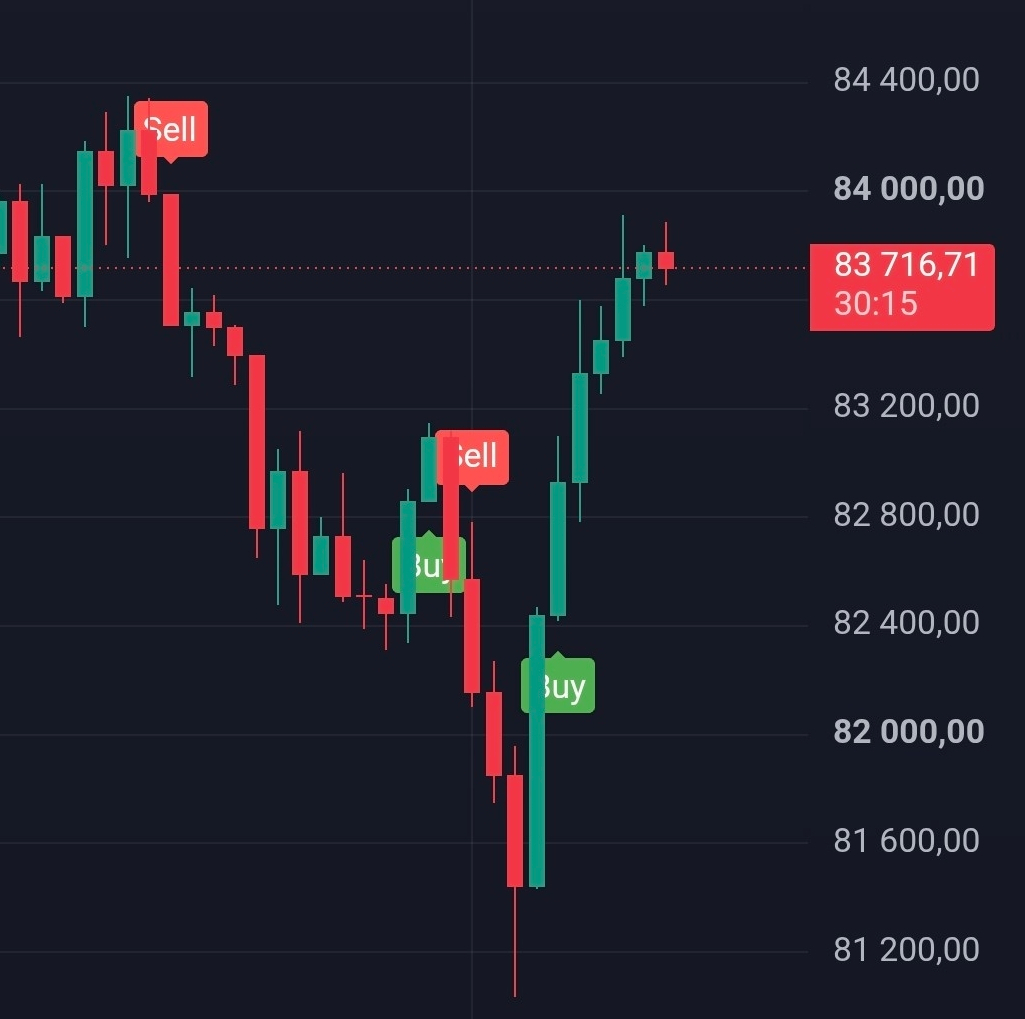
$GMT
Here is the current technical and engineering analysis for currency $GMT (STEPN) based on the latest available data until April 19, 2025:
Current price and performance
Current price: $0.0610
Daily change: +20.03%
Highest price of the day: $0.0635
Lowest price of the day: $0.0492
Market capitalization: approximately $172 million
Daily trading volume: over $545 million
This significant increase in price and trading volume indicates rising interest from investors and notable activity in the market.
Technical analysis
Technical indicator signals
Total indicators: 14 buy recommendations, 7 neutral, 4 sell
Moving averages: 9 buy recommendations, 2 neutral, 4 sell
Oscillators: 5 buy recommendations, 5 neutral, 0 sell
These data indicate a strong bullish trend in the short term, reinforcing the likelihood of a continued positive trend.
Engineering analysis (pattern analysis)
Some analyses suggest the formation of an ascending triangle pattern, which is a technical pattern indicating the possibility of a continued upward trend. If the resistance level at $0.16425 is broken, it may lead to further increases towards targets like $0.16986. However, if the price fails to break the resistance, a pullback towards the support level at $0.16000 may occur.
#TrumpVsPowell #VoteToDelistOnBinance #PowellRemarks