Wait a lot 😆💥💥
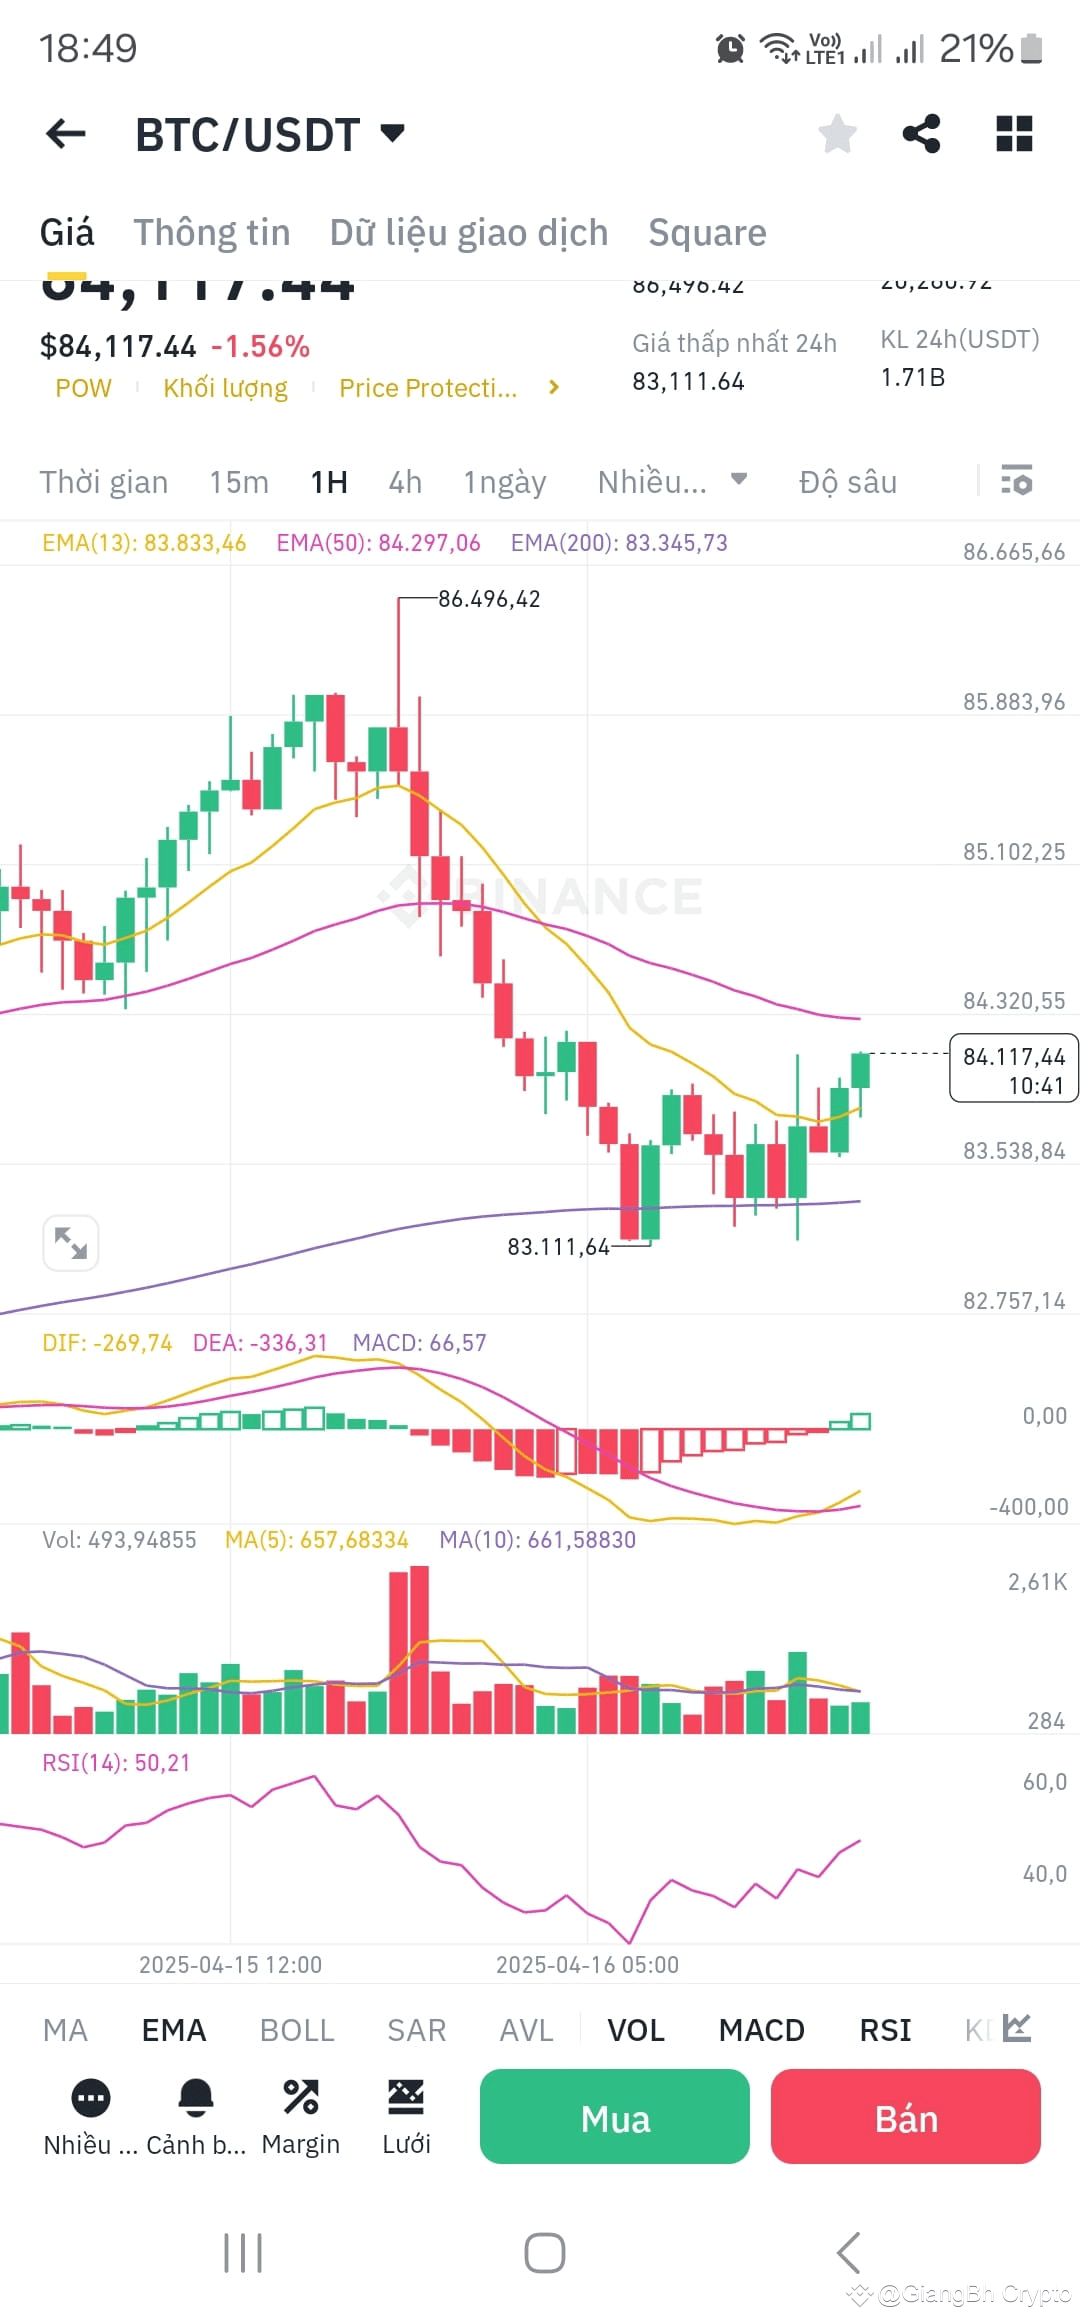
The BTC/USDT chart on the 1H timeframe shows a short-term bounce, then:
The price has closed above EMA13 (83,833) and touched EMA50 (84,297) → short-term EMA breakout signal.
The histogram has clearly turned green → confirming the upward momentum.
RSI: For the first time breaking above 50 (currently 50.21)
→ buying pressure returns to the market.
Volume is stable, no cash outflow, positive signal.
Near resistance: EMA50 (84,297)
If it clearly breaks above EMA50, the next targets could be:
85,000 – 85,300
Even 85,800 – 86,000.
#CanadaSOLETFLaunch
💥 Note: I only write personal observations for you to follow and gain more information and reference perspectives. Not investment advice, and there is no group or copy link for you!!!
This season's market is sensitive, all observations are in the short term!
The BTC/USDT chart on the 1H timeframe shows a short-term bounce, then:
The price has closed above EMA13 (83,833) and touched EMA50 (84,297) → short-term EMA breakout signal.
The histogram has clearly turned green → confirming the upward momentum.
RSI: For the first time breaking above 50 (currently 50.21)
→ buying pressure returns to the market.
Volume is stable, no cash outflow, positive signal.
Near resistance: EMA50 (84,297)
If it clearly breaks above EMA50, the next targets could be:
85,000 – 85,300
Even 85,800 – 86,000.
#CanadaSOLETFLaunch
💥 Note: I only write personal observations for you to follow and gain more information and reference perspectives. Not investment advice, and there is no group or copy link for you!!!
This season's market is sensitive, all observations are in the short term!