



The cryptocurrency world was shocked this week with wild XRP price predictions emerging, especially after the lawsuit with the U.S. SEC officially concluded.
The price of XRP, the token associated with Ripple Labs, surged 12% to $2.52 on March 19, 2025, after the U.S. Securities and Exchange Commission (SEC) dropped a four-year lawsuit against the company.
According to CoinMarketCap, XRP trading volume exploded, social media lit up, and XRP's market cap reached $146 billion, surpassing Tether's $143 billion to claim the third spot among cryptocurrencies.
Analysts are currently setting bold price targets of $38, driven by technical patterns. Meanwhile, retail traders are stirring up an online frenzy.
But digging deeper into the data, this price surge is based on leverage rather than whale wallets, leaving some to wonder: can it last?
The SEC case collapse changes the trajectory of XRP.
It all started in December 2020 when the SEC sued Ripple, claiming XRP was an unregistered security.
Ripple fights back, arguing that it is a currency, plain and simple. The legal battle drags on, damaging XRP's price and reputation.
CoinMarketCap data shows that this currency's market cap has dropped from $23 billion at the end of 2020 to $10 billion in 2022.
Major exchanges like Coinbase have even removed XRP from their listing as the situation grows increasingly unstable.
Then came the turning point. On Wednesday, March 19, 2025, the SEC waved the white flag.
Ripple's CEO, Brad Garlinghouse, did not hesitate to call this a "resounding victory" in a post on X that day and criticized the SEC's approach as a "legal war."
This news caused XRP's price to rise by 14% in just one week, according to CoinMarketCap. Beyond Ripple, those in the industry saw even larger impacts.
"This could reshape how the U.S. views digital assets," an expert told Reuters on March 19. For XRP, this is a fresh start.
XRP Price Prediction: The $38 target emerges from technical charts.
Cryptocurrency analysts are closely studying XRP's charts, and they like what they see. Gert van Lagen, a prominent analyst, used X on March 19 to highlight a seven-year pattern.
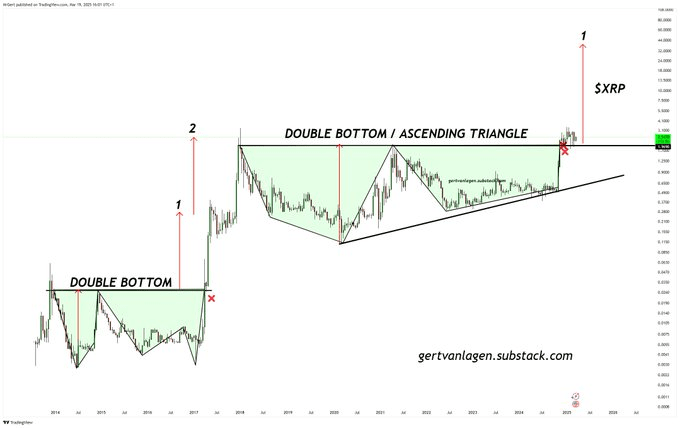
He calls this a "double bottom triangle/ascending triangle"—the same pattern that created a strong bullish run from 2014 to 2017.
What is his price prediction for XRP? XRP will reach $38, skyrocketing by 1,400% from the current price of $2.52.
The numbers add up. A calculated move from the neckline of the pattern, which the price of XRP recently tested as support, aligns with that $38 target.
At that price, XRP's market cap would soar to $2.2 trillion, surpassing Bitcoin's $1.9 trillion.
Technical indicators reinforce optimism: XRP is above the 50-day SMA ($2.45) and is on a long-term upward trajectory with the 200-day SMA at $1.66.
However, van Lagen warns that $3 is the next big challenge—hold strong, and the sky will be the limit. The crucial moment for XRP is not only happening on the charts—but also lighting up social media.
Analyst Ali Martinez, citing Santiment data on March 19, noted a spike in mentions of XRP.
"Retail interest is surging," he posted. The chatter indicates FOMO, a classic recipe for short-term spikes. Santiment shows that XRP-related posts have increased by 40% just in the past week.
But here's the reality: the rally is not as it seems. Martinez points out that whale wallets - those holding over $1 million in XRP - have yet to budge.
Instead, open interest in futures surged by $200 million, according to Santiment. This means leveraged bets, not cash, are driving this 12% increase.
"Leverage cuts both ways," Martinez warns. "A strong squeeze could cause it to collapse."
With the Fear and Greed Index at 32 (Fear) on March 19, there is plenty of anxiety lurking behind this noise.
Market Pulse: Can XRP's price hold this level?
At a glance, XRP's statistics appear strong. It rose 12% in 24 hours and 14% over seven days, boasting a market cap of $146 billion. Daily trading volume reached $8 billion—up 30% from the previous week.
Technically, the price is fairly high compared to the 50-day SMA ($2.45), while the 200-day SMA ($1.66) indicates steady upward momentum, according to TradingView.
However, there is one notable thing. This price surge was driven by futures contracts, not spot purchases. If it breaks above $3, buyers could continue to push the price up.
However, if it drops below $2.45, it could collapse quickly. The SEC's victory has removed one obstacle, but regulatory uncertainty remains high. Could this case set a precedent? Experts say it is possible.
A $38 target is not impossible - van Lagen's chart makes a compelling argument - but mere hype won't achieve that goal.