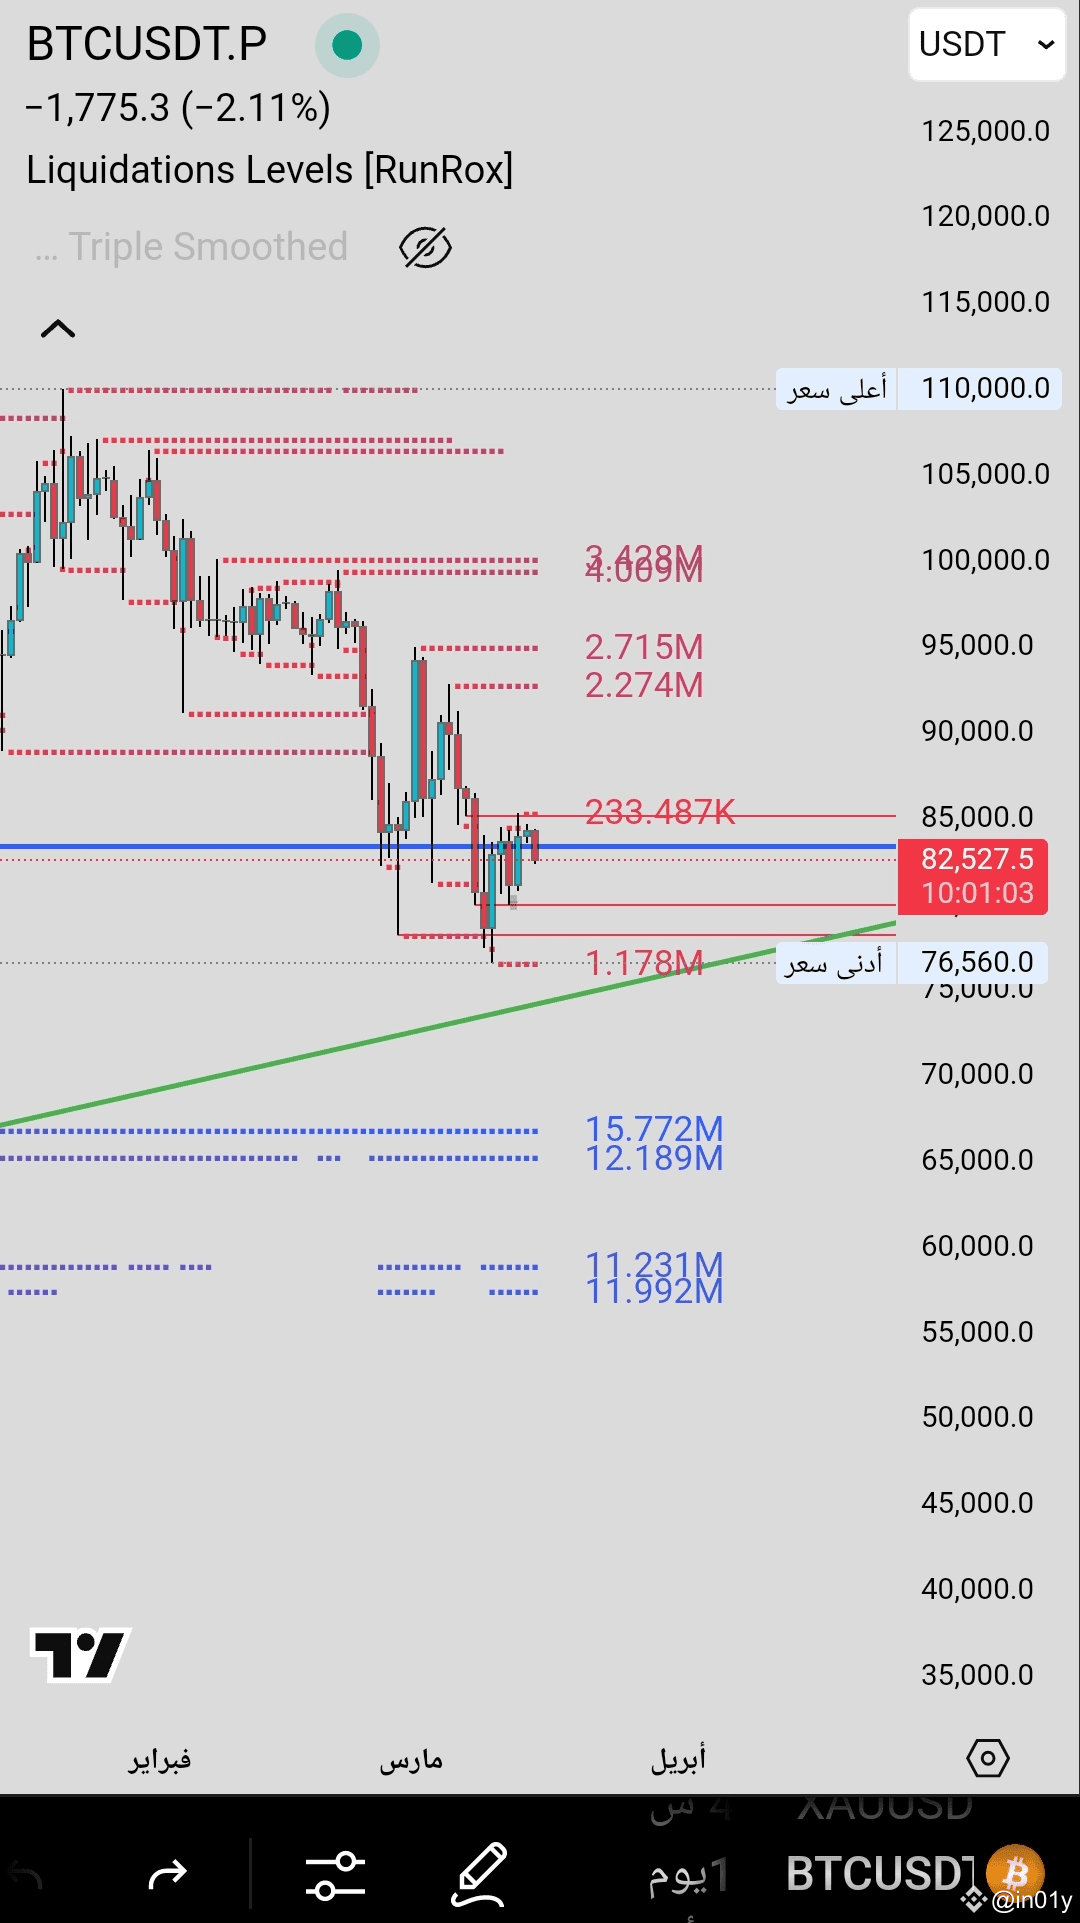
Bitcoin Chart Analysis ($BTC ) #TradersBootCamp #BTC
The chart displays liquidation levels that help identify potential liquidity areas, along with important supports and resistances.
🔹 Current Situation:
Current Price: 82,527.5 USDT
Overall Trend: Bearish in the short term after breaking some important supports.
Nearest Strong Support: 76,560 USDT (may form a potential bounce area).
Nearest Strong Resistance: 85,000 - 90,000 USDT where there is high liquidity that may hinder the rise.
🔸 Potential Scenarios:
✅ 📈 Buy Scenario (Long):
Entry: Waiting for the price to reach 76,500 - 77,500 USDT
Stop Loss: Daily close below 75,000 USDT
First Target: 85,000 USDT
Second Target: 90,000 USDT
❌ 📉 Sell Scenario (Short):
Entry: At resistance 85,000 - 87,000 USDT
Stop Loss: Above 88,000 USDT
First Target: 80,000 USDT
Second Target: 77,000 USDT
💡 Note: If the price breaks 76,500 USDT strongly, we may witness a drop towards 70,000 - 65,000 USDT where there is massive liquidity.
Do you want a detailed analysis based on a specific timeframe?
$BTC
The chart displays liquidation levels that help identify potential liquidity areas, along with important supports and resistances.
🔹 Current Situation:
Current Price: 82,527.5 USDT
Overall Trend: Bearish in the short term after breaking some important supports.
Nearest Strong Support: 76,560 USDT (may form a potential bounce area).
Nearest Strong Resistance: 85,000 - 90,000 USDT where there is high liquidity that may hinder the rise.
🔸 Potential Scenarios:
✅ 📈 Buy Scenario (Long):
Entry: Waiting for the price to reach 76,500 - 77,500 USDT
Stop Loss: Daily close below 75,000 USDT
First Target: 85,000 USDT
Second Target: 90,000 USDT
❌ 📉 Sell Scenario (Short):
Entry: At resistance 85,000 - 87,000 USDT
Stop Loss: Above 88,000 USDT
First Target: 80,000 USDT
Second Target: 77,000 USDT
💡 Note: If the price breaks 76,500 USDT strongly, we may witness a drop towards 70,000 - 65,000 USDT where there is massive liquidity.
Do you want a detailed analysis based on a specific timeframe?
$BTC