BNB

Publicar


财经少华
·
--
Several Common Bottom Signals
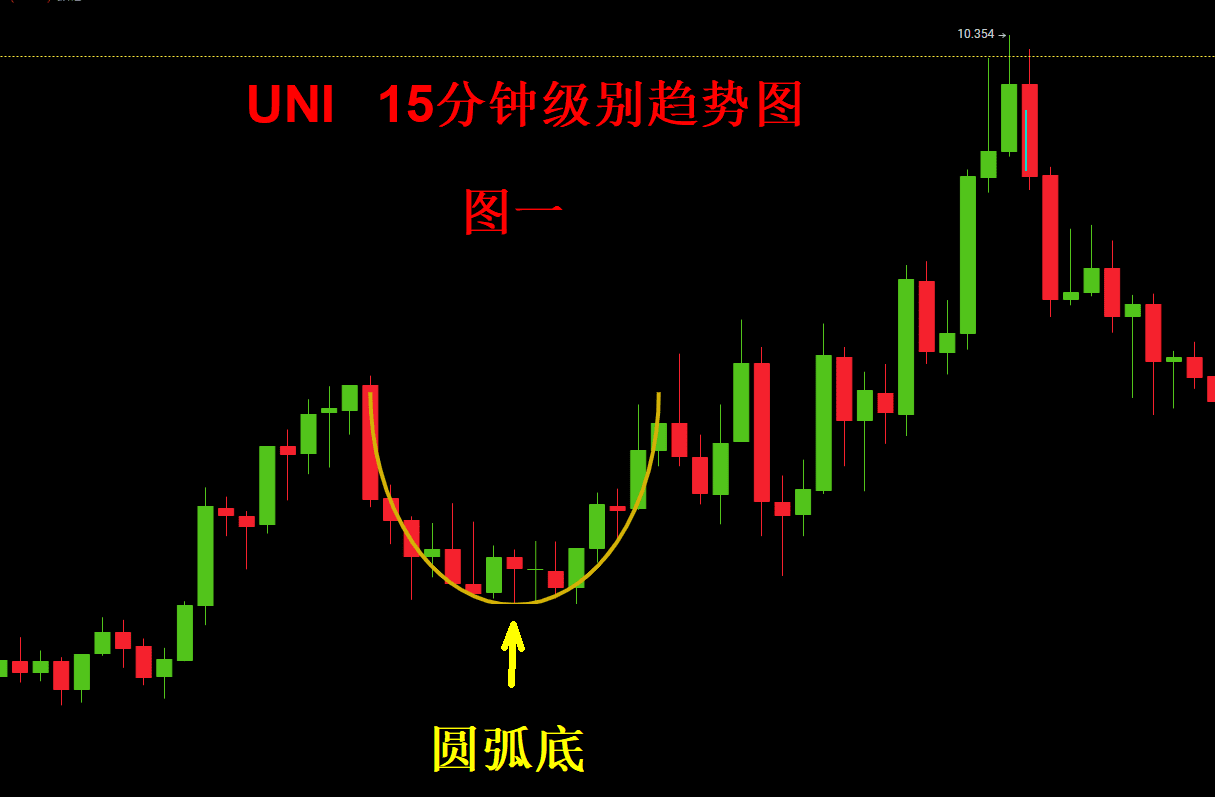
1. The Round Bottom refers to a bottom pattern where the average price line of the candlesticks forms a circular arc when the coin price is in a low price zone. This pattern is formed due to some bullish funds gradually building positions in small amounts, indicating that the coin price has identified a support level at a stage bottom. Its theoretical upward movement is usually one times the increase from the lowest price to the neck line position. (Figure 1)
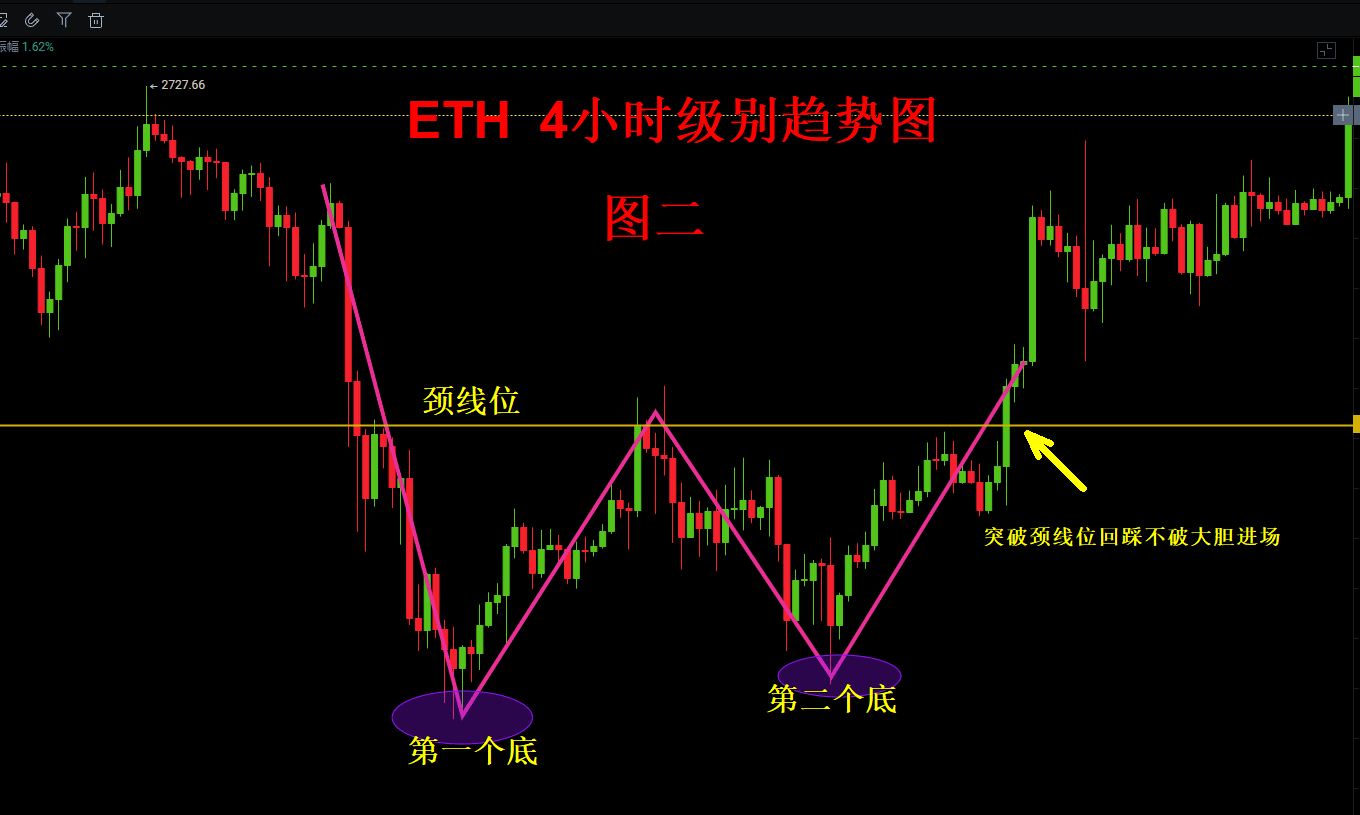
2. The Double Bottom refers to signs of stabilization after the market and individual coins have experienced a long period of decline, forming a double bottom pattern on the candlestick chart, with increased trading volume on the right side. At this point, once the neck line position is broken, it is the time for us to boldly bottom-fish. (Figure 2)
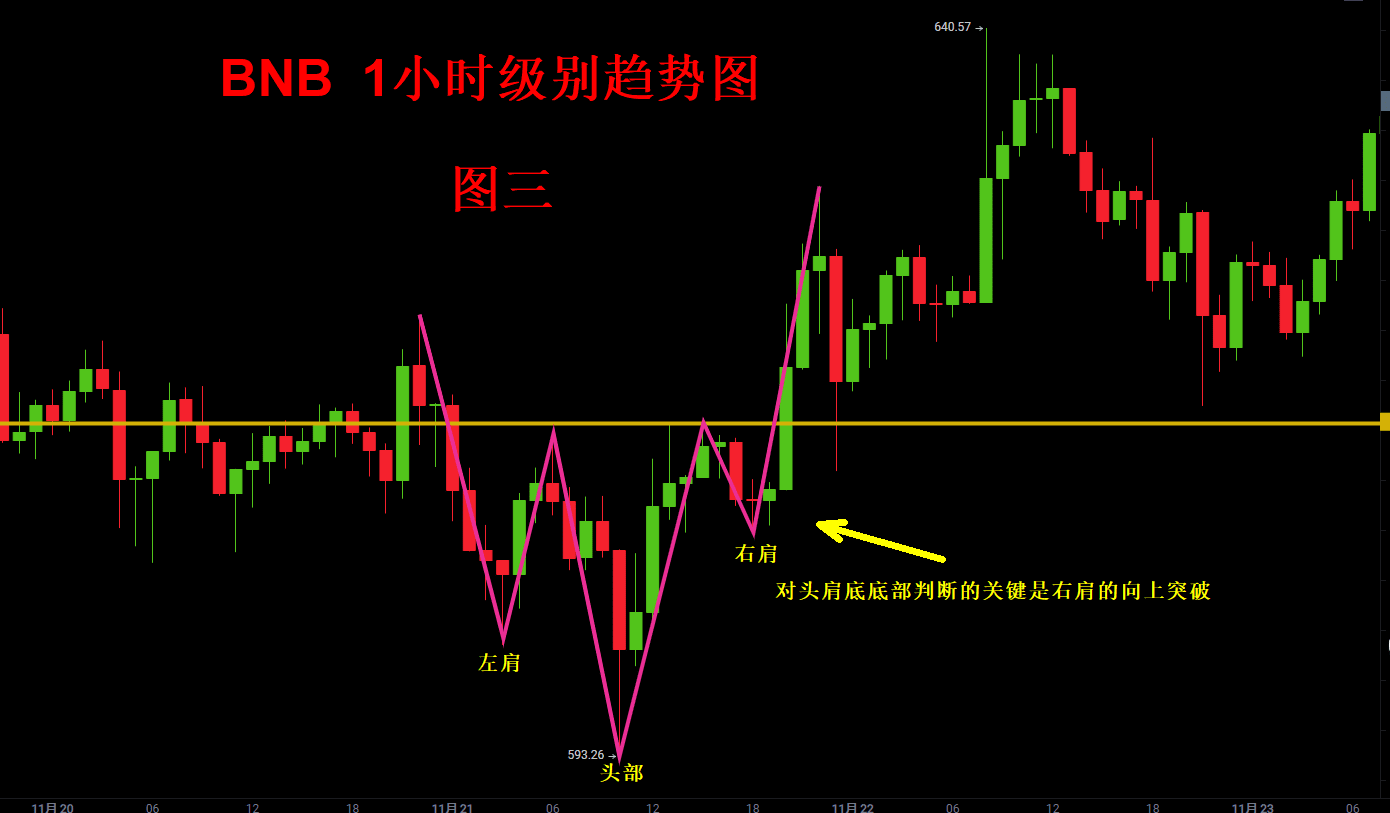
3. The Head and Shoulders Bottom usually appears at the bottom. After the coin price continuously sets new lows, it begins to rebound. After the rebound ends, it fails to create new lows and starts to rise above the previous low point. When the coin price rises above the previous high point, which is the neck line, the timing for bottom-fishing arrives. (Figure 3)
Follow me to learn more about cryptocurrency information and consulting.
1. The Round Bottom refers to a bottom pattern where the average price line of the candlesticks forms a circular arc when the coin price is in a low price zone. This pattern is formed due to some bullish funds gradually building positions in small amounts, indicating that the coin price has identified a support level at a stage bottom. Its theoretical upward movement is usually one times the increase from the lowest price to the neck line position. (Figure 1)
2. The Double Bottom refers to signs of stabilization after the market and individual coins have experienced a long period of decline, forming a double bottom pattern on the candlestick chart, with increased trading volume on the right side. At this point, once the neck line position is broken, it is the time for us to boldly bottom-fish. (Figure 2)
3. The Head and Shoulders Bottom usually appears at the bottom. After the coin price continuously sets new lows, it begins to rebound. After the rebound ends, it fails to create new lows and starts to rise above the previous low point. When the coin price rises above the previous high point, which is the neck line, the timing for bottom-fishing arrives. (Figure 3)
Follow me to learn more about cryptocurrency information and consulting.