Overall Analysis
Recent prices are in a volatile consolidation phase.
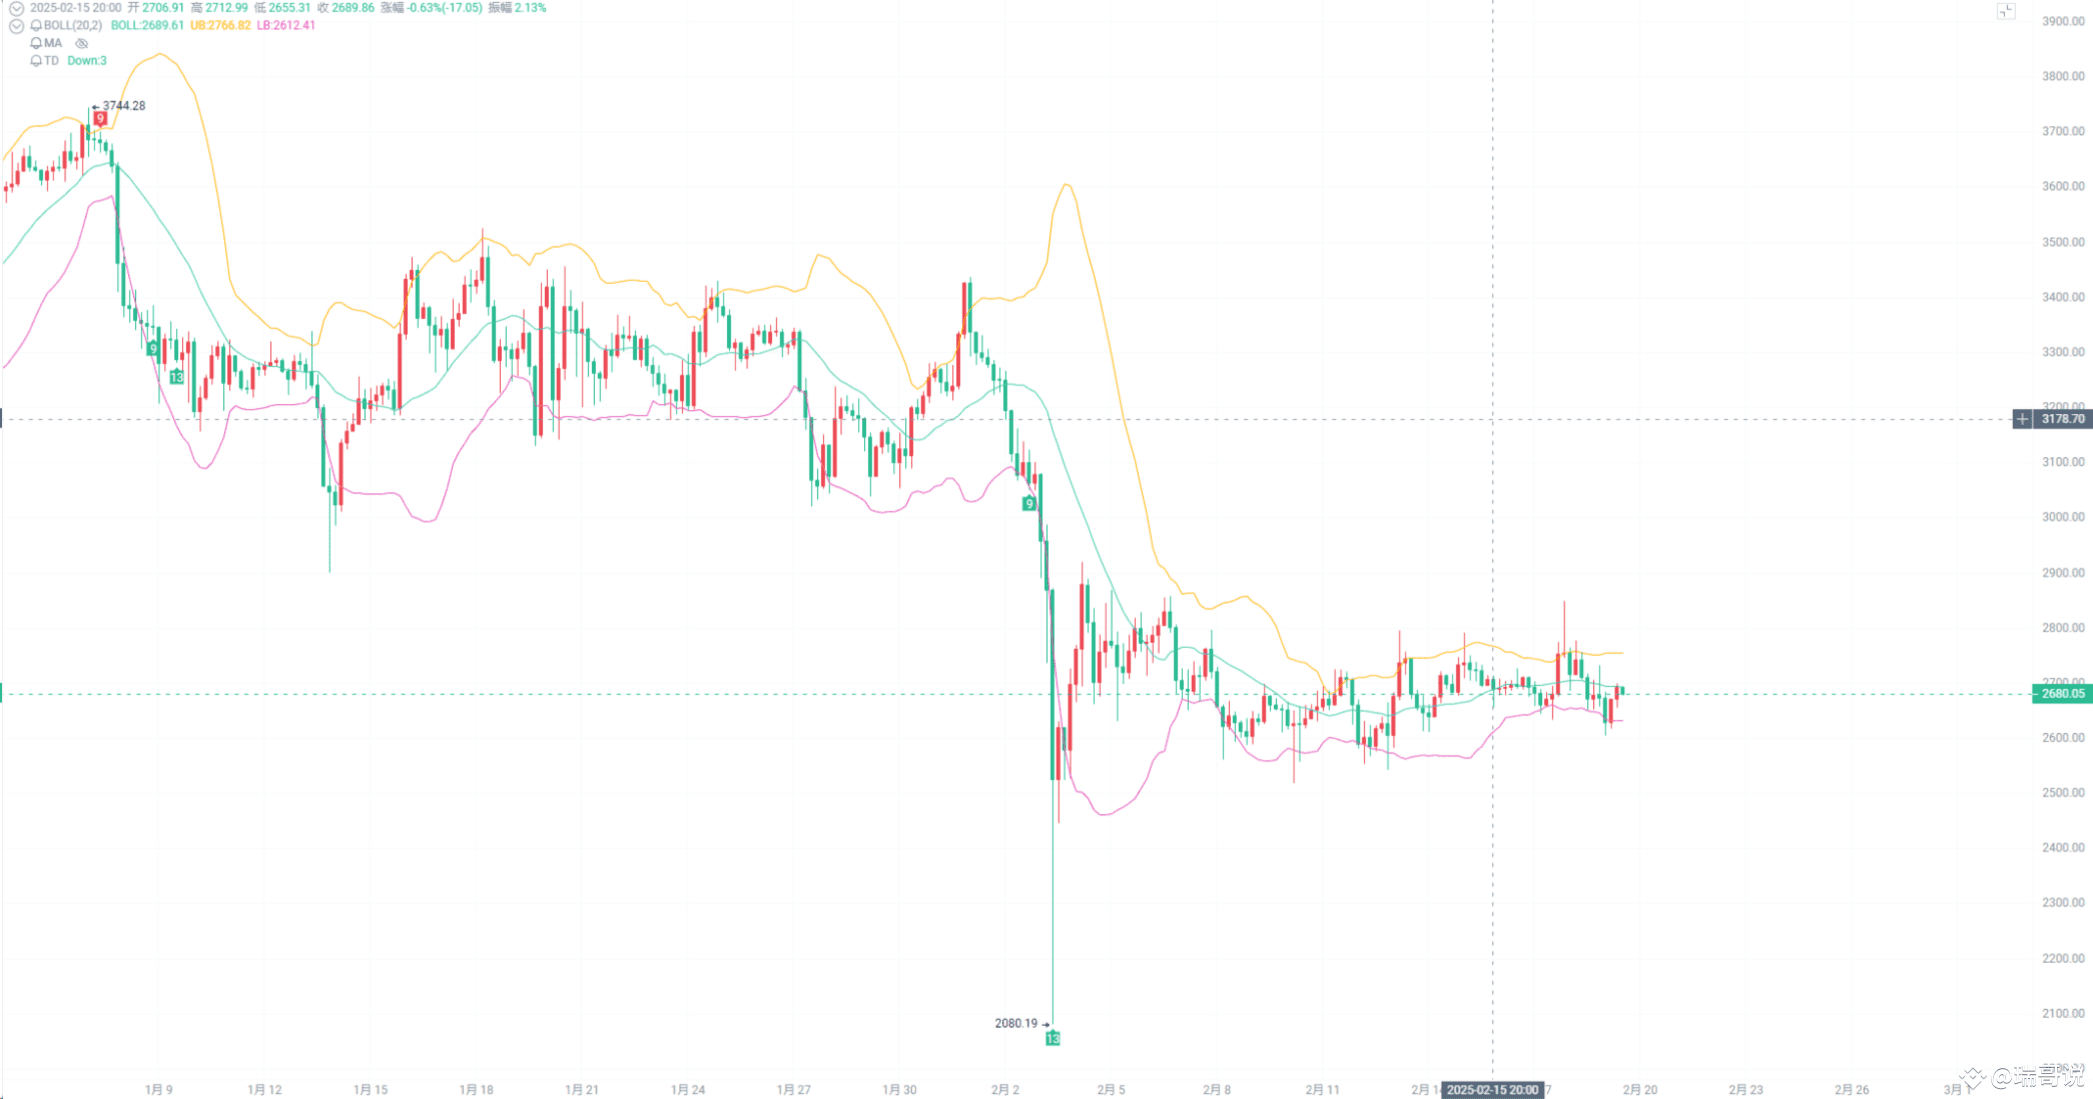
In the short term, the market is currently exhibiting a state of volatile consolidation after experiencing a previous downtrend. The "Doji" pattern in candlestick analysis and the stability shown by the Bollinger Bands indicate that the bullish and bearish forces in the market are temporarily balanced. The clarity of support and resistance levels provides a possible turbulent range for the market: support below at 2500-2600 and resistance above at 3400-3500, which are key points to pay attention to in the short term.
In indicator analysis, the TD indicator shows that the market is digesting the previous downtrend and has not yet formed a clear new buying or selling sequence. Therefore, the market may be looking for a new direction. The Bollinger Bands indicate a decrease in market volatility, hovering around the mid-band, suggesting that it may continue to operate within the consolidation range in the short term.
Recommendation: Currently, the market lacks a clear directional trend, and it is advised that investors remain on the sidelines, waiting for more explicit market signals. If the price breaks through key resistance or support levels (3400-3500 or 2500-2600), it can serve as a reference signal for short-term operations. For medium to long-term investors, it is recommended to patiently wait for the market to clarify its direction before making decisions to reduce the risk of uncertainty.
Technical Analysis
Candlestick Pattern: Prices are overall in a downtrend, accompanied by a rebound, currently in a volatile consolidation.
TD: The market is in a consolidation phase, seeking a new direction after significant prior declines.
BOLL: The market has entered a volatile consolidation period, with volatility stabilizing, lacking a clear direction.
Potential Buy/Sell Points
Buy Point: 2600 USDT (close to recent lows, with support potential, and the convergence of the Bollinger Bands indicates a volatile state, suitable for bottom fishing.)
Long Stop Loss Point: 2500 USDT (breaks below recent low support, confirming further downside risk.)
Sell Point: 2900 USDT (close to previous support levels, expected rebound weakness, and still at the upper part of the volatile range, suitable for positioning shorts.)
Short Stop Loss Point: 3000 USDT (breaks above the upper boundary of the previous consolidation range, potentially triggering upward enthusiasm, further reversing the pullback range.)
Recent prices are in a volatile consolidation phase.
In the short term, the market is currently exhibiting a state of volatile consolidation after experiencing a previous downtrend. The "Doji" pattern in candlestick analysis and the stability shown by the Bollinger Bands indicate that the bullish and bearish forces in the market are temporarily balanced. The clarity of support and resistance levels provides a possible turbulent range for the market: support below at 2500-2600 and resistance above at 3400-3500, which are key points to pay attention to in the short term.
In indicator analysis, the TD indicator shows that the market is digesting the previous downtrend and has not yet formed a clear new buying or selling sequence. Therefore, the market may be looking for a new direction. The Bollinger Bands indicate a decrease in market volatility, hovering around the mid-band, suggesting that it may continue to operate within the consolidation range in the short term.
Recommendation: Currently, the market lacks a clear directional trend, and it is advised that investors remain on the sidelines, waiting for more explicit market signals. If the price breaks through key resistance or support levels (3400-3500 or 2500-2600), it can serve as a reference signal for short-term operations. For medium to long-term investors, it is recommended to patiently wait for the market to clarify its direction before making decisions to reduce the risk of uncertainty.
Technical Analysis
Candlestick Pattern: Prices are overall in a downtrend, accompanied by a rebound, currently in a volatile consolidation.
TD: The market is in a consolidation phase, seeking a new direction after significant prior declines.
BOLL: The market has entered a volatile consolidation period, with volatility stabilizing, lacking a clear direction.
Potential Buy/Sell Points
Buy Point: 2600 USDT (close to recent lows, with support potential, and the convergence of the Bollinger Bands indicates a volatile state, suitable for bottom fishing.)
Long Stop Loss Point: 2500 USDT (breaks below recent low support, confirming further downside risk.)
Sell Point: 2900 USDT (close to previous support levels, expected rebound weakness, and still at the upper part of the volatile range, suitable for positioning shorts.)
Short Stop Loss Point: 3000 USDT (breaks above the upper boundary of the previous consolidation range, potentially triggering upward enthusiasm, further reversing the pullback range.)