
The most popular harmonic patterns include:
1. ABCD Pattern
2. Butterfly Pattern
3. Bat Pattern
4. Crab Pattern
5. Gartley Pattern
6. Shark Pattern

These harmonic trading patterns are commonly used by some top traders to identify potential trading setups, with an average win rate of up to 78.7%. Due to the difficulty of learning harmonics, ordinary traders find it hard to get started; today I will provide a lesson on harmonic pattern values. 👇👇👇
1️⃣ ABCD Pattern
The ABCD (or AB = CD) pattern is undoubtedly one of the simplest patterns, consisting of three waves and four points.
First is the driving wave (AB), then the correction wave (BC), followed by another driving wave (DC), which moves in the same direction as the AB wave. By using the Fibonacci retracement tool on the AB segment, the BC segment should accurately reach 0.618. The length of the CD line should be equal to that of the AB line, and the time taken for the price to move from point A to point B should equal the time taken to move from point C to point D.
Traders can choose to place orders in the area close to point C (defined as the potential reversal zone); or they can wait until the entire pattern is completed to establish long or short positions from point D.
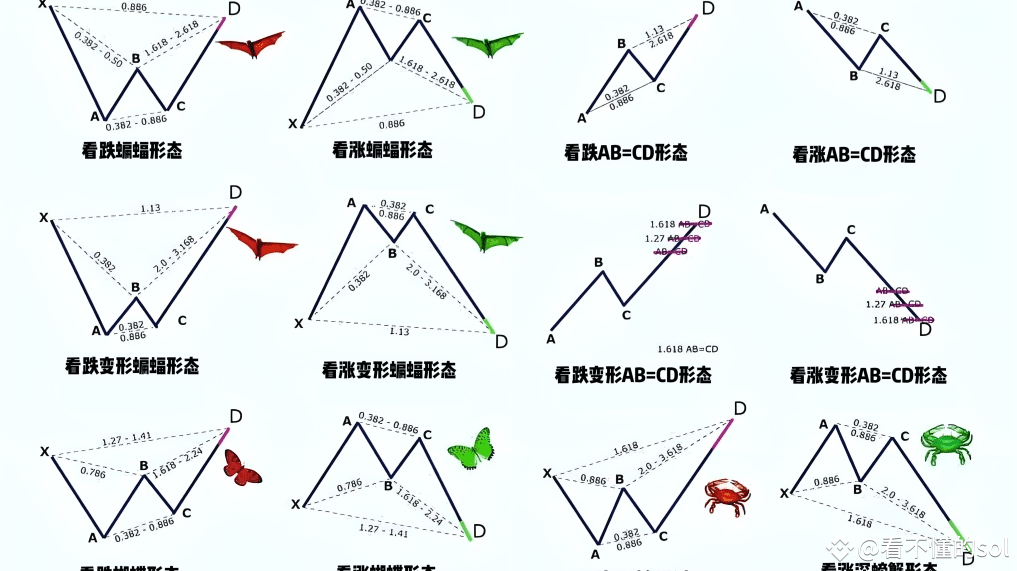
2️⃣ Bat Pattern
The bat pattern is named for its final shape resembling a bat. The bat pattern was identified by Scott Carney in 2001 and is composed of precise elements that can identify potential reversal zones (PRZ).
The bat pattern has one more wave than the ABCD pattern, and it also has an additional point, which we call point X. The first segment (XA) will lead to the BC retracement wave. If the retracement to point B stops at 50% of the initial XA wave, what you might see is a bat pattern.
The CD extension must be at least 1.618 of the BC segment and may reach a height of 2.618. The extension of CD must not be lower than the extension of BC; otherwise, the data becomes invalid. The endpoint (point D) creates a potential reversal zone (PRZ), meaning traders can enter positions to take advantage of price bullish reversals or bearish reversals.
3️⃣ Butterfly Pattern
The butterfly pattern was discovered by Bryce Gilmore, who used various combinations of Fibonacci ratios to identify potential retracement levels.
The butterfly pattern is a reversal pattern consisting of four waves, marked as XA, AB, BC, and CD. The most important ratio to define is the 0.786 retracement of the XA segment. This helps to draw point B, aiding traders in identifying potential reversal zones (PRZ).
4️⃣ Crab Pattern
The crab pattern was also discovered by Scott Carney, following the XA, AB, BC, and CD patterns, allowing traders to enter the market at extreme highs or lows.
The most important feature of the crab pattern is the 1.618 extension of the XA wave, which determines the potential reversal zone. In a bullish crab pattern, the first segment is formed when the price rapidly rises from point X to point A. The AB segment retraces between 38.2% and 61.8% of XA. Following this is the extreme projection of the BC segment (2.618-3.14-3.618), which can determine the effective area for completing this pattern and the potential reversal of the current trend.
The bearish crab pattern tracks the price movement from point X to point A, followed by a gentle rise, a slight drop, and then a rapid increase to point D.
5️⃣ Deep Sea Crab Pattern
This is slightly different from the crab pattern outlined above. The only difference is the B point retracement, which must be 0.886 of the XA wave and not exceed point X.
The projection range of the BC segment may be from 2.24 to 3.618.
6️⃣ Gartley Pattern
The Gartley pattern created by HM Gartley has two main rules:
The B point retracement must be 0.618 of XA
The D point retracement must be 0.786 of the XA wave
The Gartley pattern shares similarities with the bat pattern in that the XA segment leads to a BC retracement, but the B point retracement must exactly be 0.618 of XA. The stop-loss point is often set at point X, while the take-profit point is typically set at point C.
7️⃣ Shark Pattern
The shark pattern was also discovered by Scott Carney and has some similarities with the crab pattern. The shark pattern is a reversal pattern consisting of five waves, marked as points O, X, A, B, and X.
The shark pattern must satisfy the following three Fibonacci rules:
The AB segment should show a retracement of 1.13 to 1.618 of the XA segment
The BC segment will be 113% of the OX segment
The target for the CD segment is the 50% Fibonacci retracement of the BC segment
All shark pattern trades are based on point C, and point D serves as a predetermined take-profit point.
8️⃣ Three Drives Pattern.
Three drive setups or patterns are rare because they require symmetry in both price and time. This pattern consists of a series of drivers and retracement lines. A total of 5 points make up the three-drive formation. Three points (1, 2, 3) represent the endpoints of the three drivers moving with the trend. Two points (A, C) mark the endpoints of the two retracements occurring between the drivers. The idea behind the three-drive setup is that when the third driver (moving with the current trend) ends, the price will reverse in the opposite direction. Of course, this pattern can be bullish or bearish. The example below outlines the parameters for a bullish setup. The bearish setup is simply the reversal of these conditions.
Bullish Three Drives Pattern:
Always remember that symmetry in price and time is crucial for the formation of this pattern.
Drivers 2 and 3 should be specific extensions of A and C retracements. The extensions should be 127.2% or 161.8%.
A and C retracements are generally 61.8% or 78.6% of previous fluctuations. Possible exceptions are in strongly trending markets. If the market trend is strong, these retracements may only be 38.2% or 50%.
The time (horizontal distance) of A and C retracements should be as close to symmetry as possible. The same applies to extensions (the second and third drivers are at the bottom).
It is important to remember that this particular pattern is rare. This means traders should not try to impose patterns onto the chart. If the formation contains price gaps or is not symmetrical enough (it can be slightly varied), it is better to abandon the formation and move on.
Common Questions:
How to identify and draw harmonic patterns?
The way to identify and draw harmonic patterns depends on the type of market movement (bearish or bullish). Therefore, while there are many different harmonic patterns, they can generally be divided into two categories: bearish patterns and bullish patterns.
Comparison of Bearish and Bullish Harmonic Patterns: What's the difference?
Bullish traders believe the market is about to experience a price increase, while bearish traders believe the market is on a downward trajectory. The same rules apply when understanding bearish and bullish harmonic patterns.
If a series of harmonic patterns indicate that the market is rising, bullish traders can use this perspective to establish long positions in their chosen market to profit from upward trends.
If traders perceive a bearish harmonic pattern, they may want to start shorting the market, based on the assumption that the price will decline.
How to start using harmonic patterns for trading
If you want to start using harmonic patterns for trading, please follow these steps:
(1) Spend some time learning the theory behind harmonic patterns
(2) Determine whether to follow a bearish strategy or a bullish strategy
(3) Open a trading account here and then start looking for harmonic patterns in your chosen market
Summary of Harmonic Patterns
(1) Traders use harmonic patterns to help predict future market movements
(2) Traders can use bearish or bullish harmonic patterns
(3) Bearish harmonic patterns indicate the market may decline
The above content refers to the comparison in the image.
Let's encourage each other!