
500likes👍 100share this Post .if you want more knowledge then support me & motivate my self first i am share most informative knowledge & spot trading signal.📉
Must Follow me other wise you miss Real Helper ✅
GIVE 1 LIKE 👍 TAKE ALOT OF LOVE♥️ HONEST KNOWLEDGE 🏆
THANKYOU & Love 💕 YOU
(NOW READ ARTICLE )👇
An oscillator indicator is a technical analysis tool used in financial markets to analyze price momentum and identify potential turning points in the market. It is based on the principle that market prices tend to move in waves or cycles rather than in a straight line.
Oscillator indicators typically fluctuate within a defined range or band, oscillating above and below a centerline or zero line. They use mathematical formulas to calculate the relationship between the current price and its historical prices, generating values that reflect the momentum or speed of price movements.
Common examples of oscillator indicators include the Relative Strength Index (RSI), Stochastic Oscillator, Moving Average Convergence Divergence (MACD), and the Commodity Channel Index (CCI). These indicators provide traders and investors with signals of overbought or oversold conditions in the market, which can help identify potential buy or sell opportunities.
Oscillator indicators are often displayed in a separate chart below the price chart, allowing traders to visually assess the momentum and potential reversals in the market. By monitoring the oscillator's movements and its interaction with certain levels or signals, traders can make more informed decisions about entering or exiting positions.
It's important to note that while oscillator indicators can be useful tools in technical analysis, they are not foolproof and should be used in conjunction with other indicators and analysis techniques to make well-rounded trading decisions.
how its work?
Oscillator indicators work by applying mathematical formulas to price data in order to generate a numerical value that oscillates within a specified range. This value represents the momentum or speed of price movements and can be used to identify potential overbought or oversold conditions in the market.
Here's a general overview of how oscillator indicators work:
Calculation: The specific formula used by each oscillator indicator varies, but they generally involve comparing the current price to previous prices over a specified period. For example, the RSI compares the average of upward price movements to the average of downward price movements over a given lookback period.
Scaling: After the calculation, the resulting value is scaled or normalized to fit within a predefined range. This range is often displayed as an oscillator that oscillates between two extreme values, such as 0 and 100 or -100 and +100.
Centerline and thresholds: Oscillator indicators often have a centerline, such as the 50 level, which represents a neutral position. Values above the centerline indicate bullish or overbought conditions, while values below the centerline indicate bearish or oversold conditions. In addition, specific threshold levels are often used to signal potential entry or exit points. For example, an RSI value above 70 might be considered overbought, while a value below 30 might be considered oversold.
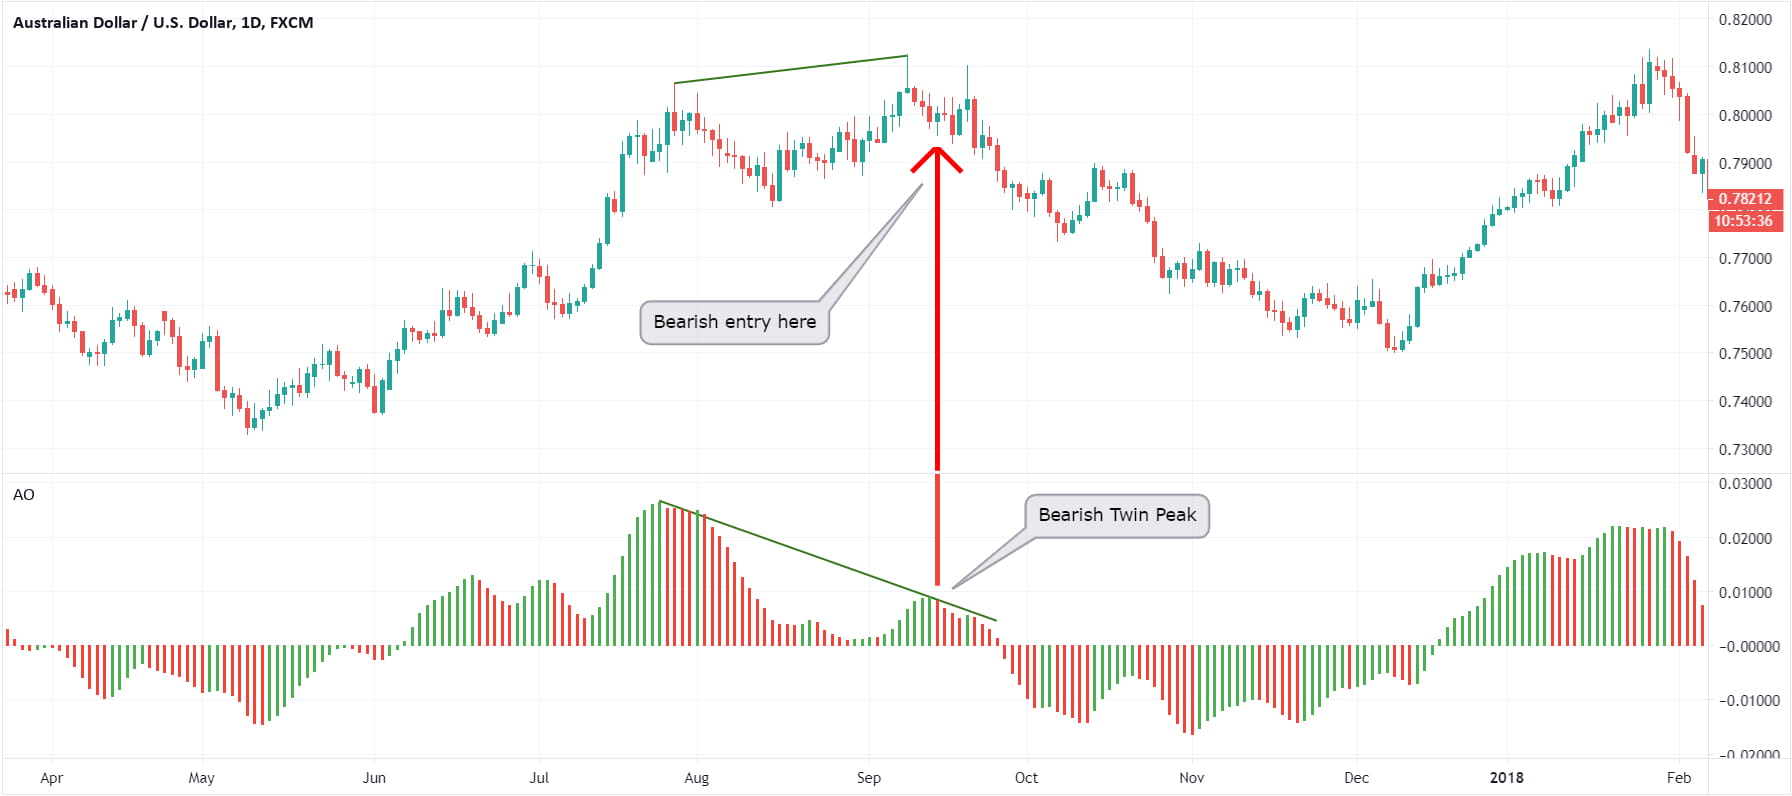
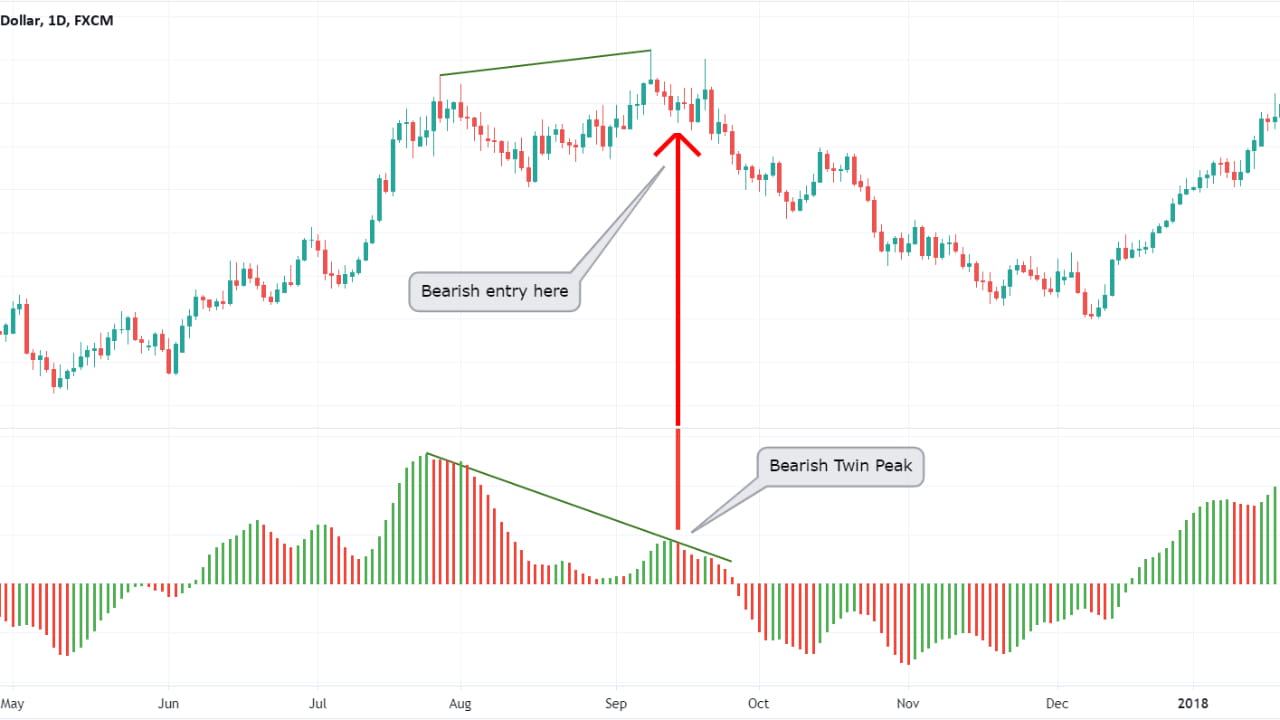
Divergence and convergence: Oscillator indicators can also be used to identify divergences or convergences between the indicator and the price. For example, if the price is making higher highs while the oscillator is making lower highs, it could be a bearish divergence, suggesting a potential reversal in the market.
Interpretation: Traders and investors analyze the movements and patterns of the oscillator indicator to generate trading signals. For example, if the indicator crosses above the centerline or a specific threshold level, it might be considered a buy signal. Conversely, if it crosses below the centerline or a threshold level, it might be considered a sell signal.
It's important to note that different oscillator indicators have different strengths and weaknesses, and their interpretation may vary depending on market conditions and the specific trading strategy being employed. Therefore, it's recommended to combine oscillator indicators with other technical analysis tools and consider multiple factors before making trading decisions.
#dyor #btc #bitcoin #cryptopredictor #oscillator