Crypto trading can be an exciting and lucrative activity, but it can also be overwhelming, especially for beginners. One of the most challenging aspects of crypto trading is identifying the right time to buy or sell a cryptocurrency. Fortunately, there are several indicators that traders can use to make informed decisions about the market. In this article, we will discuss some of the most common and straightforward crypto indicators, including MACD, RSI, Moving averages, and Bollinger bands.
Moving Averages
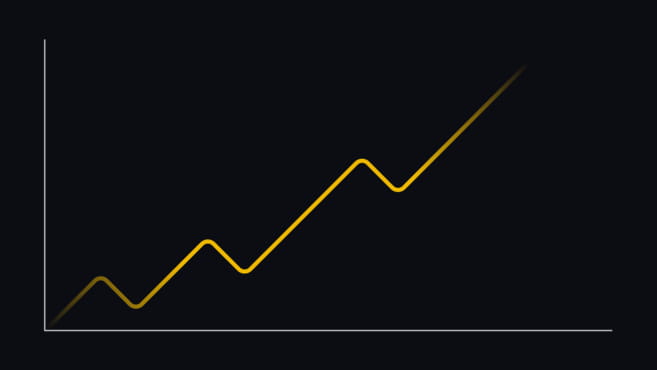
Moving averages are a fundamental tool for technical analysis, and they are also commonly used in crypto trading. A moving average is a simple indicator that calculates the average price of an asset over a specific period. The most common moving averages used in crypto trading are the 20-day moving average (20MA), 50-day moving average (50MA), and 200-day moving average (200MA). Traders use moving averages to identify trends in the market and determine support and resistance levels. A crossover of the short-term moving average (e.g., 20MA) above the long-term moving average (e.g., 50MA) is considered a bullish signal, while a crossover below is considered bearish.
Relative Strength Index (RSI)
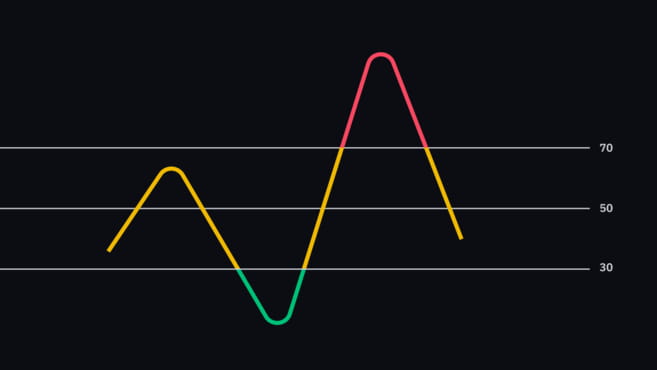
The Relative Strength Index (RSI) is a momentum indicator used to determine whether an asset is overbought or oversold based on recent price movements. It does this by measuring the magnitude of these movements over the last 14 periods and presenting the data as an oscillator ranging from 0 to 100.
RSI’s main purpose is to show the speed of price change, indicating whether momentum is increasing or decreasing. If the price is rising and momentum is increasing, this suggests a strong upward trend and more buyers entering the market. Conversely, if the price is rising but momentum is decreasing, it may indicate that sellers could soon take control.
Typically, RSI values above 70 are considered overbought, while values below 30 are considered oversold. However, these extreme values may not necessarily provide clear buy or sell signals. Instead, they may suggest an upcoming trend reversal or pullback. As with any technical analysis technique, RSI can give false signals, so traders should consider other factors before making trading decisions.
Moving Average Convergence Divergence (MACD)
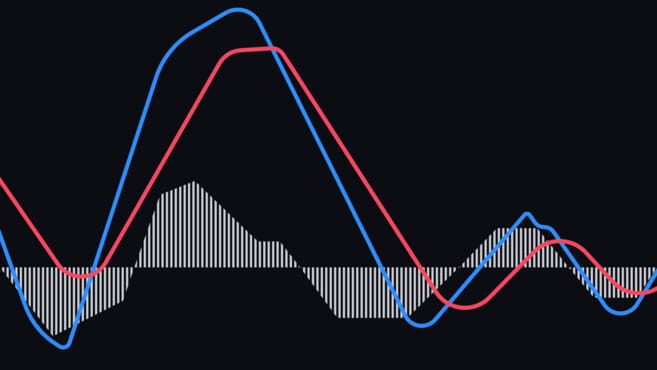
The Moving Average Convergence Divergence (MACD) is a popular and widely used crypto indicator that measures the momentum of price movements. The MACD is calculated by subtracting the 26-period exponential moving average (EMA) from the 12-period EMA. The result is plotted as a line on the chart, with a nine-day EMA (the signal line) plotted on top of it. Traders use the MACD to identify potential buy and sell signals. A crossover of the MACD line above the signal line is considered bullish, while a crossover below is considered bearish.
Bollinger Bands
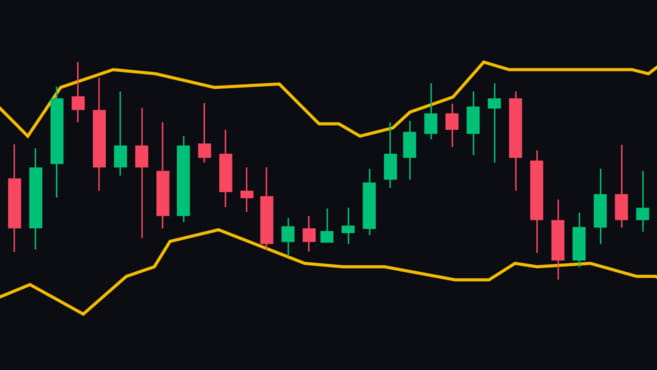
Bollinger Bands , another popular crypto indicator that measures the volatility of a cryptocurrency’s price movement. The indicator consists of three lines: a simple moving average (SMA) in the middle, and two standard deviation bands (one above and one below the SMA). Traders use Bollinger Bands to identify potential buy or sell signals. When the price of a cryptocurrency moves towards the upper Bollinger Band, it may be a sign that the market is overbought and due for a correction. Conversely, when the price moves towards the lower Bollinger Band, it may be a sign that the market is oversold and due for a rebound.
Conclusion
These are some of the most common and straightforward crypto indicators that traders can use to make informed decisions about the market. While these indicators can be helpful, it’s important to remember that no indicator is foolproof, and traders should always conduct their research and analysis before making any trading decisions. By using a combination of indicators, traders can gain a more comprehensive view of the market and increase their chances of making profitable trades.