

#XRP is down 19% from its October 4 high.
It also reached its key support around $0.50.
There are two possibilities ahead of us, but the probability of a bearish scenario is higher.
The price of XRP has had a remarkable journey since September 11, when it reached a low of $ 0.47, and then marked a recovery of 19%. It rose to $ 0.54 on October 4, but soon fell sharply and is currently down to $ 0.487.
The intriguing question is whether the price has started a broader uptrend since September 11 and whether the current decline probably represents a corrective phase. Will we witness a resurgence that pushes Xrp beyond $0.55 and into uncharted territory, or is this descent indicative of a longer downward trend?
Price Analysis
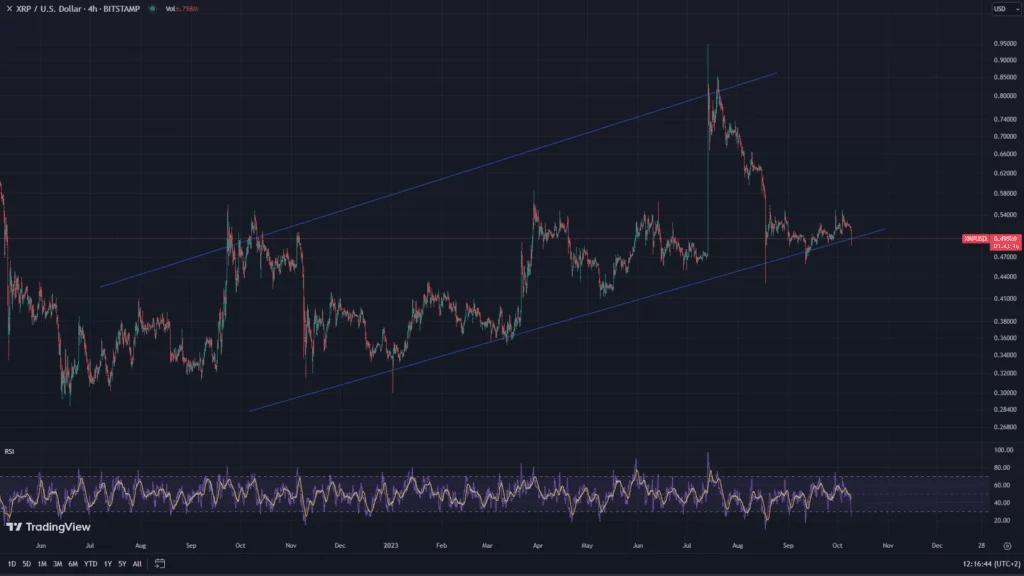
XRP reached its annual peak of $0.95 on July 13, after a significant rise from $0.468 the same day. Before that, it had risen steadily since June 18, 2022, when it hit a bottom at $0.28. An examination of the 4-Hour chart reveals that the price is currently moving in a rising channel, the support level has attracted significant attention and is serving as the current focal point.
The RSI is signaling oversold conditions and is recording at the 27% level today. However, it is worth noting that we observed even lower RSI values on September 11 and August 17 without significant price fluctuations. Given the significant decline from the peak in July and its current position on rising support, the question arises: is a rebound in the attack more likely now?
Zooming in on the hourly chart and deepening the wave structure further, it turns out that since September 11, the price has probably undergone a corrective increase, following an ABC pattern. Moreover, the decline that began on October 4 seems to exhibit an impulsive nature, with the decline accelerating since October 7.
4 To Predict a Downward Movement. Wave
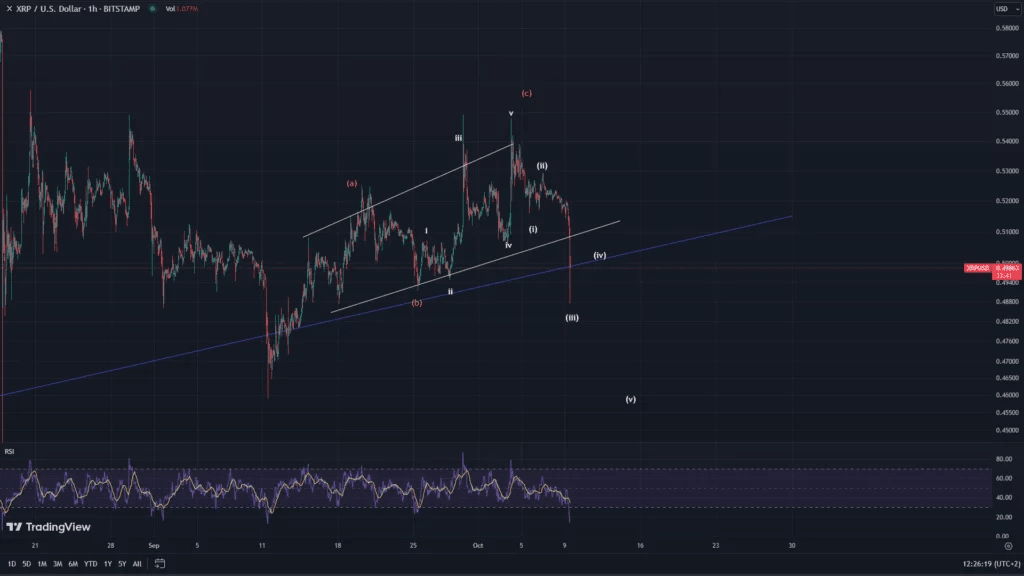
If this indeed happens to be another five-wave movement in the downward direction, it makes sense that we should witness the completion or completion of wave 3. Later, we would expect wave 4 to enter a consolidation phase before starting another downward movement. Ultimately, 5. a wave is expected to appear, which may lower the price even further from the levels observed on September 11 or revisit the low of about $ 0.46.
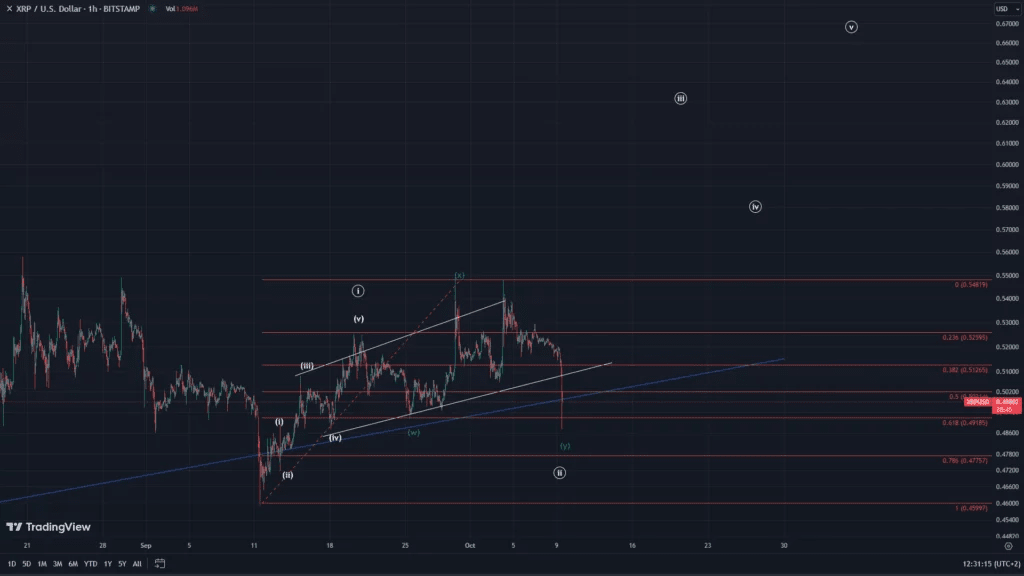
On the other hand, by studying the period from September 11 to September 20, we can distinguish the first five choppy upward impulses, followed by the subsequent price movement, which creates a less corrective GXY pattern. This correction could create a higher level of support and potentially pave the way for a significant upward trend in the near future.
In this bullish scenario, it is imperative that the price maintains the levels above the critical 0.618 Fibonacci level at $0.50 and shows positive indicators just above the rising support level. According to this perspective, wave 3 is expected to start shortly, aiming for a higher level, potentially targeting $0.62, and possibly expanding further if this emerges as a five-wave pattern.
Result
XRP is struggling to maintain the bullish momentum it has gained since September 11 and is currently basing itself on a significant rising support level once again. At this point, two potential scenarios stand in front of us, with the bearish outlook currently having greater possibilities.
However, the most important determinant for future price expectations depends on developments around the current price levels, which are about $ 0.50. If this level proves to be resilient and leads to a resurgence in the price, it could potentially pave the way for a sustained upward trend past the $0.55 mark.
Conversely, if the price continues its descent, it probably indicates that the rise from September 11 is corrective in nature, and the downward trajectory initiated on July 14 continues, potentially leading to even lower lows.