ပို့စ်

--

DP-NFT
·
--
$DOT $BTC $ETH
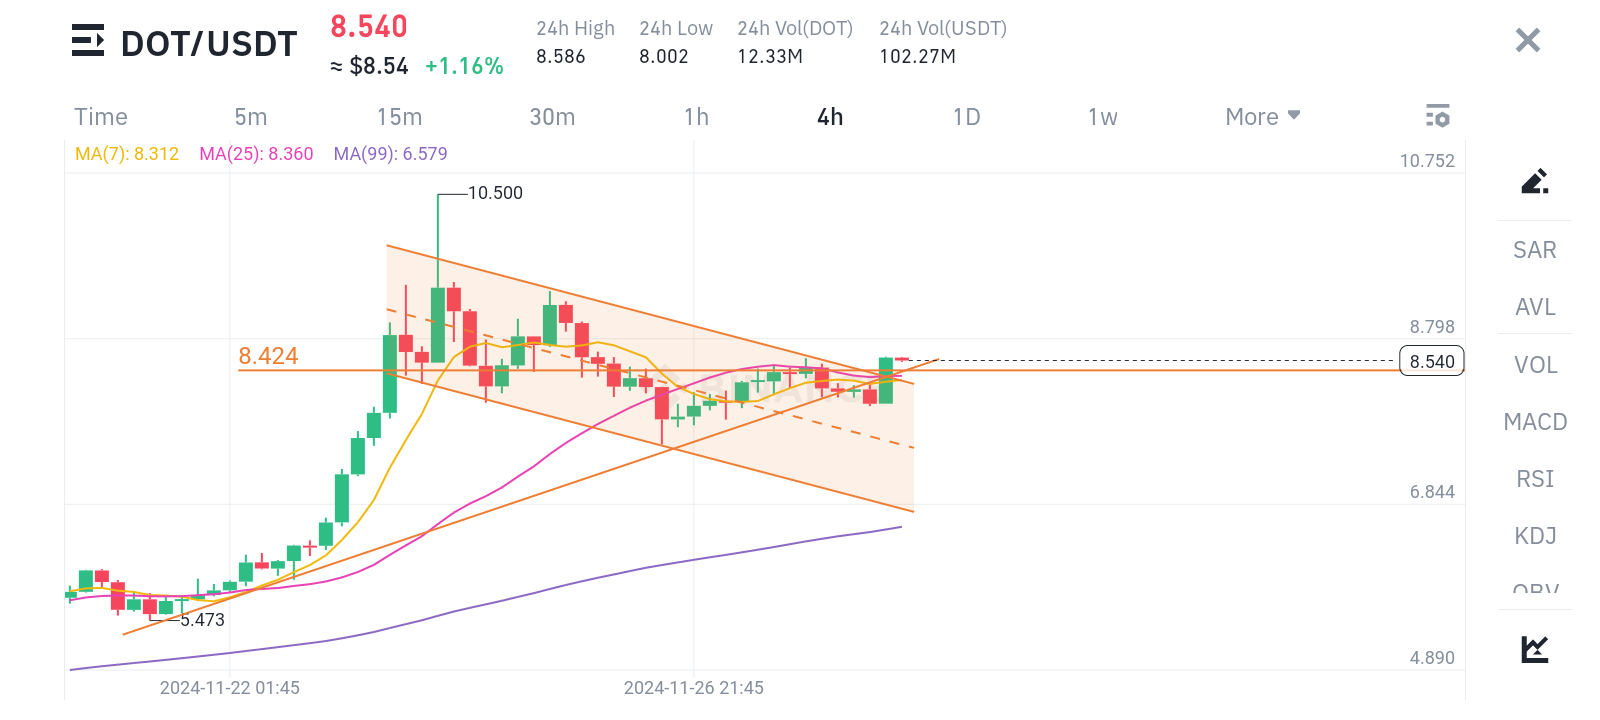
In This Chart shows a 4-hour candlestick chart for the DOT/USDT trading pair. Here's a breakdown of the chart details:
1. **Price Action**:
- The current price is **$8.54**, showing an increase of **+1.16%**.
- The 24-hour high is **$8.586**, and the 24-hour low is **$8.002**.
2. **Indicators**:
- The chart displays three moving averages:
- MA(7) in yellow, indicating the short-term trend at **$8.312**.
- MA(25) in pink, representing the medium-term trend at **$8.360**.
- MA(99) in purple, showing the long-term trend at **$6.579**.
3. **Support and Resistance**:
- A significant horizontal support level is marked at **$8.424**.
- Resistance could be observed near the descending orange trendline.
4. **Trend and Patterns**:
- The chart illustrates a descending wedge pattern (highlighted in orange), which often indicates a potential bullish breakout.
- The price has recently broken out of the wedge, which might suggest upward momentum.
5. **Volume**:
- The 24-hour volume is **12.33M DOT**, equivalent to **102.27M USDT**.
The chart suggests a technical breakout from a downward pattern, with the price currently trading above key support levels and short-term moving averages.