

#tradingeducation
tradingeducation
156,272 views
1,225 Discussing
ရေပန်းစားသော
နောက်ဆုံး

A stop-loss is a trigger, not a guaranteed exit price.
In fast crypto markets, the gap between your planned loss and actual loss can be wider than expected:
• Stop-market: prioritizes execution, but may fill well below your trigger on a long position.
• Stop-limit: controls your acceptable price, but can remain unfilled as the market falls.
• Thin order books: even a modest order can move through several price levels.
Before entering an altcoin trade, check the spread and order-book depth near your intended size—not just 24-hour volume. Visible liquidity can disappear under stress.
Then stress-test your position: if the exit slips another 2%, is the loss still manageable? Account for fees, too.
The useful question is not just “Where is my stop?” It is “What happens if my exit is worse than planned?”
#Crypto #RiskManagement #TradingEducation #Altcoins
A stop-loss is a trigger, not a guaranteed exit price.
In fast crypto markets, the gap between your planned loss and actual loss can be wider than expected:
• Stop-market: prioritizes execution, but may fill well below your trigger on a long position.
• Stop-limit: controls your acceptable price, but can remain unfilled as the market falls.
• Thin order books: even a modest order can move through several price levels.
Before entering an altcoin trade, check the spread and order-book depth near your intended size—not just 24-hour volume. Visible liquidity can disappear under stress.
Then stress-test your position: if the exit slips another 2%, is the loss still manageable? Account for fees, too.
The useful question is not just “Where is my stop?” It is “What happens if my exit is worse than planned?”
#Crypto #RiskManagement #TradingEducation #Altcoins
In fast crypto markets, the gap between your planned loss and actual loss can be wider than expected:
• Stop-market: prioritizes execution, but may fill well below your trigger on a long position.
• Stop-limit: controls your acceptable price, but can remain unfilled as the market falls.
• Thin order books: even a modest order can move through several price levels.
Before entering an altcoin trade, check the spread and order-book depth near your intended size—not just 24-hour volume. Visible liquidity can disappear under stress.
Then stress-test your position: if the exit slips another 2%, is the loss still manageable? Account for fees, too.
The useful question is not just “Where is my stop?” It is “What happens if my exit is worse than planned?”
#Crypto #RiskManagement #TradingEducation #Altcoins
56

$SHELL | Why the Same RSI Can Show Two Different Numbers
Đây là điều khiến nhiều người mới bối rối: RSI(6) của SHELL đọc 40.16 trên khung ngày, nhưng 64.07 trên khung 1 giờ. Cùng một tài sản, cùng một chỉ báo, hai con số khác hẳn nhau. Dữ liệu sai à? Không.
RSI không phải một con số duy nhất cho một tài sản. Nó được tính riêng cho mỗi khung thời gian bạn chọn, chỉ dùng những cây nến của khung đó. RSI khung ngày nhìn 6 cây nến ngày gần nhất; RSI khung 1 giờ nhìn 6 cây nến giờ gần nhất. Chúng đang trả lời hai câu hỏi khác nhau: SHELL đã di chuyển thế nào trong 6 ngày qua, so với 6 giờ qua.
Đó là lý do chỉ xem một khung thời gian rồi coi đó là "RSI" của cả tài sản sẽ bỏ lỡ một phần bức tranh.
#SHELL #TradingEducation #ChartAnalysis
$SHELL | Why the Same RSI Can Show Two Different Numbers
Đây là điều khiến nhiều người mới bối rối: RSI(6) của SHELL đọc 40.16 trên khung ngày, nhưng 64.07 trên khung 1 giờ. Cùng một tài sản, cùng một chỉ báo, hai con số khác hẳn nhau. Dữ liệu sai à? Không.
RSI không phải một con số duy nhất cho một tài sản. Nó được tính riêng cho mỗi khung thời gian bạn chọn, chỉ dùng những cây nến của khung đó. RSI khung ngày nhìn 6 cây nến ngày gần nhất; RSI khung 1 giờ nhìn 6 cây nến giờ gần nhất. Chúng đang trả lời hai câu hỏi khác nhau: SHELL đã di chuyển thế nào trong 6 ngày qua, so với 6 giờ qua.
Đó là lý do chỉ xem một khung thời gian rồi coi đó là "RSI" của cả tài sản sẽ bỏ lỡ một phần bức tranh.
#SHELL #TradingEducation #ChartAnalysis
Đây là điều khiến nhiều người mới bối rối: RSI(6) của SHELL đọc 40.16 trên khung ngày, nhưng 64.07 trên khung 1 giờ. Cùng một tài sản, cùng một chỉ báo, hai con số khác hẳn nhau. Dữ liệu sai à? Không.
RSI không phải một con số duy nhất cho một tài sản. Nó được tính riêng cho mỗi khung thời gian bạn chọn, chỉ dùng những cây nến của khung đó. RSI khung ngày nhìn 6 cây nến ngày gần nhất; RSI khung 1 giờ nhìn 6 cây nến giờ gần nhất. Chúng đang trả lời hai câu hỏi khác nhau: SHELL đã di chuyển thế nào trong 6 ngày qua, so với 6 giờ qua.
Đó là lý do chỉ xem một khung thời gian rồi coi đó là "RSI" của cả tài sản sẽ bỏ lỡ một phần bức tranh.
#SHELL #TradingEducation #ChartAnalysis
2

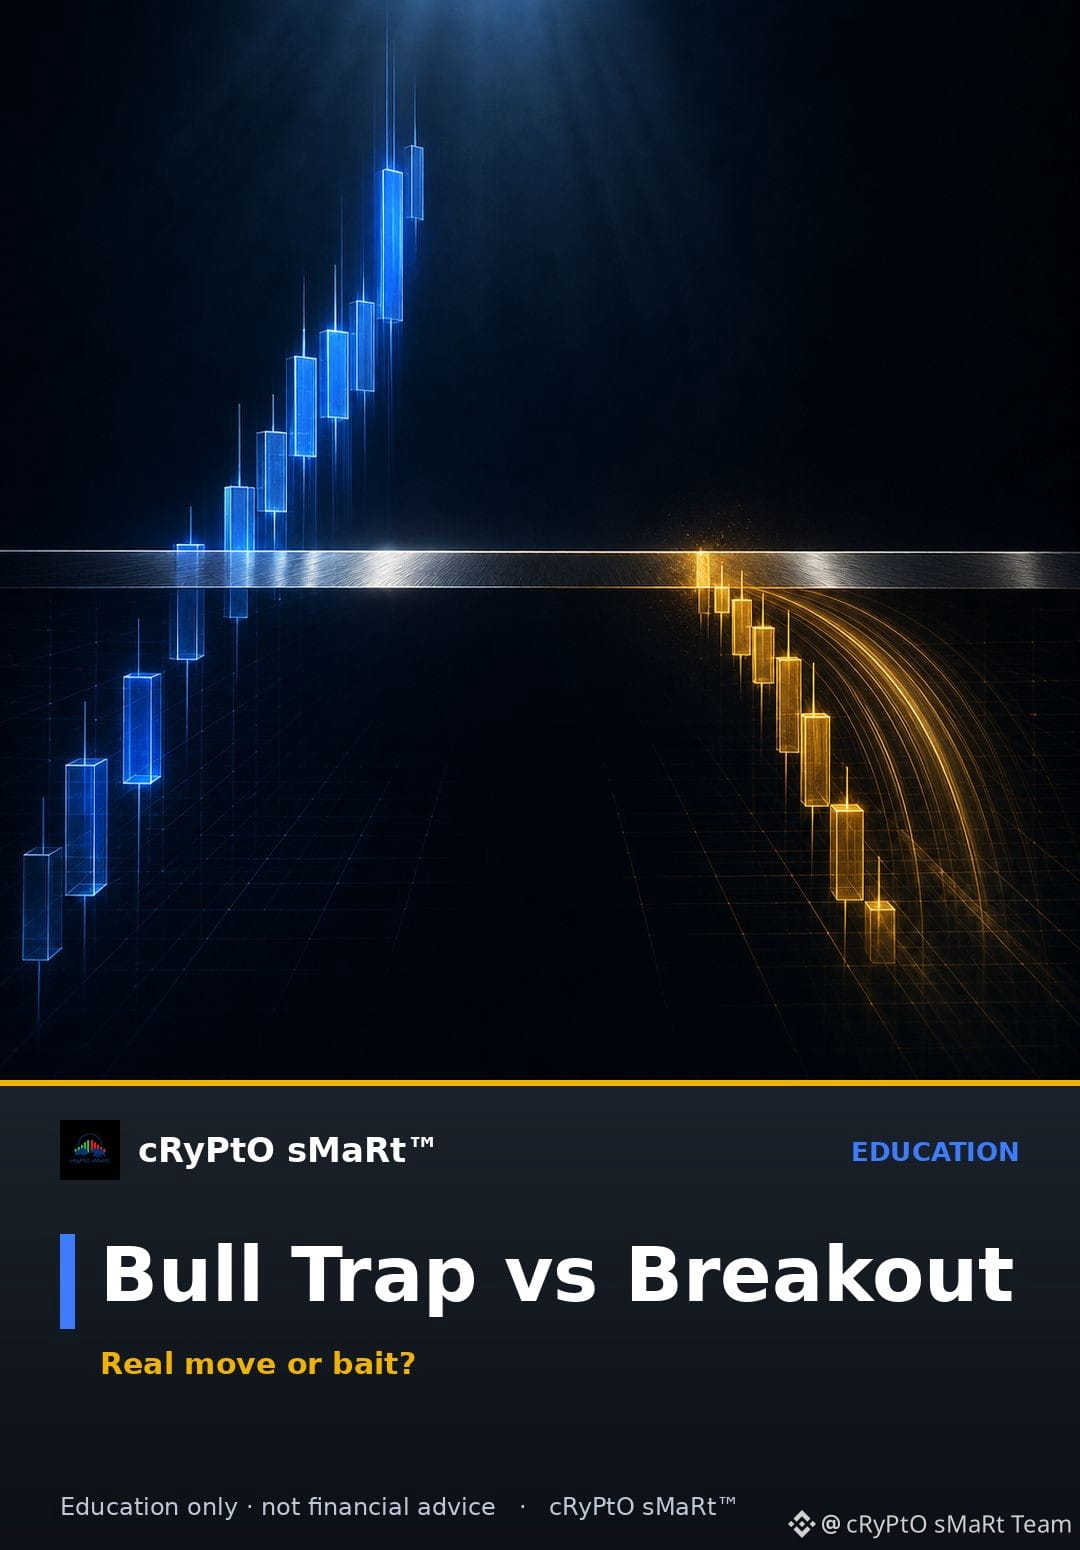
Here's the mistake that drains most beginner accounts: buying the second price pokes above resistance, assuming "breakout" automatically means "go."
A genuine breakout and a bull trap look identical in the first few candles. The difference shows up in what happens after. Real breakouts hold the level on a retest, volume stays elevated, and price builds structure above the old resistance instead of stalling. A bull trap spikes through on thin volume, fails to hold, and slices back below the level fast, trapping everyone who chased the move.
Watch the retest, not the breakout candle. That's where the truth comes out.
What's your rule for confirming a breakout before acting on it?
$BNB $SOL $XRP #Trading #TradingEducation #Crypto #TA
Follow for daily trading education · Education only, not financial advice.
Here's the mistake that drains most beginner accounts: buying the second price pokes above resistance, assuming "breakout" automatically means "go."
A genuine breakout and a bull trap look identical in the first few candles. The difference shows up in what happens after. Real breakouts hold the level on a retest, volume stays elevated, and price builds structure above the old resistance instead of stalling. A bull trap spikes through on thin volume, fails to hold, and slices back below the level fast, trapping everyone who chased the move.
Watch the retest, not the breakout candle. That's where the truth comes out.
What's your rule for confirming a breakout before acting on it?
$BNB $SOL $XRP #Trading #TradingEducation #Crypto #TA
Follow for daily trading education · Education only, not financial advice.
A genuine breakout and a bull trap look identical in the first few candles. The difference shows up in what happens after. Real breakouts hold the level on a retest, volume stays elevated, and price builds structure above the old resistance instead of stalling. A bull trap spikes through on thin volume, fails to hold, and slices back below the level fast, trapping everyone who chased the move.
Watch the retest, not the breakout candle. That's where the truth comes out.
What's your rule for confirming a breakout before acting on it?
$BNB $SOL $XRP #Trading #TradingEducation #Crypto #TA
Follow for daily trading education · Education only, not financial advice.
129

·
--
Article
📊 LEARNING CHART PATTERNS ON THE CHARTA practical guide to recognizing, confirming, and understanding chart patterns.
Learning Chart Patterns on the Chart
If you have ever opened someone else's breakdown, you have probably seen flags, triangles, head and shoulders, and more.
A beginner may think experienced traders know some secret.
No.
They recognize repeating shapes and understand what those shapes can tell us about market behaviour.
In this guide, we'll break down five useful chart patterns, how to confirm them, and where beginners commonly get them wrong.
THEORY
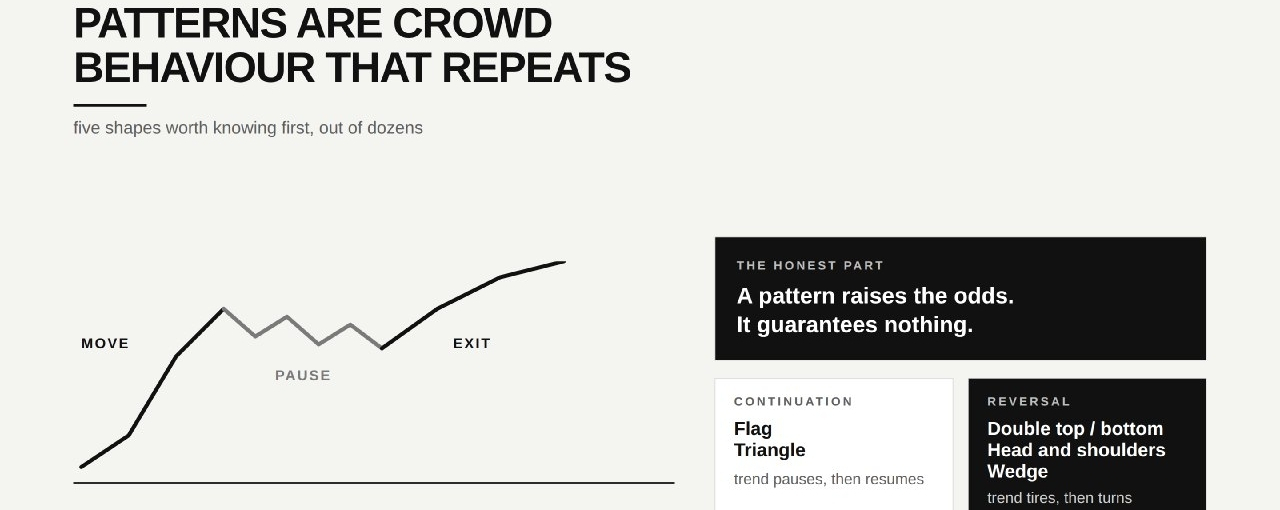
A pattern is a repeating form of crowd behaviour on the chart.
Most patterns can be understood through:
A MOVE → A PAUSE → A BREAKOUT
During the pause, buyers and sellers fight over price. The resulting shape can hint at which side is gaining strength.
A pattern raises the odds. It guarantees nothing.
The two main categories are:
Continuation Patterns
The current trend pauses and may continue.
Reversal Patterns
The existing trend loses momentum and may reverse.
THE FLAG
A flag starts with a sharp move known as the flagpole, followed by a short consolidation forming a small channel against the original trend.
After the pause, price may break out and continue in the original direction.
After a strong impulse, some traders take profits and price pulls back, but sellers may not have enough strength to reverse the market.
Volume inside the flag usually fades, while breakout volume can expand.
A bearish flag is the same structure in reverse: sharp drop → upward-sloping channel → potential continuation lower.
THE TRIANGLE
A triangle forms when price gets squeezed between two converging lines.
Ascending Triangle
Flat resistance + rising lows. Buyers repeatedly test the same level.
Descending Triangle
Flat support + falling highs. Sellers repeatedly pressure the same floor.
Symmetrical Triangle
Both trendlines converge, leaving the breakout direction to decide the next move.
Volume often decreases inside the triangle and increases when price breaks out.
DOUBLE TOP & DOUBLE BOTTOM
The idea is simple:
Two failed attempts to break the same level.
Double Top
Price reaches a high twice and fails both times. The dip between them creates the neckline.
A close below the neckline can confirm a bearish reversal.
Double Bottom
Price tests the same low twice and sellers fail to break it.
A close above the neckline can confirm a bullish reversal.
HEAD & SHOULDERS
The classic structure has three peaks:
LEFT SHOULDER → HEAD → RIGHT SHOULDER
The middle peak is the highest.
If buyers cannot push the right shoulder toward the head, bullish strength may be fading.
The neckline connects the lows beneath the structure.
A close below the neckline, preferably with increasing volume, strengthens the bearish confirmation.
The inverse Head and Shoulders can appear at market bottoms and signal a potential reversal upward.
THE WEDGE
A wedge forms when both trendlines slope in the same direction while gradually converging.
Rising Wedge
Price makes higher highs, but momentum weakens. It most often warns of a potential drop.
Falling Wedge
Price makes lower lows, but selling pressure fades. It most often signals a potential rally.
The interesting part is that a wedge can look like continuation while actually warning that the trend is becoming tired.
HOW TO CONFIRM A PATTERN
Until a pattern is confirmed, it's just a drawing on the chart.
Candle Close
A wick beyond the level isn't enough. Look for the candle body to close beyond the pattern line.
Volume
A breakout with stronger participation is generally more convincing. Weak-volume breakouts can reverse.
Retest
After breaking out, price may return to test the broken level from the other side.
Resistance → Breakout → Retest → Support
If the level holds, confirmation becomes stronger.
WHERE BEGINNERS MESS UP
False Breakouts
Crypto can push through a pattern line with a wick, trigger traders, and immediately reverse. Don't enter on the first poke.
Patterns Everywhere
Once you learn patterns, every chart can start looking like one. 😂
If you have to hunt for the formation, it probably isn't clear enough.
Lower Timeframe vs Higher Timeframe
A bullish hourly flag inside a strong daily downtrend may simply be a temporary move against the bigger trend.
Always check:
Higher timeframe → Market direction → Lower timeframe setup
WHAT TO STUDY NEXT
These five patterns are only the starting point.
Other formations include:
Pennants
Rectangles
Cup and HandleTriple Tops
Triple Bottoms
Broadening Formations
Recommended Study
📚 Thomas Bulkowski — Encyclopedia of Chart Patterns
A major reference with statistics on historical pattern performance.
📚 John Murphy — Technical Analysis of the Financial Markets
A classic technical-analysis resource covering chart patterns and market behaviour.
📚 Robert Edwards & John Magee — Technical Analysis of Stock Trends
A foundational work in traditional technical analysis, first published in 1948.
📚 BabyPips — School of Pipsology
A free, beginner-friendly resource for technical analysis.
FINAL THOUGHT
Theory without practice fades fast.
Study the pattern.
Find it on old charts.
Watch it form live.
Learn how it behaves.
Don't trade a pattern just because you can name it. Wait for confirmation.
And if you made it all the way here:
You're definitely not dumb. 😂📊
🔥 CHAINBALLER
Learn the chart. Understand the crowd. Wait for confirmation.
#ChainBaller #TradingEducation #ChartPatterns
$RLC $ZEC $SAND
📊 LEARNING CHART PATTERNS ON THE CHART
A practical guide to recognizing, confirming, and understanding chart patterns.
Learning Chart Patterns on the Chart
If you have ever opened someone else's breakdown, you have probably seen flags, triangles, head and shoulders, and more.
A beginner may think experienced traders know some secret.
No.
They recognize repeating shapes and understand what those shapes can tell us about market behaviour.
In this guide, we'll break down five useful chart patterns, how to confirm them, and where beginners commonly get them wrong.
THEORY
A pattern is a repeating form of crowd behaviour on the chart.
Most patterns can be understood through:
A MOVE → A PAUSE → A BREAKOUT
During the pause, buyers and sellers fight over price. The resulting shape can hint at which side is gaining strength.
A pattern raises the odds. It guarantees nothing.
The two main categories are:
Continuation Patterns
The current trend pauses and may continue.
Reversal Patterns
The existing trend loses momentum and may reverse.
THE FLAG
A flag starts with a sharp move known as the flagpole, followed by a short consolidation forming a small channel against the original trend.
After the pause, price may break out and continue in the original direction.
After a strong impulse, some traders take profits and price pulls back, but sellers may not have enough strength to reverse the market.
Volume inside the flag usually fades, while breakout volume can expand.
A bearish flag is the same structure in reverse: sharp drop → upward-sloping channel → potential continuation lower.
THE TRIANGLE
A triangle forms when price gets squeezed between two converging lines.
Ascending Triangle
Flat resistance + rising lows. Buyers repeatedly test the same level.
Descending Triangle
Flat support + falling highs. Sellers repeatedly pressure the same floor.
Symmetrical Triangle
Both trendlines converge, leaving the breakout direction to decide the next move.
Volume often decreases inside the triangle and increases when price breaks out.
DOUBLE TOP & DOUBLE BOTTOM
The idea is simple:
Two failed attempts to break the same level.
Double Top
Price reaches a high twice and fails both times. The dip between them creates the neckline.
A close below the neckline can confirm a bearish reversal.
Double Bottom
Price tests the same low twice and sellers fail to break it.
A close above the neckline can confirm a bullish reversal.
HEAD & SHOULDERS
The classic structure has three peaks:
LEFT SHOULDER → HEAD → RIGHT SHOULDER
The middle peak is the highest.
If buyers cannot push the right shoulder toward the head, bullish strength may be fading.
The neckline connects the lows beneath the structure.
A close below the neckline, preferably with increasing volume, strengthens the bearish confirmation.
The inverse Head and Shoulders can appear at market bottoms and signal a potential reversal upward.
THE WEDGE
A wedge forms when both trendlines slope in the same direction while gradually converging.
Rising Wedge
Price makes higher highs, but momentum weakens. It most often warns of a potential drop.
Falling Wedge
Price makes lower lows, but selling pressure fades. It most often signals a potential rally.
The interesting part is that a wedge can look like continuation while actually warning that the trend is becoming tired.
HOW TO CONFIRM A PATTERN
Until a pattern is confirmed, it's just a drawing on the chart.
Candle Close
A wick beyond the level isn't enough. Look for the candle body to close beyond the pattern line.
Volume
A breakout with stronger participation is generally more convincing. Weak-volume breakouts can reverse.
Retest
After breaking out, price may return to test the broken level from the other side.
Resistance → Breakout → Retest → Support
If the level holds, confirmation becomes stronger.
WHERE BEGINNERS MESS UP
False Breakouts
Crypto can push through a pattern line with a wick, trigger traders, and immediately reverse. Don't enter on the first poke.
Patterns Everywhere
Once you learn patterns, every chart can start looking like one. 😂
If you have to hunt for the formation, it probably isn't clear enough.
Lower Timeframe vs Higher Timeframe
A bullish hourly flag inside a strong daily downtrend may simply be a temporary move against the bigger trend.
Always check:
Higher timeframe → Market direction → Lower timeframe setup
WHAT TO STUDY NEXT
These five patterns are only the starting point.
Other formations include:
Pennants
Rectangles
Cup and HandleTriple Tops
Triple Bottoms
Broadening Formations
Recommended Study
📚 Thomas Bulkowski — Encyclopedia of Chart Patterns
A major reference with statistics on historical pattern performance.
📚 John Murphy — Technical Analysis of the Financial Markets
A classic technical-analysis resource covering chart patterns and market behaviour.
📚 Robert Edwards & John Magee — Technical Analysis of Stock Trends
A foundational work in traditional technical analysis, first published in 1948.
📚 BabyPips — School of Pipsology
A free, beginner-friendly resource for technical analysis.
FINAL THOUGHT
Theory without practice fades fast.
Study the pattern.
Find it on old charts.
Watch it form live.
Learn how it behaves.
Don't trade a pattern just because you can name it. Wait for confirmation.
And if you made it all the way here:
You're definitely not dumb. 😂📊
🔥 CHAINBALLER
Learn the chart. Understand the crowd. Wait for confirmation.
#ChainBaller #TradingEducation #ChartPatterns
$RLC $ZEC $SAND
Learning Chart Patterns on the Chart
If you have ever opened someone else's breakdown, you have probably seen flags, triangles, head and shoulders, and more.
A beginner may think experienced traders know some secret.
No.
They recognize repeating shapes and understand what those shapes can tell us about market behaviour.
In this guide, we'll break down five useful chart patterns, how to confirm them, and where beginners commonly get them wrong.
THEORY
A pattern is a repeating form of crowd behaviour on the chart.
Most patterns can be understood through:
A MOVE → A PAUSE → A BREAKOUT
During the pause, buyers and sellers fight over price. The resulting shape can hint at which side is gaining strength.
A pattern raises the odds. It guarantees nothing.
The two main categories are:
Continuation Patterns
The current trend pauses and may continue.
Reversal Patterns
The existing trend loses momentum and may reverse.
THE FLAG
A flag starts with a sharp move known as the flagpole, followed by a short consolidation forming a small channel against the original trend.
After the pause, price may break out and continue in the original direction.
After a strong impulse, some traders take profits and price pulls back, but sellers may not have enough strength to reverse the market.
Volume inside the flag usually fades, while breakout volume can expand.
A bearish flag is the same structure in reverse: sharp drop → upward-sloping channel → potential continuation lower.
THE TRIANGLE
A triangle forms when price gets squeezed between two converging lines.
Ascending Triangle
Flat resistance + rising lows. Buyers repeatedly test the same level.
Descending Triangle
Flat support + falling highs. Sellers repeatedly pressure the same floor.
Symmetrical Triangle
Both trendlines converge, leaving the breakout direction to decide the next move.
Volume often decreases inside the triangle and increases when price breaks out.
DOUBLE TOP & DOUBLE BOTTOM
The idea is simple:
Two failed attempts to break the same level.
Double Top
Price reaches a high twice and fails both times. The dip between them creates the neckline.
A close below the neckline can confirm a bearish reversal.
Double Bottom
Price tests the same low twice and sellers fail to break it.
A close above the neckline can confirm a bullish reversal.
HEAD & SHOULDERS
The classic structure has three peaks:
LEFT SHOULDER → HEAD → RIGHT SHOULDER
The middle peak is the highest.
If buyers cannot push the right shoulder toward the head, bullish strength may be fading.
The neckline connects the lows beneath the structure.
A close below the neckline, preferably with increasing volume, strengthens the bearish confirmation.
The inverse Head and Shoulders can appear at market bottoms and signal a potential reversal upward.
THE WEDGE
A wedge forms when both trendlines slope in the same direction while gradually converging.
Rising Wedge
Price makes higher highs, but momentum weakens. It most often warns of a potential drop.
Falling Wedge
Price makes lower lows, but selling pressure fades. It most often signals a potential rally.
The interesting part is that a wedge can look like continuation while actually warning that the trend is becoming tired.
HOW TO CONFIRM A PATTERN
Until a pattern is confirmed, it's just a drawing on the chart.
Candle Close
A wick beyond the level isn't enough. Look for the candle body to close beyond the pattern line.
Volume
A breakout with stronger participation is generally more convincing. Weak-volume breakouts can reverse.
Retest
After breaking out, price may return to test the broken level from the other side.
Resistance → Breakout → Retest → Support
If the level holds, confirmation becomes stronger.
WHERE BEGINNERS MESS UP
False Breakouts
Crypto can push through a pattern line with a wick, trigger traders, and immediately reverse. Don't enter on the first poke.
Patterns Everywhere
Once you learn patterns, every chart can start looking like one. 😂
If you have to hunt for the formation, it probably isn't clear enough.
Lower Timeframe vs Higher Timeframe
A bullish hourly flag inside a strong daily downtrend may simply be a temporary move against the bigger trend.
Always check:
Higher timeframe → Market direction → Lower timeframe setup
WHAT TO STUDY NEXT
These five patterns are only the starting point.
Other formations include:
Pennants
Rectangles
Cup and HandleTriple Tops
Triple Bottoms
Broadening Formations
Recommended Study
📚 Thomas Bulkowski — Encyclopedia of Chart Patterns
A major reference with statistics on historical pattern performance.
📚 John Murphy — Technical Analysis of the Financial Markets
A classic technical-analysis resource covering chart patterns and market behaviour.
📚 Robert Edwards & John Magee — Technical Analysis of Stock Trends
A foundational work in traditional technical analysis, first published in 1948.
📚 BabyPips — School of Pipsology
A free, beginner-friendly resource for technical analysis.
FINAL THOUGHT
Theory without practice fades fast.
Study the pattern.
Find it on old charts.
Watch it form live.
Learn how it behaves.
Don't trade a pattern just because you can name it. Wait for confirmation.
And if you made it all the way here:
You're definitely not dumb. 😂📊
🔥 CHAINBALLER
Learn the chart. Understand the crowd. Wait for confirmation.
#ChainBaller #TradingEducation #ChartPatterns
$RLC $ZEC $SAND
367

Most traders stare at price. Smart traders stare at volume. Here's why.
$BTC is up +1.1% at $86,208 right now. But the real story is the $1,127M in volume backing that move.
Volume is the fuel behind any price action. A breakout with rising volume means institutions are committing real capital—higher probability of follow-through. A breakout on declining volume? That's a trap waiting to happen.
Think of it like a car. Price is the speedometer. Volume is the gas tank. You can accelerate briefly on fumes, but you won't get far.
Right now, that $1,127M tells us buyers showed up with size. If price keeps climbing but volume starts shrinking over the next candles, that divergence is your early warning to manage risk tighter.
What's your go-to volume indicator—VWAP, OBV, or raw volume bars?
We post every algo signal's real result openly, and the full live track record plus a free preview channel are in our bio/profile.
#VolumeConfirmation #TradingEducation
Most traders stare at price. Smart traders stare at volume. Here's why.
$BTC is up +1.1% at $86,208 right now. But the real story is the $1,127M in volume backing that move.
Volume is the fuel behind any price action. A breakout with rising volume means institutions are committing real capital—higher probability of follow-through. A breakout on declining volume? That's a trap waiting to happen.
Think of it like a car. Price is the speedometer. Volume is the gas tank. You can accelerate briefly on fumes, but you won't get far.
Right now, that $1,127M tells us buyers showed up with size. If price keeps climbing but volume starts shrinking over the next candles, that divergence is your early warning to manage risk tighter.
What's your go-to volume indicator—VWAP, OBV, or raw volume bars?
We post every algo signal's real result openly, and the full live track record plus a free preview channel are in our bio/profile.
#VolumeConfirmation #TradingEducation
$BTC is up +1.1% at $86,208 right now. But the real story is the $1,127M in volume backing that move.
Volume is the fuel behind any price action. A breakout with rising volume means institutions are committing real capital—higher probability of follow-through. A breakout on declining volume? That's a trap waiting to happen.
Think of it like a car. Price is the speedometer. Volume is the gas tank. You can accelerate briefly on fumes, but you won't get far.
Right now, that $1,127M tells us buyers showed up with size. If price keeps climbing but volume starts shrinking over the next candles, that divergence is your early warning to manage risk tighter.
What's your go-to volume indicator—VWAP, OBV, or raw volume bars?
We post every algo signal's real result openly, and the full live track record plus a free preview channel are in our bio/profile.
#VolumeConfirmation #TradingEducation
35
Most blown accounts don't die from one bad trade. They die from one bad habit repeated fifty times.
Here's the pattern: a loss hits, discipline cracks, and the trader overtrades to "make it back," skips the stop "just this once," widens it "to give the trade room," then revenge-trades the next setup out of frustration, not logic. Each decision feels small. Stacked together, they're account killers.
The disciplined trader has one rule that never bends: the stop is set before the trade, and it moves in one direction only — never wider.
Watch for the moment you want to adjust a stop after entry. That urge is the tell.
Where has that urge cost you most — moving a stop, oversizing, or jumping back in too fast?
$DOGE $AVAX $LINK #Trading #TradingEducation #Crypto #TA
Follow for daily trading education · Education only, not financial advice.
Most blown accounts don't die from one bad trade. They die from one bad habit repeated fifty times.
Here's the pattern: a loss hits, discipline cracks, and the trader overtrades to "make it back," skips the stop "just this once," widens it "to give the trade room," then revenge-trades the next setup out of frustration, not logic. Each decision feels small. Stacked together, they're account killers.
The disciplined trader has one rule that never bends: the stop is set before the trade, and it moves in one direction only — never wider.
Watch for the moment you want to adjust a stop after entry. That urge is the tell.
Where has that urge cost you most — moving a stop, oversizing, or jumping back in too fast?
$DOGE $AVAX $LINK #Trading #TradingEducation #Crypto #TA
Follow for daily trading education · Education only, not financial advice.
Here's the pattern: a loss hits, discipline cracks, and the trader overtrades to "make it back," skips the stop "just this once," widens it "to give the trade room," then revenge-trades the next setup out of frustration, not logic. Each decision feels small. Stacked together, they're account killers.
The disciplined trader has one rule that never bends: the stop is set before the trade, and it moves in one direction only — never wider.
Watch for the moment you want to adjust a stop after entry. That urge is the tell.
Where has that urge cost you most — moving a stop, oversizing, or jumping back in too fast?
$DOGE $AVAX $LINK #Trading #TradingEducation #Crypto #TA
Follow for daily trading education · Education only, not financial advice.

202
Reading intraday structure and R-multiples
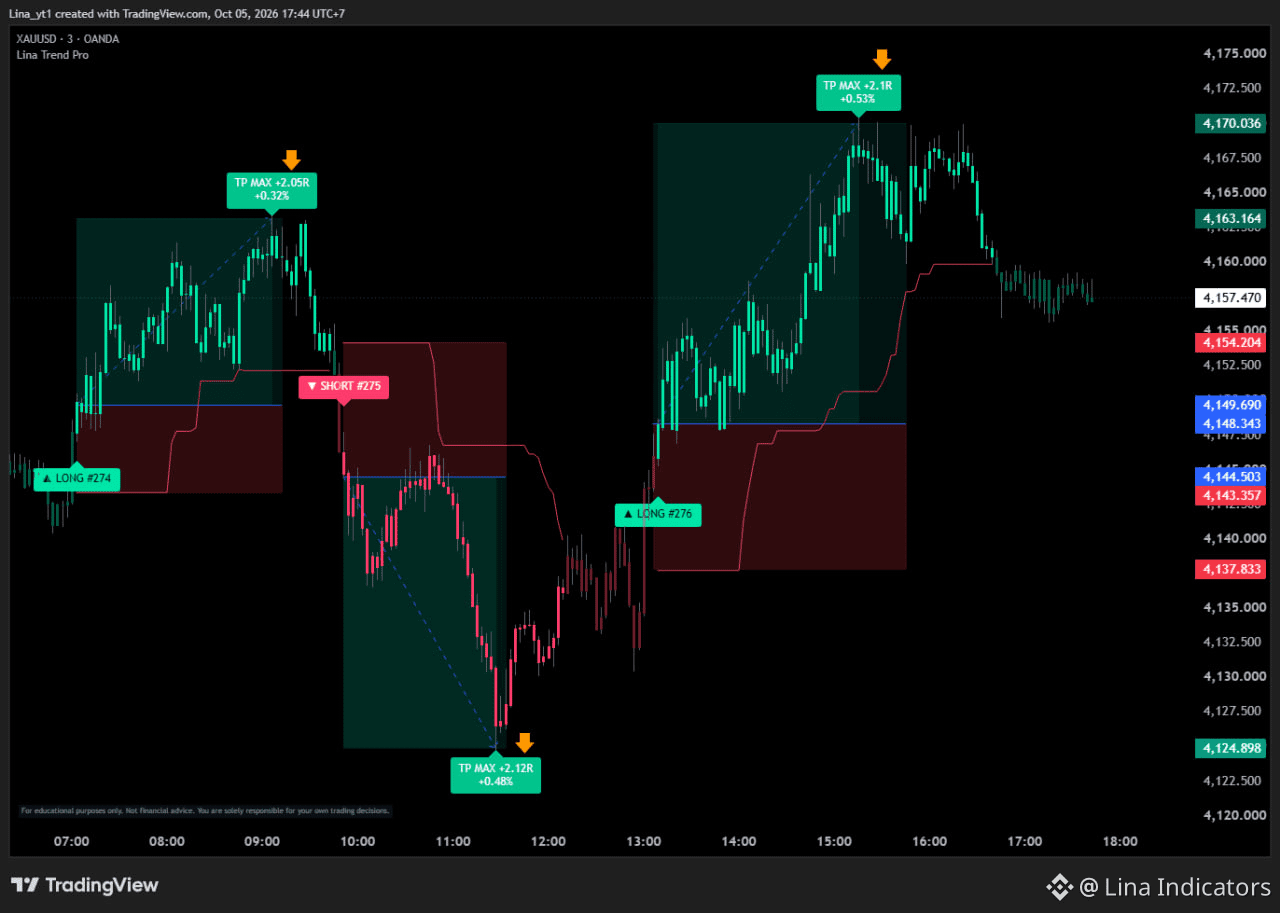
This XAUUSD 3-minute example shows an upward move, a downward move, then another upward move.
TP MAX labels on the chart: +2.05R, +2.12R and +2.10R.
For crypto traders reviewing BTC or altcoin charts, the same distinction matters: displayed R-multiples do not establish actual realized returns.
Educational chart commentary, not financial advice.
#tradingeducation
Reading intraday structure and R-multiples
This XAUUSD 3-minute example shows an upward move, a downward move, then another upward move.
TP MAX labels on the chart: +2.05R, +2.12R and +2.10R.
For crypto traders reviewing BTC or altcoin charts, the same distinction matters: displayed R-multiples do not establish actual realized returns.
Educational chart commentary, not financial advice.
#tradingeducation
This XAUUSD 3-minute example shows an upward move, a downward move, then another upward move.
TP MAX labels on the chart: +2.05R, +2.12R and +2.10R.
For crypto traders reviewing BTC or altcoin charts, the same distinction matters: displayed R-multiples do not establish actual realized returns.
Educational chart commentary, not financial advice.
#tradingeducation
1
169

🧠 Crypto Tip of the Day
Why Does the Price of Bitcoin Move So Much? 📈📉
Bitcoin’s price is mainly influenced by supply, demand, market sentiment, news, liquidity, and investor behavior.
🔹 When more people want to buy → Demand increases → Price may rise
🔹 When more people want to sell → Selling pressure increases → Price may fall
🔹 Big investors, often called “whales,” can sometimes cause significant short-term price movements.
🔹 Positive or negative news can quickly change market sentiment.
💡 Important: A price increase does not guarantee that it will continue going up. Always do your own research before investing.
What crypto topic should I explain next? 👇
A️⃣ What is Market Cap?
B️⃣ What is a Crypto Whale?
C️⃣ Spot vs Futures Trading
D️⃣ What is Bitcoin Halving?
#BinanceSquare #CryptoEducation #Bitcoin #Cryptocurrency #CryptoTips #LearnCryptoWithMe #BTC☀️ #TradingEducation
🧠 Crypto Tip of the Day
Why Does the Price of Bitcoin Move So Much? 📈📉
Bitcoin’s price is mainly influenced by supply, demand, market sentiment, news, liquidity, and investor behavior.
🔹 When more people want to buy → Demand increases → Price may rise
🔹 When more people want to sell → Selling pressure increases → Price may fall
🔹 Big investors, often called “whales,” can sometimes cause significant short-term price movements.
🔹 Positive or negative news can quickly change market sentiment.
💡 Important: A price increase does not guarantee that it will continue going up. Always do your own research before investing.
What crypto topic should I explain next? 👇
A️⃣ What is Market Cap?
B️⃣ What is a Crypto Whale?
C️⃣ Spot vs Futures Trading
D️⃣ What is Bitcoin Halving?
#BinanceSquare #CryptoEducation #Bitcoin #Cryptocurrency #CryptoTips #LearnCryptoWithMe #BTC☀️ #TradingEducation
Why Does the Price of Bitcoin Move So Much? 📈📉
Bitcoin’s price is mainly influenced by supply, demand, market sentiment, news, liquidity, and investor behavior.
🔹 When more people want to buy → Demand increases → Price may rise
🔹 When more people want to sell → Selling pressure increases → Price may fall
🔹 Big investors, often called “whales,” can sometimes cause significant short-term price movements.
🔹 Positive or negative news can quickly change market sentiment.
💡 Important: A price increase does not guarantee that it will continue going up. Always do your own research before investing.
What crypto topic should I explain next? 👇
A️⃣ What is Market Cap?
B️⃣ What is a Crypto Whale?
C️⃣ Spot vs Futures Trading
D️⃣ What is Bitcoin Halving?
#BinanceSquare #CryptoEducation #Bitcoin #Cryptocurrency #CryptoTips #LearnCryptoWithMe #BTC☀️ #TradingEducation

99

🧠 درس القرصان #01 | لماذا وقف الخسارة مهم؟
كثير من المتداولين يسألون:
❌ "كم أربح؟"
لكن السؤال الأهم هو:
✅ "كم أخسر إذا كنت مخطئًا؟"
🛑 وقف الخسارة يساعدك على: • تحديد المخاطرة مسبقًا
• حماية رأس المال
• تجنب القرارات العاطفية
• الاستمرار في السوق بعد الصفقات الخاسرة
💡 المتداول المحترف لا يبحث عن صفقة رابحة دائمًا… بل يدير الخسارة عندما يكون مخطئًا.
🏴☠️ رأس المال أولًا.
#TradingEducation #cryptouniverseofficial #BinanceSquareTalks
🧠 درس القرصان #01 | لماذا وقف الخسارة مهم؟
كثير من المتداولين يسألون:
❌ "كم أربح؟"
لكن السؤال الأهم هو:
✅ "كم أخسر إذا كنت مخطئًا؟"
🛑 وقف الخسارة يساعدك على: • تحديد المخاطرة مسبقًا
• حماية رأس المال
• تجنب القرارات العاطفية
• الاستمرار في السوق بعد الصفقات الخاسرة
💡 المتداول المحترف لا يبحث عن صفقة رابحة دائمًا… بل يدير الخسارة عندما يكون مخطئًا.
🏴☠️ رأس المال أولًا.
#TradingEducation #cryptouniverseofficial #BinanceSquareTalks
كثير من المتداولين يسألون:
❌ "كم أربح؟"
لكن السؤال الأهم هو:
✅ "كم أخسر إذا كنت مخطئًا؟"
🛑 وقف الخسارة يساعدك على: • تحديد المخاطرة مسبقًا
• حماية رأس المال
• تجنب القرارات العاطفية
• الاستمرار في السوق بعد الصفقات الخاسرة
💡 المتداول المحترف لا يبحث عن صفقة رابحة دائمًا… بل يدير الخسارة عندما يكون مخطئًا.
🏴☠️ رأس المال أولًا.
#TradingEducation #cryptouniverseofficial #BinanceSquareTalks
2
14
Why do most traders lose money trying to call the exact top or bottom, while the trend just keeps paying whoever rides it?
Catching reversals means you're betting against momentum, over and over, hoping you're the one who times it right. Trend following flips that: you accept you'll never nail the exact turn, so you wait for structure to confirm direction, then move with the crowd already pushing price. Fewer decisions, clearer invalidation, less emotional whiplash.
Watch how many times you've exited a trend early because you "felt" a reversal coming. Count it for a week.
What's the last trend you fought instead of followed?
$XRP $ADA $DOGE #Trading #TradingEducation #Crypto #TA
Follow for daily trading education · Education only, not financial advice.
Why do most traders lose money trying to call the exact top or bottom, while the trend just keeps paying whoever rides it?
Catching reversals means you're betting against momentum, over and over, hoping you're the one who times it right. Trend following flips that: you accept you'll never nail the exact turn, so you wait for structure to confirm direction, then move with the crowd already pushing price. Fewer decisions, clearer invalidation, less emotional whiplash.
Watch how many times you've exited a trend early because you "felt" a reversal coming. Count it for a week.
What's the last trend you fought instead of followed?
$XRP $ADA $DOGE #Trading #TradingEducation #Crypto #TA
Follow for daily trading education · Education only, not financial advice.
Catching reversals means you're betting against momentum, over and over, hoping you're the one who times it right. Trend following flips that: you accept you'll never nail the exact turn, so you wait for structure to confirm direction, then move with the crowd already pushing price. Fewer decisions, clearer invalidation, less emotional whiplash.
Watch how many times you've exited a trend early because you "felt" a reversal coming. Count it for a week.
What's the last trend you fought instead of followed?
$XRP $ADA $DOGE #Trading #TradingEducation #Crypto #TA
Follow for daily trading education · Education only, not financial advice.

182

·
--
📅 DAY 14/30 — THE ART OF TRADE ENTRY 🎯$BTC
A setup is only a possibility.
Confirmation is what turns it into a trade.
Before clicking BUY or SELL, ask yourself:
📌 1. Structure — Is the market direction clear?
📌 2. Level — Am I trading from a meaningful zone?
📌 3. Confirmation — Did price actually show a reaction?
📌 4. Risk — Where is my invalidation point?
📌 5. R:R — Is the potential reward worth the risk?
🧠 Smart traders don’t chase candles.
They wait for the market to confirm their idea.
No confirmation → No entry.
No proper risk → No trade.
Patience creates the setup.
Discipline executes it. 🖤📊
#TradingEducation #BinanceSquare #PriceAction #RiskManagement
📅 DAY 14/30 — THE ART OF TRADE ENTRY 🎯$BTC
A setup is only a possibility.
Confirmation is what turns it into a trade.
Before clicking BUY or SELL, ask yourself:
📌 1. Structure — Is the market direction clear?
📌 2. Level — Am I trading from a meaningful zone?
📌 3. Confirmation — Did price actually show a reaction?
📌 4. Risk — Where is my invalidation point?
📌 5. R:R — Is the potential reward worth the risk?
🧠 Smart traders don’t chase candles.
They wait for the market to confirm their idea.
No confirmation → No entry.
No proper risk → No trade.
Patience creates the setup.
Discipline executes it. 🖤📊
#TradingEducation #BinanceSquare #PriceAction #RiskManagement
A setup is only a possibility.
Confirmation is what turns it into a trade.
Before clicking BUY or SELL, ask yourself:
📌 1. Structure — Is the market direction clear?
📌 2. Level — Am I trading from a meaningful zone?
📌 3. Confirmation — Did price actually show a reaction?
📌 4. Risk — Where is my invalidation point?
📌 5. R:R — Is the potential reward worth the risk?
🧠 Smart traders don’t chase candles.
They wait for the market to confirm their idea.
No confirmation → No entry.
No proper risk → No trade.
Patience creates the setup.
Discipline executes it. 🖤📊
#TradingEducation #BinanceSquare #PriceAction #RiskManagement

78
Volume confirmation separates real moves from fakeouts. Here's the concept:
When price breaks a key level, you want volume EXPANDING — not shrinking. Low volume on a breakout = weak participation = high chance of failure. High volume = conviction.
Live example right now: $WLD is up +3.8% at $0.5418 with $64M in 24h volume. The question a trader asks isn't "is it green?" — it's "does this volume support continuation?"
Compare today's $64M to its average. If volume is rising alongside price, buyers are committing real capital. If price crawls up on fading volume, you're likely looking at a low-fuel bounce destined to roll over.
The framework:
✓ Price up + volume up = trend confirmation
✓ Price up + volume down = divergence warning
✓ Always check both before entering
This is why blind chart patterns fail — they ignore the fuel behind the move.
What's your go-to volume indicator — raw OBV, VWAP, or something else?
We post every algo signal's REAL result openly, and the full live track record plus a free preview channel are in our bio/profile.
#TradingEducation #VolumeAnalysis
Volume confirmation separates real moves from fakeouts. Here's the concept:
When price breaks a key level, you want volume EXPANDING — not shrinking. Low volume on a breakout = weak participation = high chance of failure. High volume = conviction.
Live example right now: $WLD is up +3.8% at $0.5418 with $64M in 24h volume. The question a trader asks isn't "is it green?" — it's "does this volume support continuation?"
Compare today's $64M to its average. If volume is rising alongside price, buyers are committing real capital. If price crawls up on fading volume, you're likely looking at a low-fuel bounce destined to roll over.
The framework:
✓ Price up + volume up = trend confirmation
✓ Price up + volume down = divergence warning
✓ Always check both before entering
This is why blind chart patterns fail — they ignore the fuel behind the move.
What's your go-to volume indicator — raw OBV, VWAP, or something else?
We post every algo signal's REAL result openly, and the full live track record plus a free preview channel are in our bio/profile.
#TradingEducation #VolumeAnalysis
When price breaks a key level, you want volume EXPANDING — not shrinking. Low volume on a breakout = weak participation = high chance of failure. High volume = conviction.
Live example right now: $WLD is up +3.8% at $0.5418 with $64M in 24h volume. The question a trader asks isn't "is it green?" — it's "does this volume support continuation?"
Compare today's $64M to its average. If volume is rising alongside price, buyers are committing real capital. If price crawls up on fading volume, you're likely looking at a low-fuel bounce destined to roll over.
The framework:
✓ Price up + volume up = trend confirmation
✓ Price up + volume down = divergence warning
✓ Always check both before entering
This is why blind chart patterns fail — they ignore the fuel behind the move.
What's your go-to volume indicator — raw OBV, VWAP, or something else?
We post every algo signal's REAL result openly, and the full live track record plus a free preview channel are in our bio/profile.
#TradingEducation #VolumeAnalysis
65

Chart Analysis
How to Read a Crypto Chart
You don't need dozens of indicators to start learning technical analysis.
Focus on the basics:
🕯️ Candlesticks — Understand price movement.
🟢 Support — An area where buying interest may appear.
🔴 Resistance — An area where selling pressure may appear.
📊 Volume — Helps understand the strength of a move.
📈 Trend — Identify whether the market is generally moving up, down, or sideways.
Learn the chart before trying to predict it.
#TechnicalAnalysis #CryptoTrading #charts #TradingEducation #BinanceSquare
Chart Analysis
How to Read a Crypto Chart
You don't need dozens of indicators to start learning technical analysis.
Focus on the basics:
🕯️ Candlesticks — Understand price movement.
🟢 Support — An area where buying interest may appear.
🔴 Resistance — An area where selling pressure may appear.
📊 Volume — Helps understand the strength of a move.
📈 Trend — Identify whether the market is generally moving up, down, or sideways.
Learn the chart before trying to predict it.
#TechnicalAnalysis #CryptoTrading #charts #TradingEducation #BinanceSquare
How to Read a Crypto Chart
You don't need dozens of indicators to start learning technical analysis.
Focus on the basics:
🕯️ Candlesticks — Understand price movement.
🟢 Support — An area where buying interest may appear.
🔴 Resistance — An area where selling pressure may appear.
📊 Volume — Helps understand the strength of a move.
📈 Trend — Identify whether the market is generally moving up, down, or sideways.
Learn the chart before trying to predict it.
#TechnicalAnalysis #CryptoTrading #charts #TradingEducation #BinanceSquare

19

📊 A TRADER’S GUIDE TO THE MARKET
The goal of trading isn’t to catch every move — it’s to protect your capital and take quality setups. 🧠📈
Before entering any trade, ask yourself:
🔹 1. What is the trend?
Identify whether the market is bullish, bearish, or ranging.
🔹 2. Where are the key levels?
Mark important support and resistance zones before opening a position.
🔹 3. Is there confirmation?
Don’t enter just because a candle looks strong. Check price action and volume for confirmation.
🔹 4. Where is my invalidation?
Know your stop-loss level before entering the trade.
🔹 5. What is my risk?
Never risk more than you can comfortably afford to lose. A good setup can still fail.
💡 Remember:
A trader who protects capital today stays in the market long enough to find opportunities tomorrow.
❤️ Trade less. Think more. Stay disciplined.
🦅 Follow Crypto Market Hawk for more trading education, market insights & technical analysis.
👍 If this post helped you, like, follow & share it with fellow traders.
#CryptoTrading #TradingEducation #TechnicalAnalysisPost #TradingTips #BinanceSquareBTC
📊 A TRADER’S GUIDE TO THE MARKET
The goal of trading isn’t to catch every move — it’s to protect your capital and take quality setups. 🧠📈
Before entering any trade, ask yourself:
🔹 1. What is the trend?
Identify whether the market is bullish, bearish, or ranging.
🔹 2. Where are the key levels?
Mark important support and resistance zones before opening a position.
🔹 3. Is there confirmation?
Don’t enter just because a candle looks strong. Check price action and volume for confirmation.
🔹 4. Where is my invalidation?
Know your stop-loss level before entering the trade.
🔹 5. What is my risk?
Never risk more than you can comfortably afford to lose. A good setup can still fail.
💡 Remember:
A trader who protects capital today stays in the market long enough to find opportunities tomorrow.
❤️ Trade less. Think more. Stay disciplined.
🦅 Follow Crypto Market Hawk for more trading education, market insights & technical analysis.
👍 If this post helped you, like, follow & share it with fellow traders.
#CryptoTrading #TradingEducation #TechnicalAnalysisPost #TradingTips #BinanceSquareBTC
The goal of trading isn’t to catch every move — it’s to protect your capital and take quality setups. 🧠📈
Before entering any trade, ask yourself:
🔹 1. What is the trend?
Identify whether the market is bullish, bearish, or ranging.
🔹 2. Where are the key levels?
Mark important support and resistance zones before opening a position.
🔹 3. Is there confirmation?
Don’t enter just because a candle looks strong. Check price action and volume for confirmation.
🔹 4. Where is my invalidation?
Know your stop-loss level before entering the trade.
🔹 5. What is my risk?
Never risk more than you can comfortably afford to lose. A good setup can still fail.
💡 Remember:
A trader who protects capital today stays in the market long enough to find opportunities tomorrow.
❤️ Trade less. Think more. Stay disciplined.
🦅 Follow Crypto Market Hawk for more trading education, market insights & technical analysis.
👍 If this post helped you, like, follow & share it with fellow traders.
#CryptoTrading #TradingEducation #TechnicalAnalysisPost #TradingTips #BinanceSquareBTC
46
Think of an order block like a half-empty elevator that suddenly gets full on one floor. That floor didn't get crowded by accident — a big batch of people boarded there, and whenever the elevator passes that level again, it tends to slow down and check if anyone's still waiting.
That's the origin candle of a strong move. Large positioning happened there, and price often returns to that area to let remaining orders fill before continuing.
Watch for this: never mark it as one thin line. Mark the full candle's range, open to close or wick to wick. Reactions happen across a zone, not a pixel.
How do you currently define your zones — by body or by wick?
$BNB $SOL $XRP #Trading #TradingEducation #Crypto #TA
Follow for daily trading education · Education only, not financial advice.
Think of an order block like a half-empty elevator that suddenly gets full on one floor. That floor didn't get crowded by accident — a big batch of people boarded there, and whenever the elevator passes that level again, it tends to slow down and check if anyone's still waiting.
That's the origin candle of a strong move. Large positioning happened there, and price often returns to that area to let remaining orders fill before continuing.
Watch for this: never mark it as one thin line. Mark the full candle's range, open to close or wick to wick. Reactions happen across a zone, not a pixel.
How do you currently define your zones — by body or by wick?
$BNB $SOL $XRP #Trading #TradingEducation #Crypto #TA
Follow for daily trading education · Education only, not financial advice.
That's the origin candle of a strong move. Large positioning happened there, and price often returns to that area to let remaining orders fill before continuing.
Watch for this: never mark it as one thin line. Mark the full candle's range, open to close or wick to wick. Reactions happen across a zone, not a pixel.
How do you currently define your zones — by body or by wick?
$BNB $SOL $XRP #Trading #TradingEducation #Crypto #TA
Follow for daily trading education · Education only, not financial advice.

147
Retail chases candles. Size builds positions in silence.
Accumulation doesn't happen on a green breakout bar — it happens in the boring range nobody wants to watch, where price goes sideways for what feels like forever. Large participants can't buy or sell all at once without moving the market against themselves, so they scale in slowly, absorbing supply while chart watchers get bored and leave. Distribution works the same way in reverse: it looks like strength right before it isn't, because size is quietly handing off to demand created by late excitement.
Watch for tightening ranges after a strong move, paired with volume that doesn't match the price action. That mismatch is often where the real story is written.
What's the most boring chart you're currently ignoring?
$SOL $XRP $ADA #Trading #TradingEducation #Crypto #TA
Follow for daily trading education · Education only, not financial advice.
Retail chases candles. Size builds positions in silence.
Accumulation doesn't happen on a green breakout bar — it happens in the boring range nobody wants to watch, where price goes sideways for what feels like forever. Large participants can't buy or sell all at once without moving the market against themselves, so they scale in slowly, absorbing supply while chart watchers get bored and leave. Distribution works the same way in reverse: it looks like strength right before it isn't, because size is quietly handing off to demand created by late excitement.
Watch for tightening ranges after a strong move, paired with volume that doesn't match the price action. That mismatch is often where the real story is written.
What's the most boring chart you're currently ignoring?
$SOL $XRP $ADA #Trading #TradingEducation #Crypto #TA
Follow for daily trading education · Education only, not financial advice.
Accumulation doesn't happen on a green breakout bar — it happens in the boring range nobody wants to watch, where price goes sideways for what feels like forever. Large participants can't buy or sell all at once without moving the market against themselves, so they scale in slowly, absorbing supply while chart watchers get bored and leave. Distribution works the same way in reverse: it looks like strength right before it isn't, because size is quietly handing off to demand created by late excitement.
Watch for tightening ranges after a strong move, paired with volume that doesn't match the price action. That mismatch is often where the real story is written.
What's the most boring chart you're currently ignoring?
$SOL $XRP $ADA #Trading #TradingEducation #Crypto #TA
Follow for daily trading education · Education only, not financial advice.

293


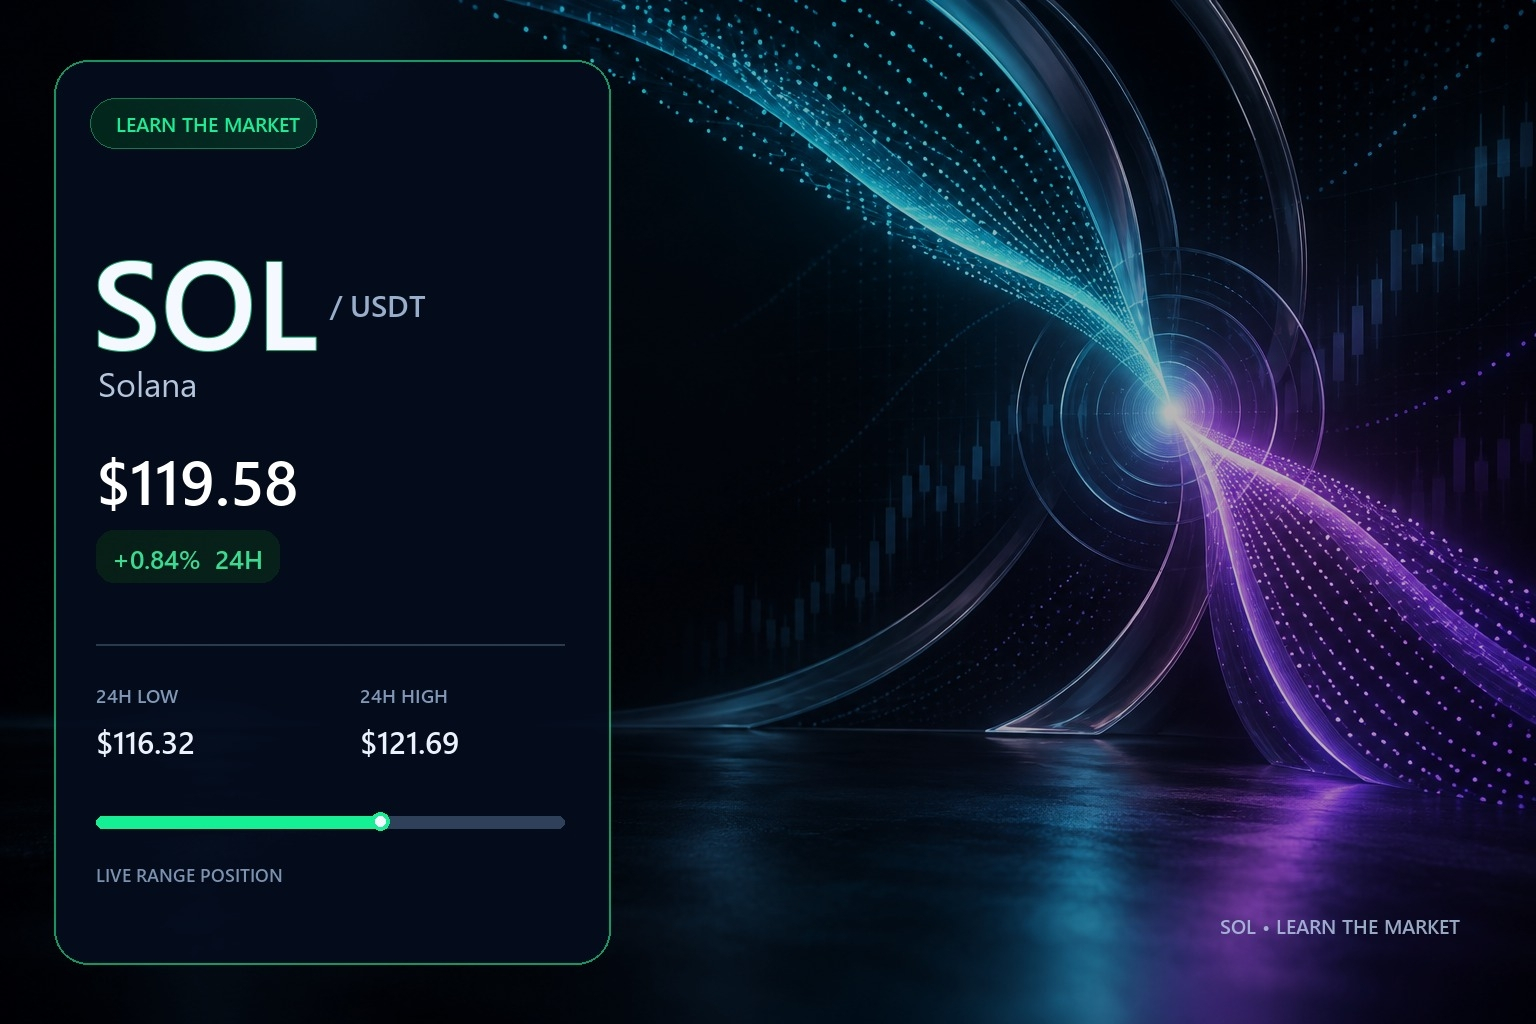
Flash update. SOL is trading at 119.58 dollars up 0.84 percent over the last twenty four hours. Here are three quick data points you need to know now. The twenty four hour high reached 121.69 dollars. The twenty four hour low touched 116.32 dollars. Price action remains tight within this narrow daily range. Let us master volatility using these exact numbers. Volatility measures how much an asset price fluctuates over a specific timeframe. Look at SOL moving between 116.32 and 121.69 dollars today. That distance represents the current daily volatility of the asset. High volatility means wide price swings while low volatility means tight consolidation. Understanding this range helps traders gauge market uncertainty accurately. Not financial advice and DYOR. Always calculate your risk before placing any trades. $SOL #Write2Earn #CryptoTrading #Solana #TradingEducation
Flash update. SOL is trading at 119.58 dollars up 0.84 percent over the last twenty four hours. Here are three quick data points you need to know now. The twenty four hour high reached 121.69 dollars. The twenty four hour low touched 116.32 dollars. Price action remains tight within this narrow daily range. Let us master volatility using these exact numbers. Volatility measures how much an asset price fluctuates over a specific timeframe. Look at SOL moving between 116.32 and 121.69 dollars today. That distance represents the current daily volatility of the asset. High volatility means wide price swings while low volatility means tight consolidation. Understanding this range helps traders gauge market uncertainty accurately. Not financial advice and DYOR. Always calculate your risk before placing any trades. $SOL #Write2Earn #CryptoTrading #Solana #TradingEducation
103
Most traders can define an uptrend but can't actually see one forming in real time.
Market structure is just a record of who's winning the fight between buyers and sellers. Higher highs and higher lows mean buyers are stepping in earlier each time, before price even reaches the old low. That's demand strengthening. A break of structure happens when price fails to make a new higher low and instead breaks below the prior one — it's the first hard evidence that control has shifted, not a guess about it.
Watch how price behaves at the last swing low, not the last swing high. That's where the truth shows up first.
What's the last structure break you actually caught before the crowd noticed?
$AVAX $LINK $TRX #Trading #TradingEducation #Crypto #TA
Follow for daily trading education · Education only, not financial advice.
Most traders can define an uptrend but can't actually see one forming in real time.
Market structure is just a record of who's winning the fight between buyers and sellers. Higher highs and higher lows mean buyers are stepping in earlier each time, before price even reaches the old low. That's demand strengthening. A break of structure happens when price fails to make a new higher low and instead breaks below the prior one — it's the first hard evidence that control has shifted, not a guess about it.
Watch how price behaves at the last swing low, not the last swing high. That's where the truth shows up first.
What's the last structure break you actually caught before the crowd noticed?
$AVAX $LINK $TRX #Trading #TradingEducation #Crypto #TA
Follow for daily trading education · Education only, not financial advice.
Market structure is just a record of who's winning the fight between buyers and sellers. Higher highs and higher lows mean buyers are stepping in earlier each time, before price even reaches the old low. That's demand strengthening. A break of structure happens when price fails to make a new higher low and instead breaks below the prior one — it's the first hard evidence that control has shifted, not a guess about it.
Watch how price behaves at the last swing low, not the last swing high. That's where the truth shows up first.
What's the last structure break you actually caught before the crowd noticed?
$AVAX $LINK $TRX #Trading #TradingEducation #Crypto #TA
Follow for daily trading education · Education only, not financial advice.

143

2. Stratégie & Discipline : Protéger son capital avec la règle du 1\% 🛡️
Titre : ⚠️ La clé de la longévité en trading : Ne risquez jamais tout sur une seule position
Contenu :
Beaucoup de traders débutants cherchent le "coup parfait", mais les professionnels recherchent la constance et la gestion du risque.
📌 Comment appliquer la règle du 1% en pratique ?
Calculez le risque max : Ne permettez jamais à un trade perdant d'imputer plus de 1% de la valeur totale de votre portefeuille.
Placez votre Stop-Loss : Déterminez votre niveau d'invalidation technique avant d'ouvrir la position.
Adaptez la taille : Ajustez le montant engagé en fonction de la distance jusqu'à votre Stop-Loss.
Gérer ses pertes est le premier pas pour accumuler des gains durables. 📈
#RiskManagement #TradingEducation #SpotTrading #BinanceSquare #CryptoMindset
2. Stratégie & Discipline : Protéger son capital avec la règle du 1\% 🛡️
Titre : ⚠️ La clé de la longévité en trading : Ne risquez jamais tout sur une seule position
Contenu :
Beaucoup de traders débutants cherchent le "coup parfait", mais les professionnels recherchent la constance et la gestion du risque.
📌 Comment appliquer la règle du 1% en pratique ?
Calculez le risque max : Ne permettez jamais à un trade perdant d'imputer plus de 1% de la valeur totale de votre portefeuille.
Placez votre Stop-Loss : Déterminez votre niveau d'invalidation technique avant d'ouvrir la position.
Adaptez la taille : Ajustez le montant engagé en fonction de la distance jusqu'à votre Stop-Loss.
Gérer ses pertes est le premier pas pour accumuler des gains durables. 📈
#RiskManagement #TradingEducation #SpotTrading #BinanceSquare #CryptoMindset
Titre : ⚠️ La clé de la longévité en trading : Ne risquez jamais tout sur une seule position
Contenu :
Beaucoup de traders débutants cherchent le "coup parfait", mais les professionnels recherchent la constance et la gestion du risque.
📌 Comment appliquer la règle du 1% en pratique ?
Calculez le risque max : Ne permettez jamais à un trade perdant d'imputer plus de 1% de la valeur totale de votre portefeuille.
Placez votre Stop-Loss : Déterminez votre niveau d'invalidation technique avant d'ouvrir la position.
Adaptez la taille : Ajustez le montant engagé en fonction de la distance jusqu'à votre Stop-Loss.
Gérer ses pertes est le premier pas pour accumuler des gains durables. 📈
#RiskManagement #TradingEducation #SpotTrading #BinanceSquare #CryptoMindset
145
Flash update. Most traders fail not from bad entries, but from ignoring basic math. Master your risk before placing your next $BTC trade. Three rules to protect your capital. First, never risk more than one percent of your account on a single idea. Second, calculate your position size using your stop loss distance, not your emotions. Third, let market structure dictate your exits, not hope. Risk management is the only edge you truly control. Not financial advice. DYOR. $ETH #Write2Earn #CryptoTrading #RiskManagement #TradingEducation
Flash update. Most traders fail not from bad entries, but from ignoring basic math. Master your risk before placing your next $BTC trade. Three rules to protect your capital. First, never risk more than one percent of your account on a single idea. Second, calculate your position size using your stop loss distance, not your emotions. Third, let market structure dictate your exits, not hope. Risk management is the only edge you truly control. Not financial advice. DYOR. $ETH #Write2Earn #CryptoTrading #RiskManagement #TradingEducation
60
Log in to explore more content
Join global crypto users on Binance Square
⚡️ Get latest and useful information about crypto.
💬 Trusted by the world’s largest crypto exchange.
👍 Discover real insights from verified creators.
အီးမေးလ် / ဖုန်းနံပါတ်
ရေပန်းစားနေသော ခေါင်းစဉ်များ
1
#BinanceLaunchesBinanceIntelligence
151,235 views
1,471 Discussing
2
#StriveBuys2000BTCFor$169M
6,376 views
67 Discussing
3
#EvernorthXRPTreasuryCompletesSPACMerger
92,040 views
913 Discussing
4
#ADAGains10%Above$0.27
45,244 views
241 Discussing
5
#ETHUp70%InQ3ButLiquidityFalls
292,037 views
1,976 Discussing
6
#EthStakingExitQueueHits2026High
111,112 views
1,306 Discussing
7
#FedOctoberHoldOdds82.3%
120,443 views
1,259 Discussing
8
#Nikkei225Jumps2.5%ToThreeMonthHigh
112,156 views
1,446 Discussing
9
#CircleMints$2.75BUSDCOnSolanaIn7Days
2,997 views
60 Discussing
10
#DriftHackVictimsBeginClaims
228,943 views
2,139 Discussing