ethusdt

ကြည့်ရှုမှု 6.6M ကြိမ်
15,785 ဦး ဆွေးနွေးနေသည်
Asma-Doll
·
--
ဘာသာပြန်ဆိုချက် ကြည့်မည်
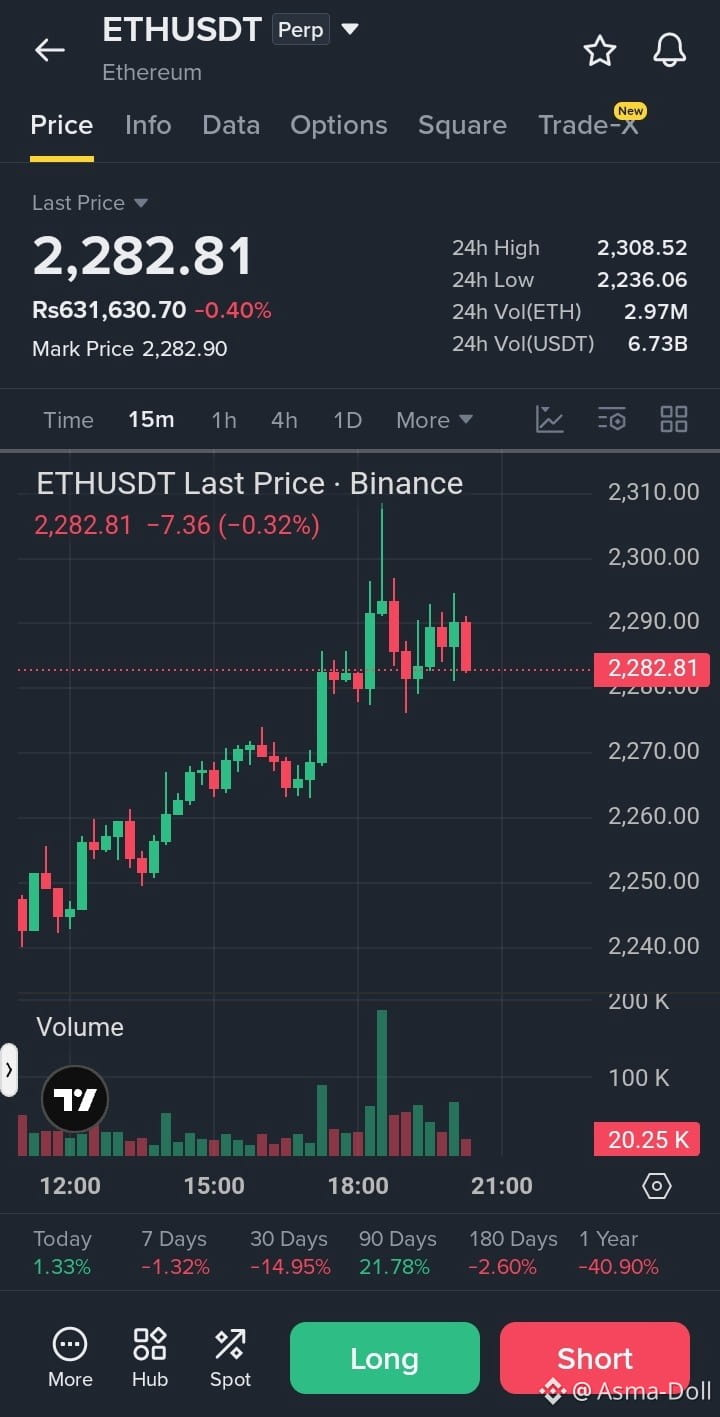
🔴 $ETH /USDT – SHORT SIGNAL Trade Plan: Direction: SHORT 📉 Entry: $2,280 – $2,290 Stop Loss (SL): $2,315 Take Profit Targets: TP1: $2,260 TP2: $2,240 TP3: $2,215 Trade here $ETH {future}(ETHUSDT) Analysis: ETH facing rejection near the $2,308 resistance zone. Price showing weak momentum around $2,282. Overall 30-day performance is down 14.95%. Sellers may push price toward the $2,260 support. Bearish continuation possible if buyers fail to defend support. Confirmation: Breakdown below $2,275 with strong selling volume confirms short momentum. Avoid entering if ETH strongly reclaims $2,300. Risk-to-Reward: TP1: 1:0.57 TP2: 1:1.14 TP3: 1:1.86 ⚠️ Invalidation: Exit if price breaks and holds above $2,315. Wait for confirmation; don't chase the move. #ETHUSDT #Ethereum #ETHShort #CryptoSignals #BinanceFutures
🔴 $ETH /USDT – SHORT SIGNAL

Trade Plan:

Direction: SHORT 📉

Entry: $2,280 – $2,290

Stop Loss (SL): $2,315

Take Profit Targets:

TP1: $2,260

TP2: $2,240

TP3: $2,215

Trade here $ETH

Analysis:

ETH facing rejection near the $2,308 resistance zone.

Price showing weak momentum around $2,282.

Overall 30-day performance is down 14.95%.

Sellers may push price toward the $2,260 support.

Bearish continuation possible if buyers fail to defend support.

Confirmation:

Breakdown below $2,275 with strong selling volume confirms short momentum.

Avoid entering if ETH strongly reclaims $2,300.

Risk-to-Reward:

TP1: 1:0.57

TP2: 1:1.14

TP3: 1:1.86

⚠️ Invalidation: Exit if price breaks and holds above $2,315. Wait for confirmation; don't chase the move.

#ETHUSDT #Ethereum #ETHShort #CryptoSignals #BinanceFutures
·
--
ဘာသာပြန်ဆိုချက် ကြည့်မည်
🚀 ETHEREUM: IS THE NEXT MOVE UP? $ETH {spot}(ETHUSDT) Ethereum is showing positive momentum, with approximately $11.46 BILLION in 24H trading volume! 🔥 📊 Market Snapshot • Current Price: $2,249.55 • 24H Change: +0.5% • 7D Change: +3.0% • 24H Volume: $11.46B 📈 My Technical Outlook ETH is showing signs of strength, but traders should watch for confirmation before entering a position. 🟢 Bulls need to maintain buying pressure. 🔴 Bears will look for a breakdown of short-term support. 👀 Volume confirmation will be important for the next move. My question: Will ETH reclaim stronger bullish momentum, or are we heading for another correction? Drop your ETH prediction below! 👇 #Ethereum #ETH #CryptoAnalysis #BinanceSquare #TechnicalAnalysis #CryptoTrading #Altcoins #ETHUSDT
🚀 ETHEREUM: IS THE NEXT MOVE UP?
$ETH

Ethereum is showing positive momentum, with approximately $11.46 BILLION in 24H trading volume! 🔥

📊 Market Snapshot
• Current Price: $2,249.55
• 24H Change: +0.5%
• 7D Change: +3.0%
• 24H Volume: $11.46B

📈 My Technical Outlook
ETH is showing signs of strength, but traders should watch for confirmation before entering a position.

🟢 Bulls need to maintain buying pressure.
🔴 Bears will look for a breakdown of short-term support.
👀 Volume confirmation will be important for the next move.

My question: Will ETH reclaim stronger bullish momentum, or are we heading for another correction?

Drop your ETH prediction below! 👇

#Ethereum #ETH #CryptoAnalysis #BinanceSquare #TechnicalAnalysis #CryptoTrading #Altcoins #ETHUSDT
Article
ဘာသာပြန်ဆိုချက် ကြည့်မည်
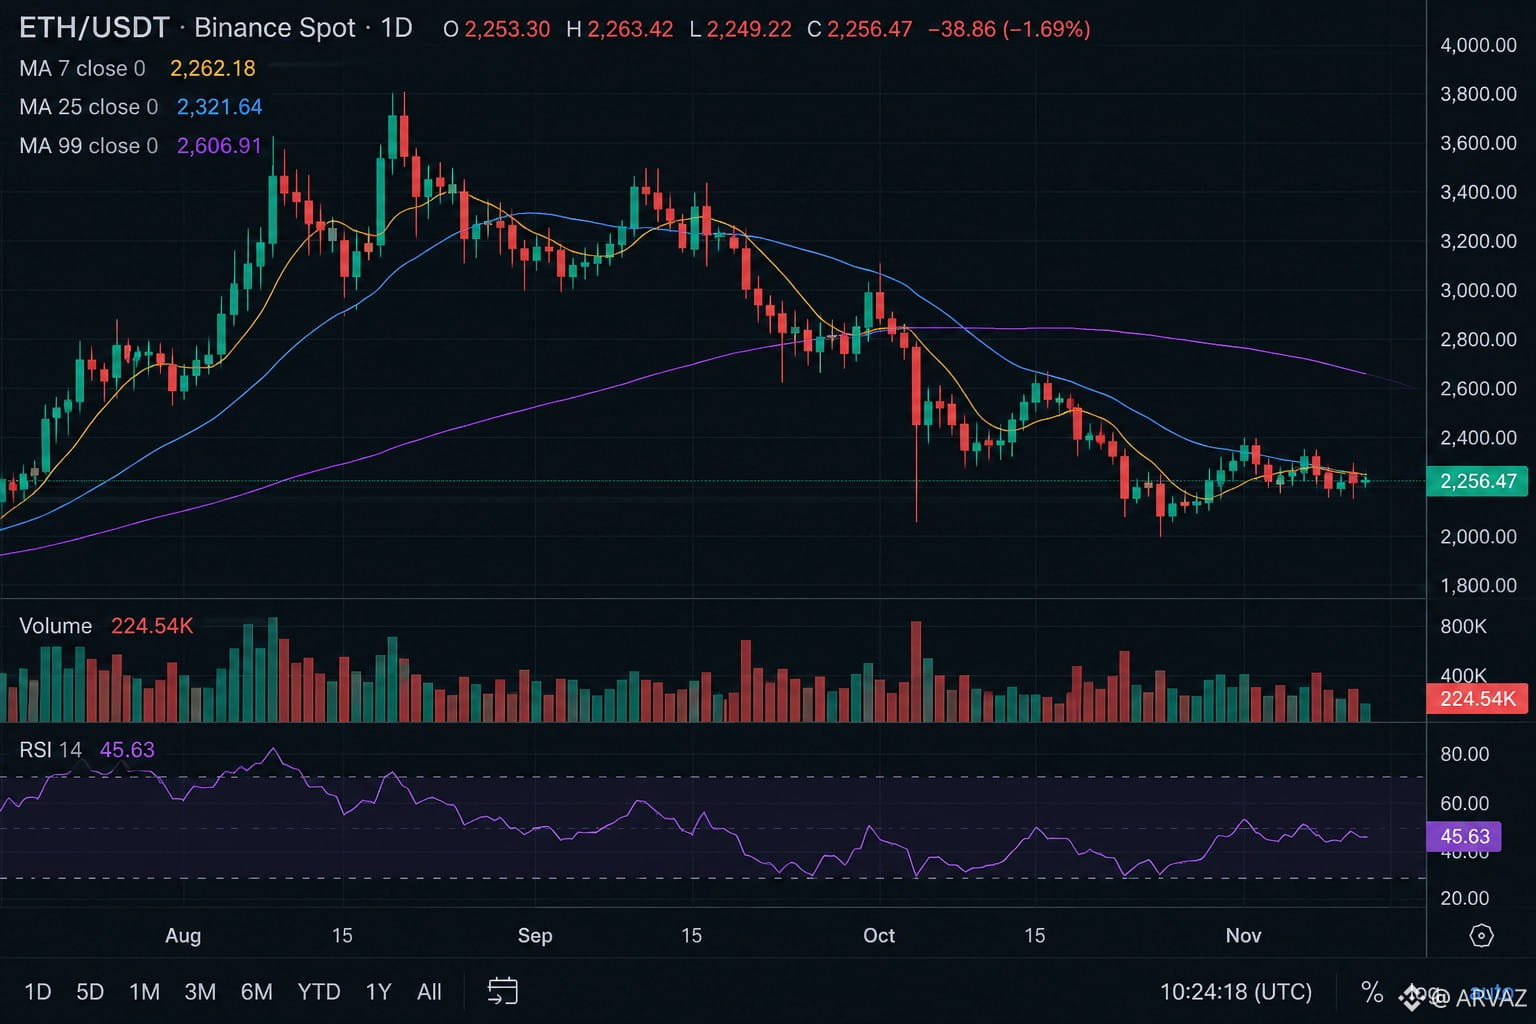
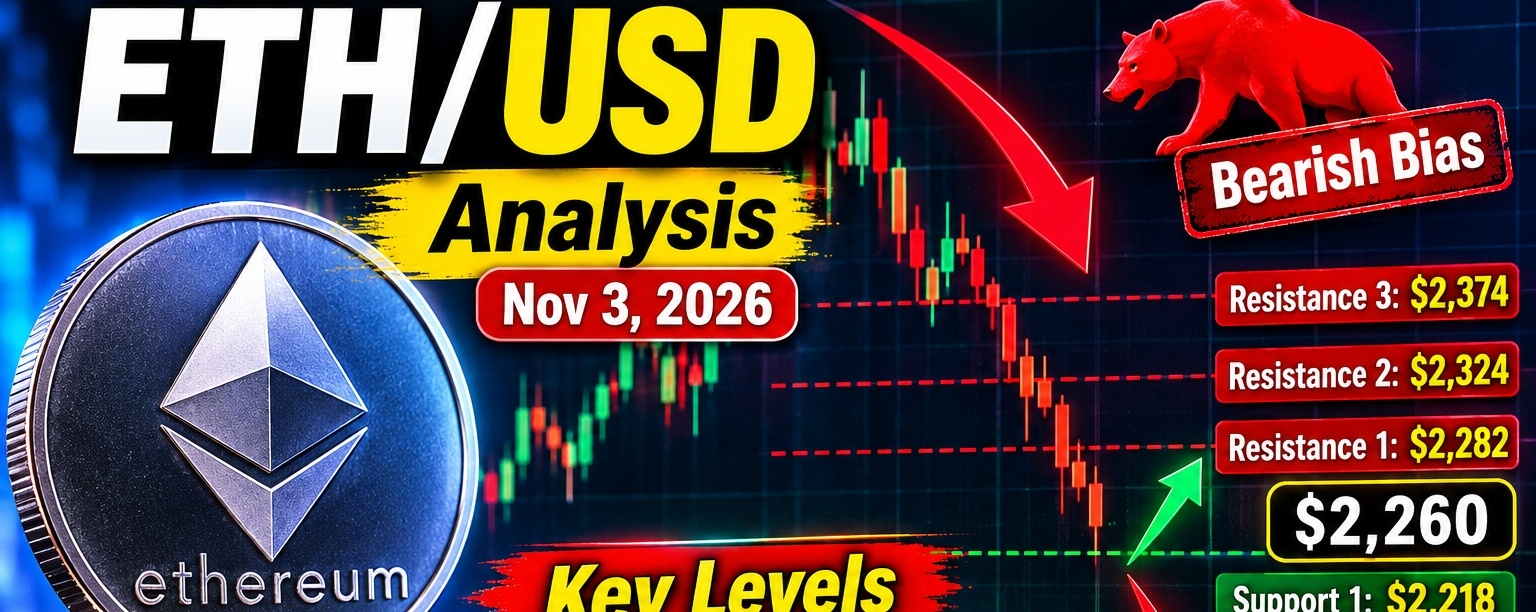
ETH/USD Technical Analysis — November 3, 2026$ETH /USD Technical Analysis — November 3, 2026 {spot}(ETHUSDT) Ethereum ($ETH ) · Short-term trading outlook · USD ![](https://images.openai.com/static-rsc-4/5sisfUXp6zIImaDBY58RQILHJOWCRf_fiRkicFp0uKpw3-3REFtwOaIk74HVxj662zZzUA8TiPmrQD-pVSvhKMvOsX22vvUDL1gxJJs1BeyaTyACgZYEBuxdhqH9r9x1QH_lqwjQycYfsOkQeNKr00ZqYQ714h0-j6IN5o8E4lE7Lr1fKqWVmNqg6GMhyby_?purpose=fullsize) ### $2,258–$2,266 Indicative market-price range from recent market data Bearish bias Ethereum is showing a bearish short-term technical structure, although small relief rallies remain possible. Recent market data places ETH around $2,260, with technical indicators leaning bearish and the daily RSI near 35. OHLCX Markets +1 ### 1\. Key support and resistance levels | Level | Price (USD) | Significance | | ------------------ | ----------- | ----------------------- | | Resistance 3 | $2,374 | Higher recovery target | | Resistance 2 | $2,324 | Strong resistance zone | | Resistance 1 | $2,282 | First bullish test | | Current price area | $2,260 | Near-term decision zone | | Support 1 | $2,218 | Important support | | Support 2 | $2,164 | Next downside target | | Support 3 | $2,039 | Deeper bearish target | These are technical reference levels, not guaranteed price targets. COINOTAG +1 ### 2\. Technical indicators * RSI (14): approximately 34.6 — bearish momentum, approaching oversold territory. * MACD: Below the signal line, indicating downside momentum. * Moving averages: Most longer-period averages indicate selling pressure. * Trend strength: The daily trend is bearish, while the broader weekly outlook is more neutral. COINOTAG +2 ### 3\. $ETH /USD trading scenarios Bearish scenario — higher probability for now If ETH breaks below $2,218 and confirms the breakdown, the next levels to watch are $2,164 and potentially $2,039. Bullish recovery scenario If ETH reclaims $2,282 and holds above it, a recovery toward $2,324 and then $2,374 becomes possible. Sideways scenario If neither $2,218 support nor $2,282 resistance breaks decisively, ETH could remain range-bound in the near term. ### 4\. Trading plan | Strategy | Confirmation | Target levels | | ---------------- | --------------------------- | --------------------- | | Sell setup | Breakdown below $2,218 | $2,164 → $2,039 | | Buy setup | Break and hold above $2,282 | $2,324 → $2,374 | | Wait and observe | Price between key levels | Wait for confirmation | Use a stop-loss based on your timeframe and risk tolerance. Avoid entering a trade based only on a brief candle breakout. ### 5\. Final outlook Short-term trend Bearish Key support ### $2,218 Key resistance ### $2,282 Bullish confirmation ### Above $2,282 My view: ETH/USD currently favors caution and selling pressure until buyers reclaim the $2,282 resistance zone. A confirmed break below $2,218 would strengthen the bearish case. OHLCX Markets +1 This is technical market analysis, not a guarantee or personalized financial advice. Cryptocurrency prices can change rapidly, so verify the live chart before trading. #Ethereum #viralpost #ETHUSDT #TrendingTopic

ETH/USD Technical Analysis — November 3, 2026

$ETH /USD Technical Analysis — November 3, 2026
Ethereum ($ETH ) · Short-term trading outlook · USD
![](https://images.openai.com/static-rsc-4/5sisfUXp6zIImaDBY58RQILHJOWCRf_fiRkicFp0uKpw3-3REFtwOaIk74HVxj662zZzUA8TiPmrQD-pVSvhKMvOsX22vvUDL1gxJJs1BeyaTyACgZYEBuxdhqH9r9x1QH_lqwjQycYfsOkQeNKr00ZqYQ714h0-j6IN5o8E4lE7Lr1fKqWVmNqg6GMhyby_?purpose=fullsize)
### $2,258–$2,266
Indicative market-price range from recent market data
Bearish bias
Ethereum is showing a bearish short-term technical structure, although small relief rallies remain possible. Recent market data places ETH around $2,260, with technical indicators leaning bearish and the daily RSI near 35. OHLCX Markets +1
### 1\. Key support and resistance levels
| Level | Price (USD) | Significance |
| ------------------ | ----------- | ----------------------- |
| Resistance 3 | $2,374 | Higher recovery target |
| Resistance 2 | $2,324 | Strong resistance zone |
| Resistance 1 | $2,282 | First bullish test |
| Current price area | $2,260 | Near-term decision zone |
| Support 1 | $2,218 | Important support |
| Support 2 | $2,164 | Next downside target |
| Support 3 | $2,039 | Deeper bearish target |
These are technical reference levels, not guaranteed price targets. COINOTAG +1
### 2\. Technical indicators
* RSI (14): approximately 34.6 — bearish momentum, approaching oversold territory.
* MACD: Below the signal line, indicating downside momentum.
* Moving averages: Most longer-period averages indicate selling pressure.
* Trend strength: The daily trend is bearish, while the broader weekly outlook is more neutral. COINOTAG +2
### 3\. $ETH /USD trading scenarios
Bearish scenario — higher probability for now
If ETH breaks below $2,218 and confirms the breakdown, the next levels to watch are $2,164 and potentially $2,039.
Bullish recovery scenario
If ETH reclaims $2,282 and holds above it, a recovery toward $2,324 and then $2,374 becomes possible.
Sideways scenario
If neither $2,218 support nor $2,282 resistance breaks decisively, ETH could remain range-bound in the near term.
### 4\. Trading plan
| Strategy | Confirmation | Target levels |
| ---------------- | --------------------------- | --------------------- |
| Sell setup | Breakdown below $2,218 | $2,164 → $2,039 |
| Buy setup | Break and hold above $2,282 | $2,324 → $2,374 |
| Wait and observe | Price between key levels | Wait for confirmation |
Use a stop-loss based on your timeframe and risk tolerance. Avoid entering a trade based only on a brief candle breakout.
### 5\. Final outlook
Short-term trend
Bearish
Key support
### $2,218
Key resistance
### $2,282
Bullish confirmation
### Above $2,282
My view: ETH/USD currently favors caution and selling pressure until buyers reclaim the $2,282 resistance zone. A confirmed break below $2,218 would strengthen the bearish case. OHLCX Markets +1
This is technical market analysis, not a guarantee or personalized financial advice.
Cryptocurrency prices can change rapidly, so verify the live chart before trading.
#Ethereum #viralpost #ETHUSDT #TrendingTopic

·
--
တက်ရိပ်ရှိသည်
ဘာသာပြန်ဆိုချက် ကြည့်မည်
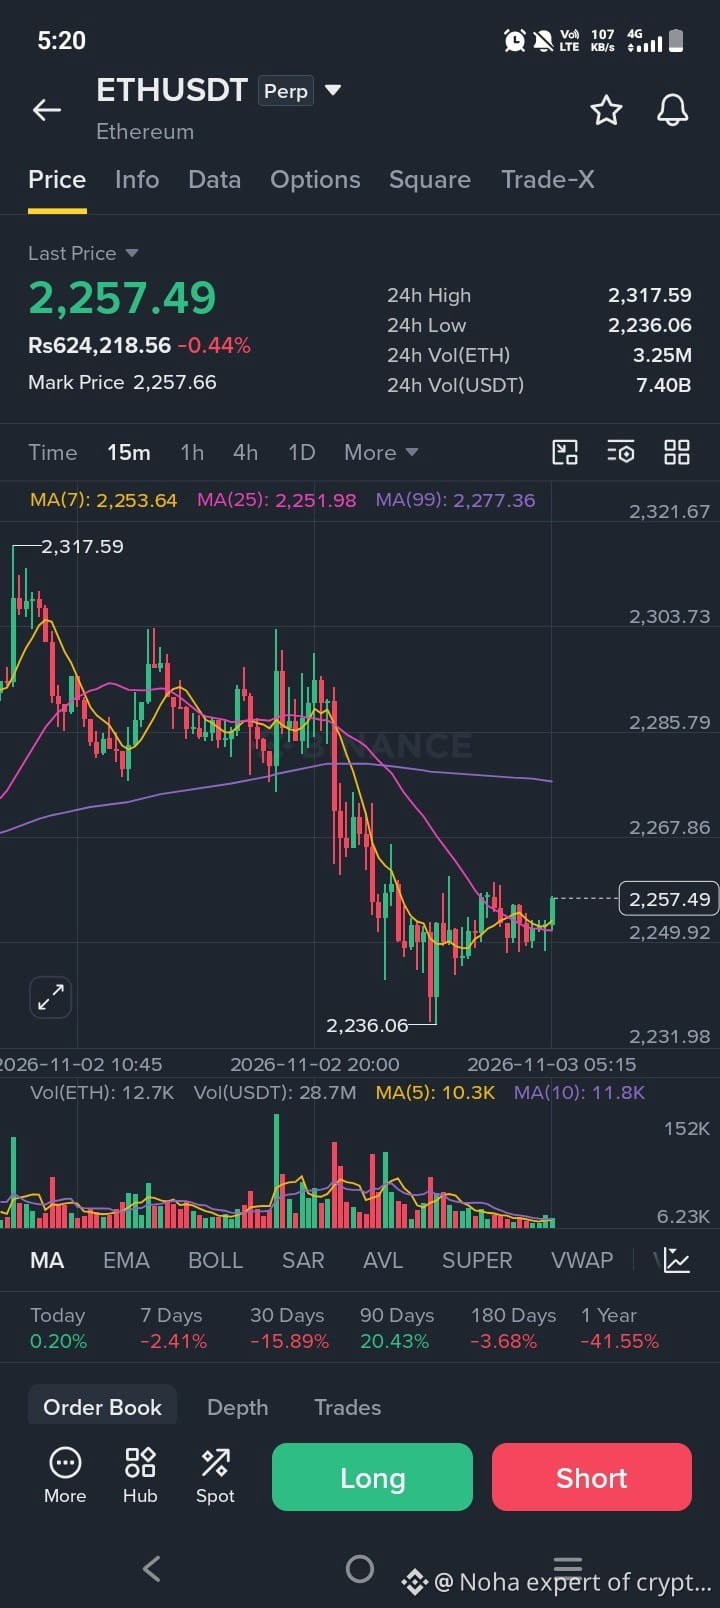
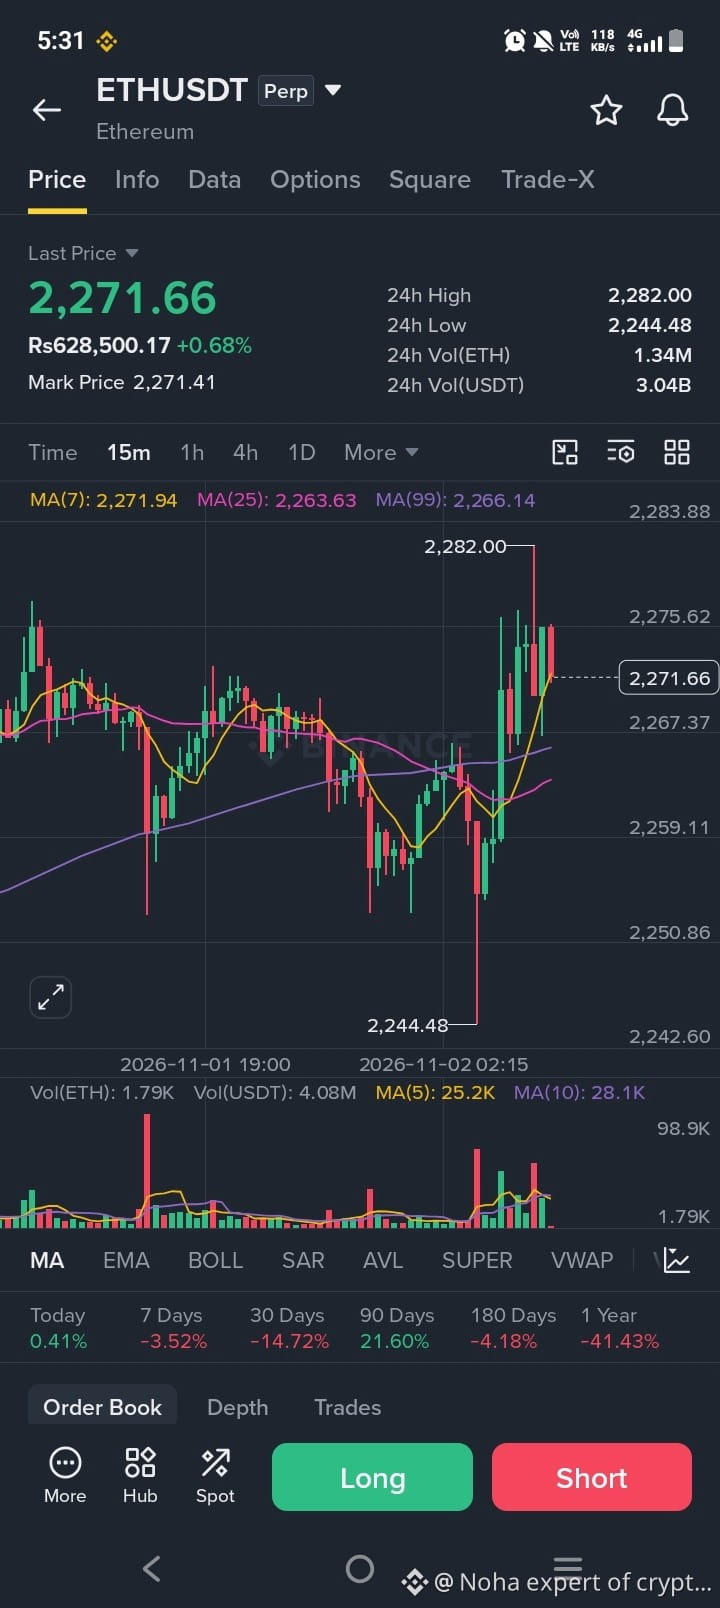
$ETH {future}(ETHUSDT) 📊 #ETH/USDT Perp SIGNAL (15m) 🟢 LONG Entry: 2252 – 2258 (above MA7 and MA25) 🎯 Targets: TP1: 2268 TP2: 2278 TP3: 2290 TP4: 2305 🛑 Stop Loss: 2238 ⚠️ DYOR. Not financial advice. #ETH #ETHUSDT #cryptotrading
$ETH
📊 #ETH/USDT Perp SIGNAL (15m)

🟢 LONG Entry: 2252 – 2258
(above MA7 and MA25)

🎯 Targets:
TP1: 2268
TP2: 2278
TP3: 2290
TP4: 2305

🛑 Stop Loss: 2238

⚠️ DYOR. Not financial advice.

#ETH #ETHUSDT #cryptotrading
ဘာသာပြန်ဆိုချက် ကြည့်မည်
🚨 ETHUSDT looking bearish! Current price $2259.19 is below SMA and sitting in the Discount Zone. Is this the dip you've been waiting for? 📉 With support at $2234.58 and resistance at $2317.59, the setup is primed for a short play. Risk/Reward 1:1.5 – manage your risk wisely! What's your move? Drop your thoughts below! #Crypto #Binance #ETHUSDT #Trading 🔔 Don't forget to follow for more updates! & Your Mr Zero ⚠️ Not financial advice - always DYOR. Click Here To Trade 👇
🚨 ETHUSDT looking bearish! Current price $2259.19 is below SMA and sitting in the Discount Zone. Is this the dip you've been waiting for? 📉 With support at $2234.58 and resistance at $2317.59, the setup is primed for a short play. Risk/Reward 1:1.5 – manage your risk wisely! What's your move? Drop your thoughts below! #Crypto #Binance #ETHUSDT #Trading

🔔 Don't forget to follow for more updates! & Your Mr Zero
⚠️ Not financial advice - always DYOR.

Click Here To Trade 👇
ဘာသာပြန်ဆိုချက် ကြည့်မည်
ETH is grinding lower, testing the 1,800 zone hard. Every candle’s trying to break the down‑trend line. 🔴 $ETH SHORT 📉 Entry $2,249.30-$2,253.80 | SL $2,319.10 (-3.0%) | TP1 $2,217.78 (+1.5%) | TP2 $2,138.97 (+5.0%) | R/R 1:1.7 | Conf 64% The market just flipped the structure with a clean CHoCH, and the CVD turned bearish confirming the move. I see a fresh order block sitting right on a fair‑value gap, and the liquidity sweep knocked out the last short‑side liquidity. The POI confluence of the OB and FVG gives extra ammo for the short. A 3.0 % stop is a bit tight for this swing, so stick to 2‑3× leverage. Take half profit around the first target as it hits the next resistance. Not financial advice — always manage your own risk 🙏 $ETH #ETHUSDT #THORChain #TradingSignals #Write2Earn
ETH is grinding lower, testing the 1,800 zone hard. Every candle’s trying to break the down‑trend line.

🔴 $ETH SHORT 📉
Entry $2,249.30-$2,253.80 | SL $2,319.10 (-3.0%) | TP1 $2,217.78 (+1.5%) | TP2 $2,138.97 (+5.0%) | R/R 1:1.7 | Conf 64%

The market just flipped the structure with a clean CHoCH, and the CVD turned bearish confirming the move. I see a fresh order block sitting right on a fair‑value gap, and the liquidity sweep knocked out the last short‑side liquidity. The POI confluence of the OB and FVG gives extra ammo for the short.

A 3.0 % stop is a bit tight for this swing, so stick to 2‑3× leverage.

Take half profit around the first target as it hits the next resistance.

Not financial advice — always manage your own risk 🙏

$ETH #ETHUSDT #THORChain #TradingSignals #Write2Earn
ဘာသာပြန်ဆိုချက် ကြည့်မည်
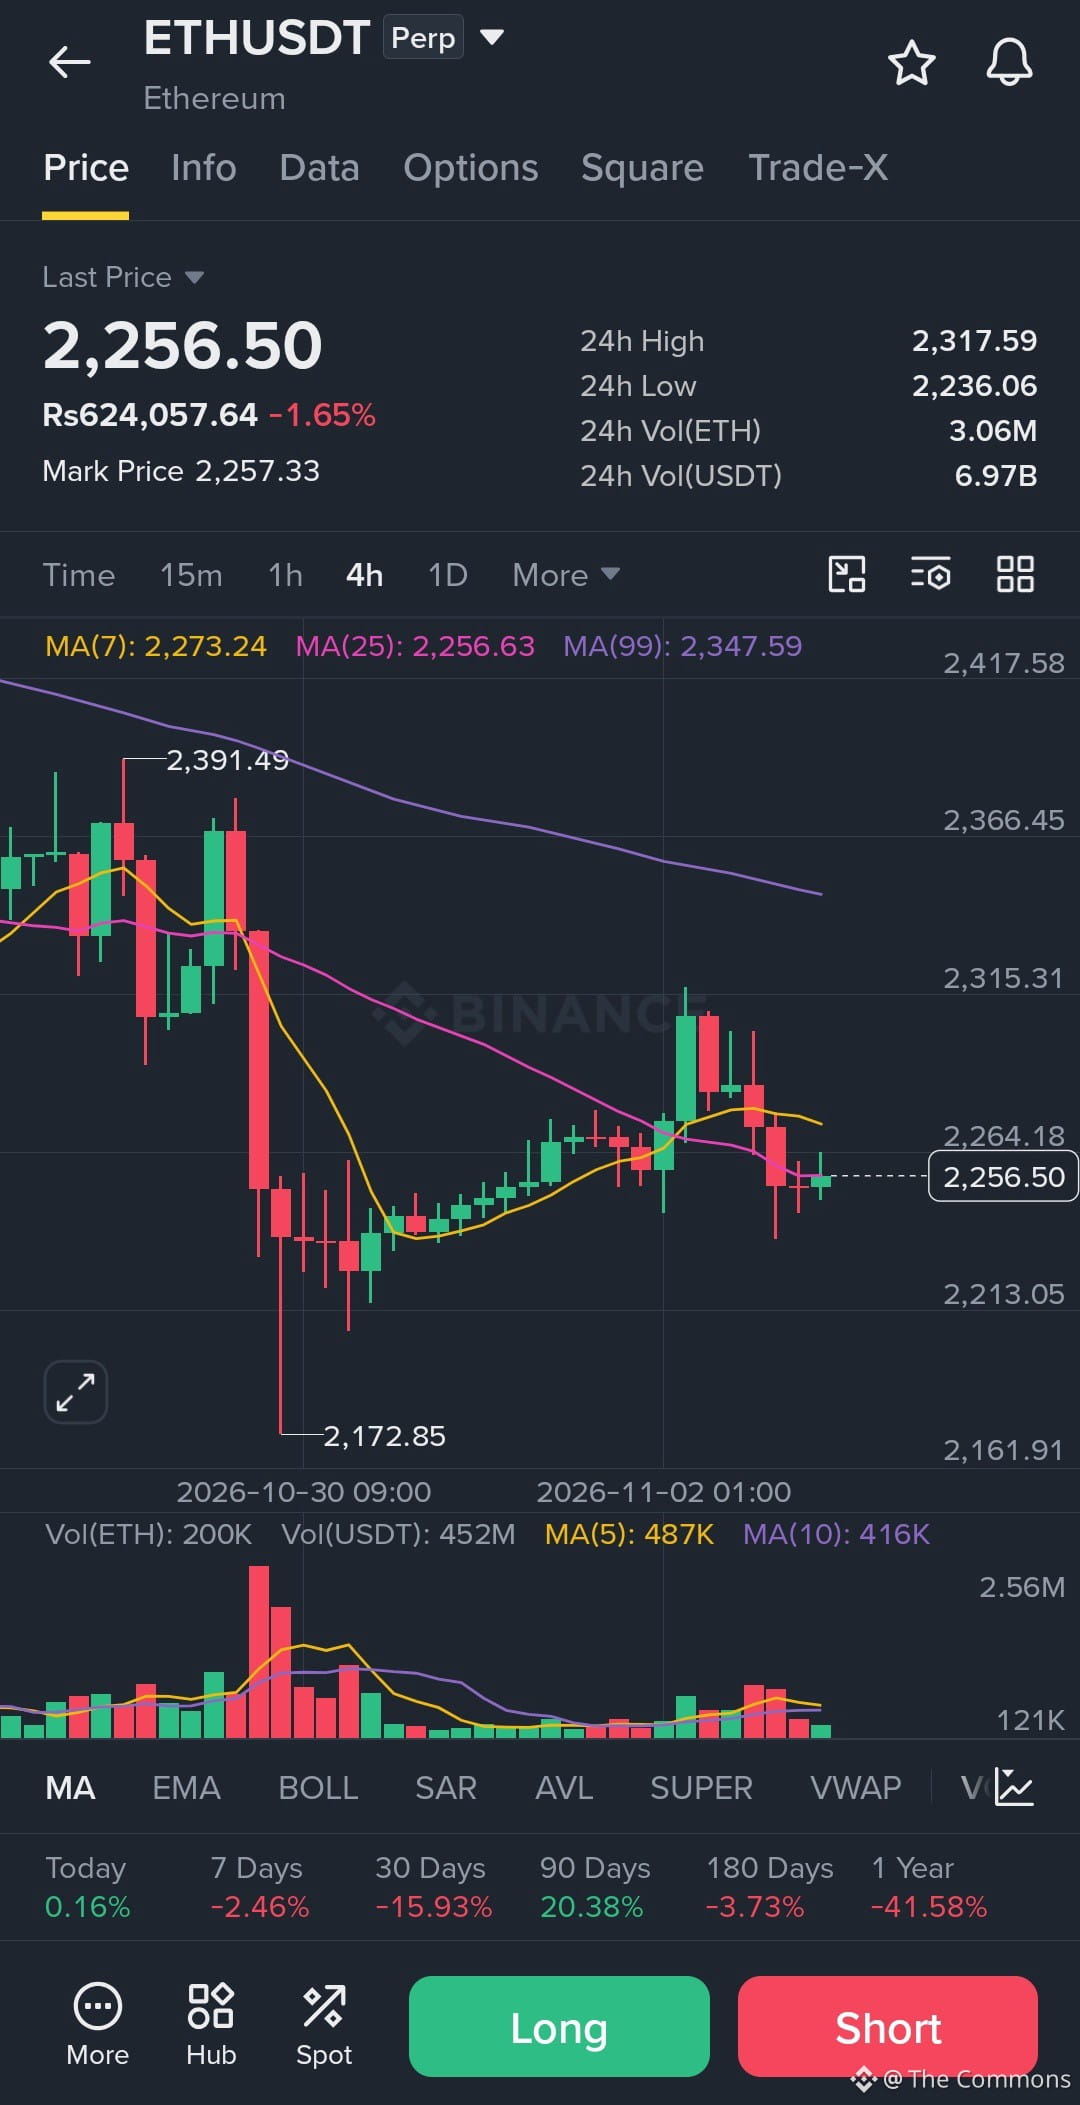
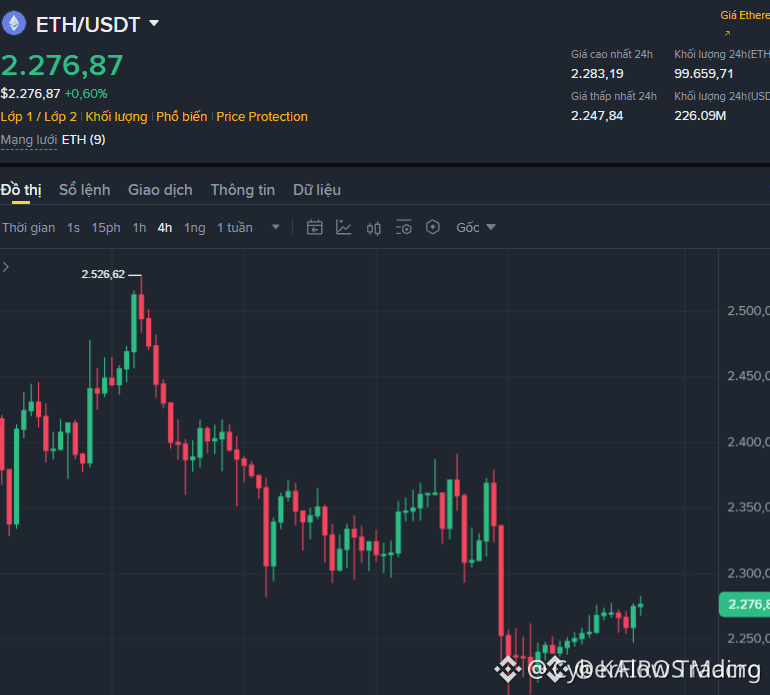
**$ETH Bearish 🔻** ETH is stuck at 2,256 on the 4H, below the MA(7) and capped by a downsloping MA(99) at 2,347. 🔴 Resistance: 2,273 / 2,315 🟢 Support: 2,236 / 2,172 A 4H close below 2,236 targets 2,172. Don't catch the knife. 🔪 *Not financial advice. DYOR.* #ETH #ETHUSDT #bearish {future}(ETHUSDT)
**$ETH Bearish 🔻**

ETH is stuck at 2,256 on the 4H, below the MA(7) and capped by a downsloping MA(99) at 2,347.

🔴 Resistance: 2,273 / 2,315
🟢 Support: 2,236 / 2,172

A 4H close below 2,236 targets 2,172. Don't catch the knife. 🔪

*Not financial advice. DYOR.*

#ETH #ETHUSDT #bearish
ဘာသာပြန်ဆိုချက် ကြည့်မည်
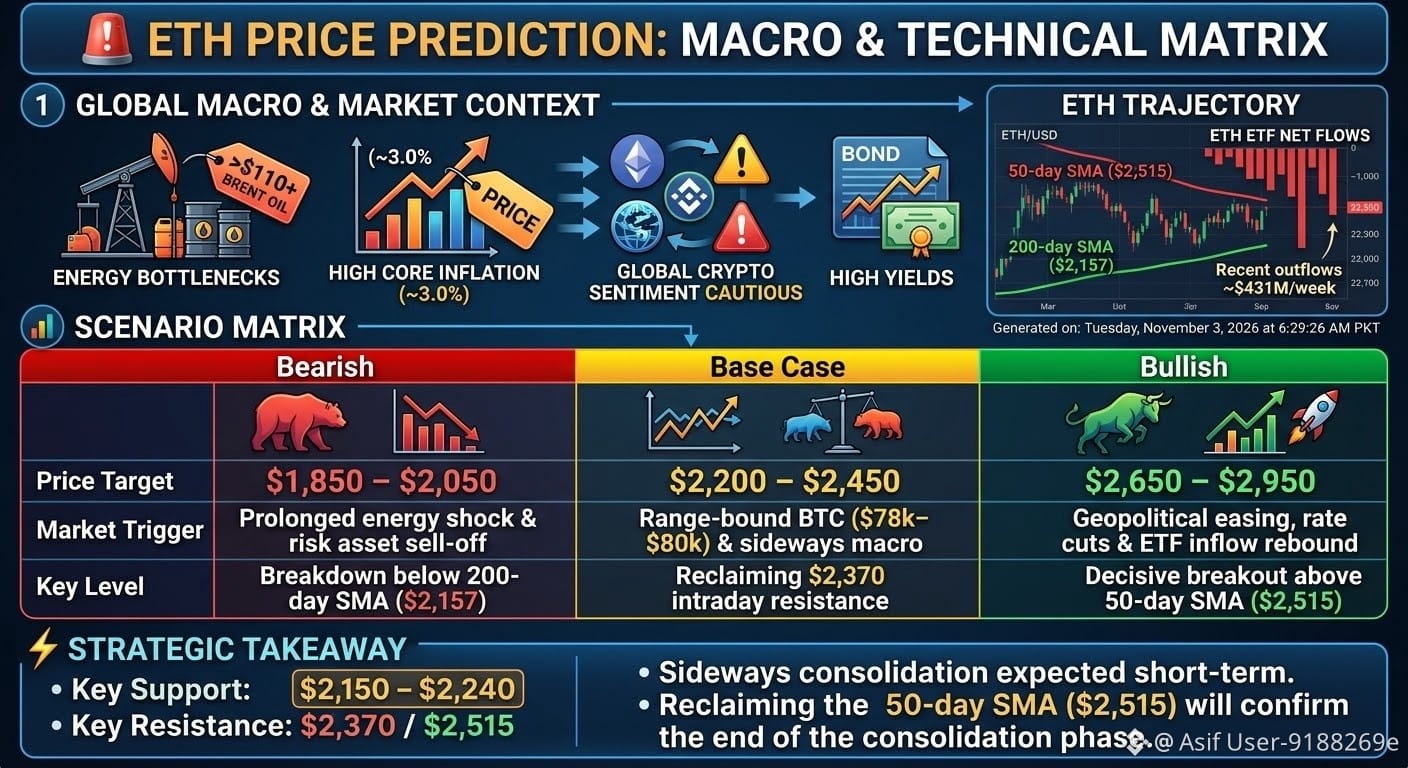
🚨 $ETH PRICE PREDICTION: MACRO & TECHNICAL MATRIX ​Macro Context: Ongoing Middle East escalation & energy bottlenecks ($110+ Brent oil) keep core inflation high (~3.0%). High yields and recent exchange security events keep global crypto sentiment cautious. ​ETH Trajectory: ETH is trading near $2,250 – $2,300, down ~24% YTD. Price trades below the 50-day SMA ($2,515) but holds above the 200-day SMA ($2,157). Recent ETF outflows (~$431M/week) act as near-term friction. ​📊 SCENARIO MATRIX Scenario Market Trigger Price Target Key Level Bearish Prolonged energy shock & risk asset sell-off $1,850 – $2,050 Breakdown below 200-day SMA ($2,157) Base Case Range-bound BTC ($78k–$80k) & sideways macro $2,200 – $2,450 Reclaiming $2,370 intraday resistance Bullish Geopolitical easing, rate cuts & ETF inflow rebound $2,650 – $2,950 Decisive breakout above 50-day SMA ($2,515) ⚡ STRATEGIC TAKEAWAY ​Key Support: $2,150 – $2,240 ​Key Resistance: $2,370 / $2,515 ​Sideways consolidation expected short-term. Reclaiming the 50-day SMA ($2,515) will confirm the end of the consolidation phase.#trading #CryptoMarket #BinanceSquare #ETHUSDT {spot}(ETHUSDT)
🚨 $ETH PRICE PREDICTION: MACRO & TECHNICAL MATRIX
​Macro Context: Ongoing Middle East escalation & energy bottlenecks ($110+ Brent oil) keep core inflation high (~3.0%). High yields and recent exchange security events keep global crypto sentiment cautious.
​ETH Trajectory: ETH is trading near $2,250 – $2,300, down ~24% YTD. Price trades below the 50-day SMA ($2,515) but holds above the 200-day SMA ($2,157). Recent ETF outflows (~$431M/week) act as near-term friction.
​📊 SCENARIO MATRIX
Scenario
Market Trigger
Price Target
Key Level
Bearish
Prolonged energy shock & risk asset sell-off
$1,850 – $2,050
Breakdown below 200-day SMA ($2,157)
Base Case
Range-bound BTC ($78k–$80k) & sideways macro
$2,200 – $2,450
Reclaiming $2,370 intraday resistance
Bullish
Geopolitical easing, rate cuts & ETF inflow rebound
$2,650 – $2,950
Decisive breakout above 50-day SMA ($2,515)
⚡ STRATEGIC TAKEAWAY
​Key Support: $2,150 – $2,240
​Key Resistance: $2,370 / $2,515
​Sideways consolidation expected short-term. Reclaiming the 50-day SMA ($2,515) will confirm the end of the consolidation phase.#trading #CryptoMarket #BinanceSquare #ETHUSDT
ဘာသာပြန်ဆိုချက် ကြည့်မည်
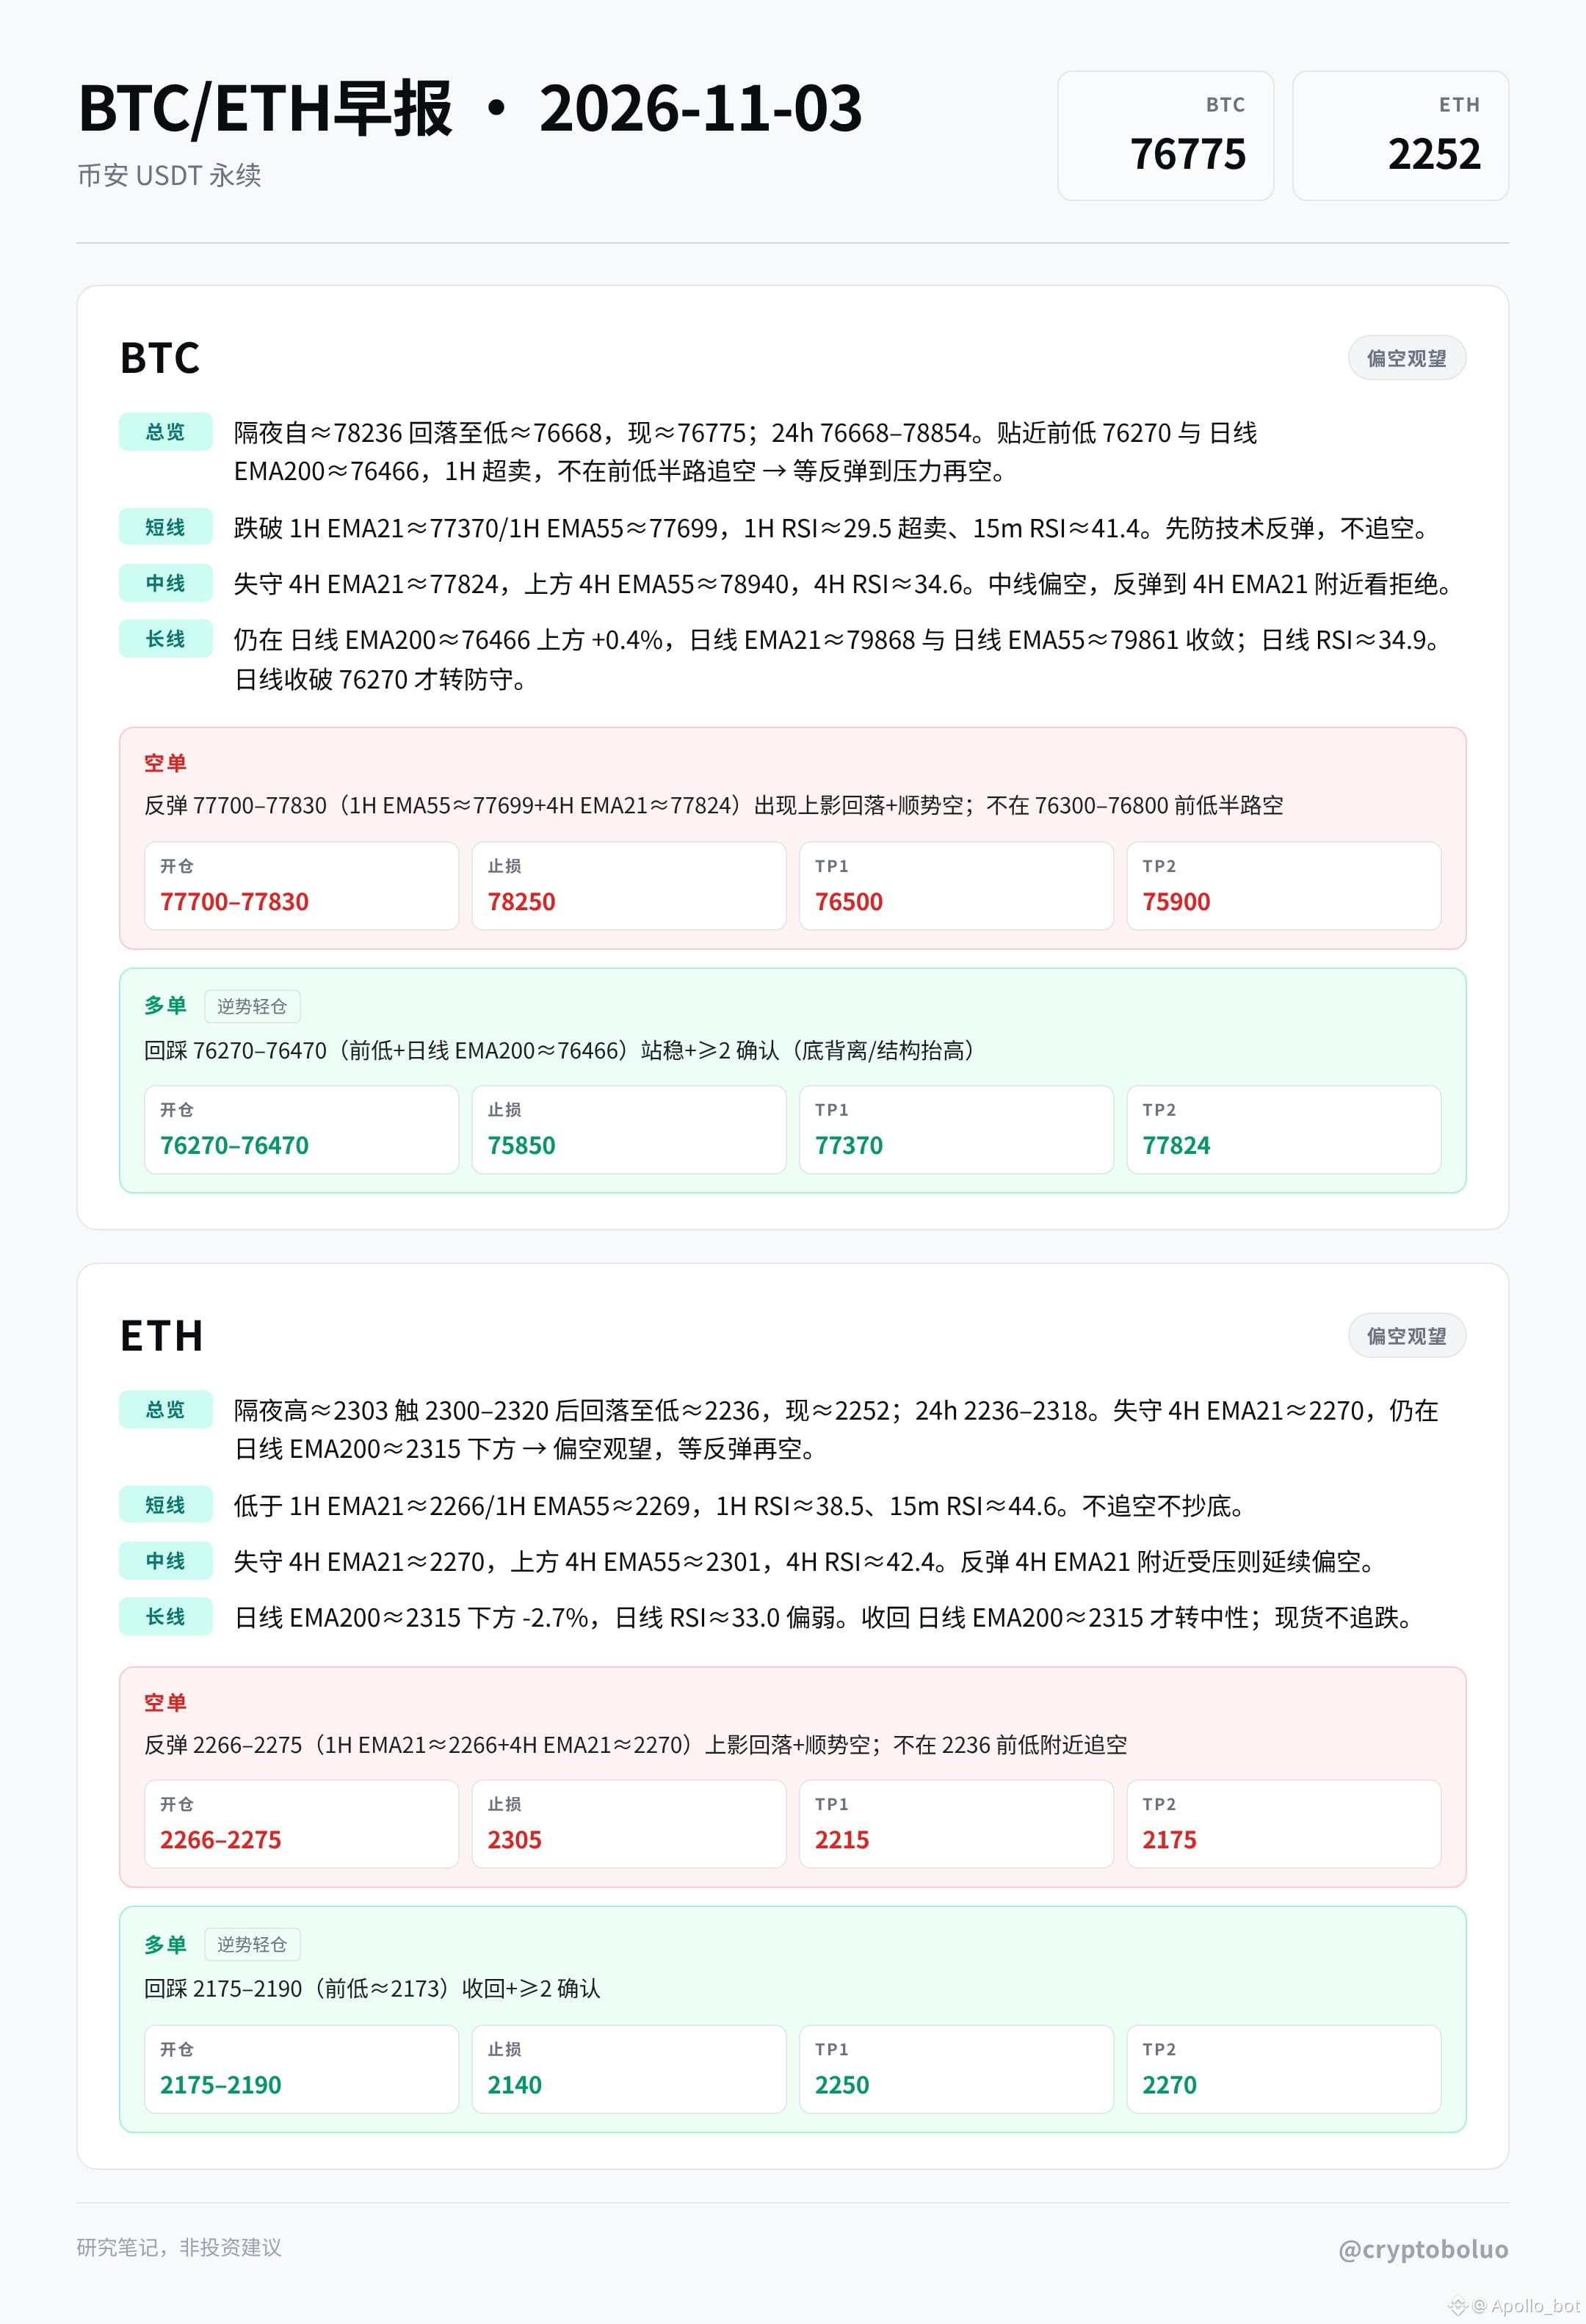
11/3 早报 $BTC≈76775 隔夜回落贴近前低,1H超卖不追空;关键 日线 EMA200≈76466;偏空观望,反弹77700–77830受压再议空。 $ETH≈2252 失守4H EMA21后回落;关键 4H EMA21≈2270;偏空观望,反弹2266–2275受压再议空。 综合偏空观望。研究笔记,非投资建议 @cryptoboluo #BTCUSDT #ETHUSDT
11/3 早报
$BTC ≈76775 隔夜回落贴近前低,1H超卖不追空;关键 日线 EMA200≈76466;偏空观望,反弹77700–77830受压再议空。
$ETH ≈2252 失守4H EMA21后回落;关键 4H EMA21≈2270;偏空观望,反弹2266–2275受压再议空。
综合偏空观望。研究笔记,非投资建议 @cryptoboluo
#BTCUSDT #ETHUSDT
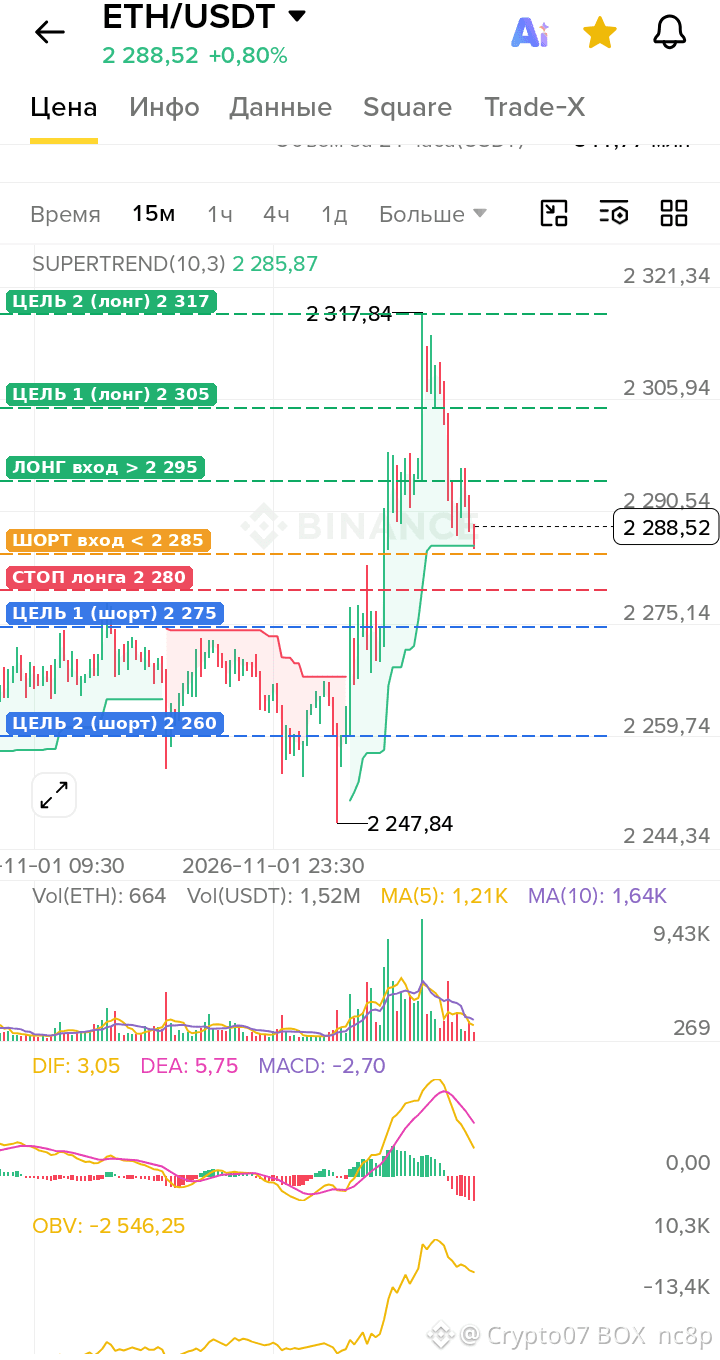
📊 $ETH / USDT: ၁၅ မိနစ်ဇယား သုံးသပ်ချက် ဈေးနှုန်း 2 288 သည် Supertrend မျဉ်း (2 285) ပေါ်တွင် ရှိနေသည်။ ယခုအချိန်တွင် ရှေ့ဆက်မည့် ဦးတည်ချက်ကို ဆုံးဖြတ်နေသည်။ MACD သည် အောက်ဘက်သို့ ပြောင်းသွားပြီး၊ ကုန်သွယ်မှုပမာဏ ကျဆင်းနေသောကြောင့် ဖယောင်းတိုင်ပိတ်ချိန်တွင် အတည်ပြုချက်ရသည်အထိ စောင့်ပါ။ 🟢 ၁၅ မိနစ်ဖယောင်းတိုင်သည် 2 295 အထက်တွင် ပိတ်ပါက LONG ဝင်ရန် 🎯 ရည်မှန်းဈေးများ: 2 305 → 2 317 🛑 Stop loss: 2 280 အောက် 🔴 ၁၅ မိနစ်ဖယောင်းတိုင်သည် 2 285 အောက်တွင် ပိတ်ပါက SHORT ဝင်ရန် 🎯 ရည်မှန်းဈေးများ: 2 275 → 2 260 🛑 Stop loss: 2 296 အထက် ⚠️ ဖယောင်းတိုင်မပိတ်ခင် အလယ်တွင် မဝင်ပါနှင့်၊ ပိတ်သည်အထိ စောင့်ပါ။ အရောင်းအဝယ်တစ်ကြိမ်လျှင် အရင်းအနှီး၏ 1–2% ကိုသာ စွန့်စားပါ။ ဘယ်အခြေအနေက သင့်အတွက် ပိုဖြစ်နိုင်ခြေရှိသလဲ၊ LONG လား SHORT လား။ မှတ်ချက်များတွင် ရေးခဲ့ပါ 👇 #ETH #Ethereum #ETHUSDT #နည်းပညာပိုင်းဆိုင်ရာသုံးသပ်ချက် #Trading
📊 $ETH / USDT: ၁၅ မိနစ်ဇယား သုံးသပ်ချက်
ဈေးနှုန်း 2 288 သည် Supertrend မျဉ်း (2 285) ပေါ်တွင် ရှိနေသည်။ ယခုအချိန်တွင် ရှေ့ဆက်မည့် ဦးတည်ချက်ကို ဆုံးဖြတ်နေသည်။ MACD သည် အောက်ဘက်သို့ ပြောင်းသွားပြီး၊ ကုန်သွယ်မှုပမာဏ ကျဆင်းနေသောကြောင့် ဖယောင်းတိုင်ပိတ်ချိန်တွင် အတည်ပြုချက်ရသည်အထိ စောင့်ပါ။
🟢 ၁၅ မိနစ်ဖယောင်းတိုင်သည် 2 295 အထက်တွင် ပိတ်ပါက LONG ဝင်ရန်
🎯 ရည်မှန်းဈေးများ: 2 305 → 2 317
🛑 Stop loss: 2 280 အောက်
🔴 ၁၅ မိနစ်ဖယောင်းတိုင်သည် 2 285 အောက်တွင် ပိတ်ပါက SHORT ဝင်ရန်
🎯 ရည်မှန်းဈေးများ: 2 275 → 2 260
🛑 Stop loss: 2 296 အထက်
⚠️ ဖယောင်းတိုင်မပိတ်ခင် အလယ်တွင် မဝင်ပါနှင့်၊ ပိတ်သည်အထိ စောင့်ပါ။ အရောင်းအဝယ်တစ်ကြိမ်လျှင် အရင်းအနှီး၏ 1–2% ကိုသာ စွန့်စားပါ။
ဘယ်အခြေအနေက သင့်အတွက် ပိုဖြစ်နိုင်ခြေရှိသလဲ၊ LONG လား SHORT လား။ မှတ်ချက်များတွင် ရေးခဲ့ပါ 👇
#ETH #Ethereum #ETHUSDT #နည်းပညာပိုင်းဆိုင်ရာသုံးသပ်ချက် #Trading
ဘာသာပြန်ဆိုချက် ကြည့်မည်
ETHEREUM: RECOVERY OR REVERSAL? 👀 | The $2,317 Resistance Test! 🚨 $ETH IS AT A TURNING POINT! Ethereum is recovering, but the real test is near $2,317. A breakout could bring fresh bullish momentum. A rejection might send $ETH back toward support. 👀 Bullish comeback or another fake move? What's your prediction? Drop it below! 👇 #Ethereum #ETHUSDT #Crypto #BinanceSquare {future}(ETHUSDT)
ETHEREUM: RECOVERY OR REVERSAL? 👀 | The $2,317 Resistance Test!

🚨 $ETH IS AT A TURNING POINT!

Ethereum is recovering, but the real test is near $2,317.

A breakout could bring fresh bullish momentum. A rejection might send $ETH back toward support.

👀 Bullish comeback or another fake move?

What's your prediction? Drop it below! 👇

#Ethereum #ETHUSDT #Crypto #BinanceSquare
Ethereum Up or Down - November 2, 4PM ET

Ethereum Up or Down - November 2, 4PM ET

99%Up1%Down
ပမာဏ $81,656.79
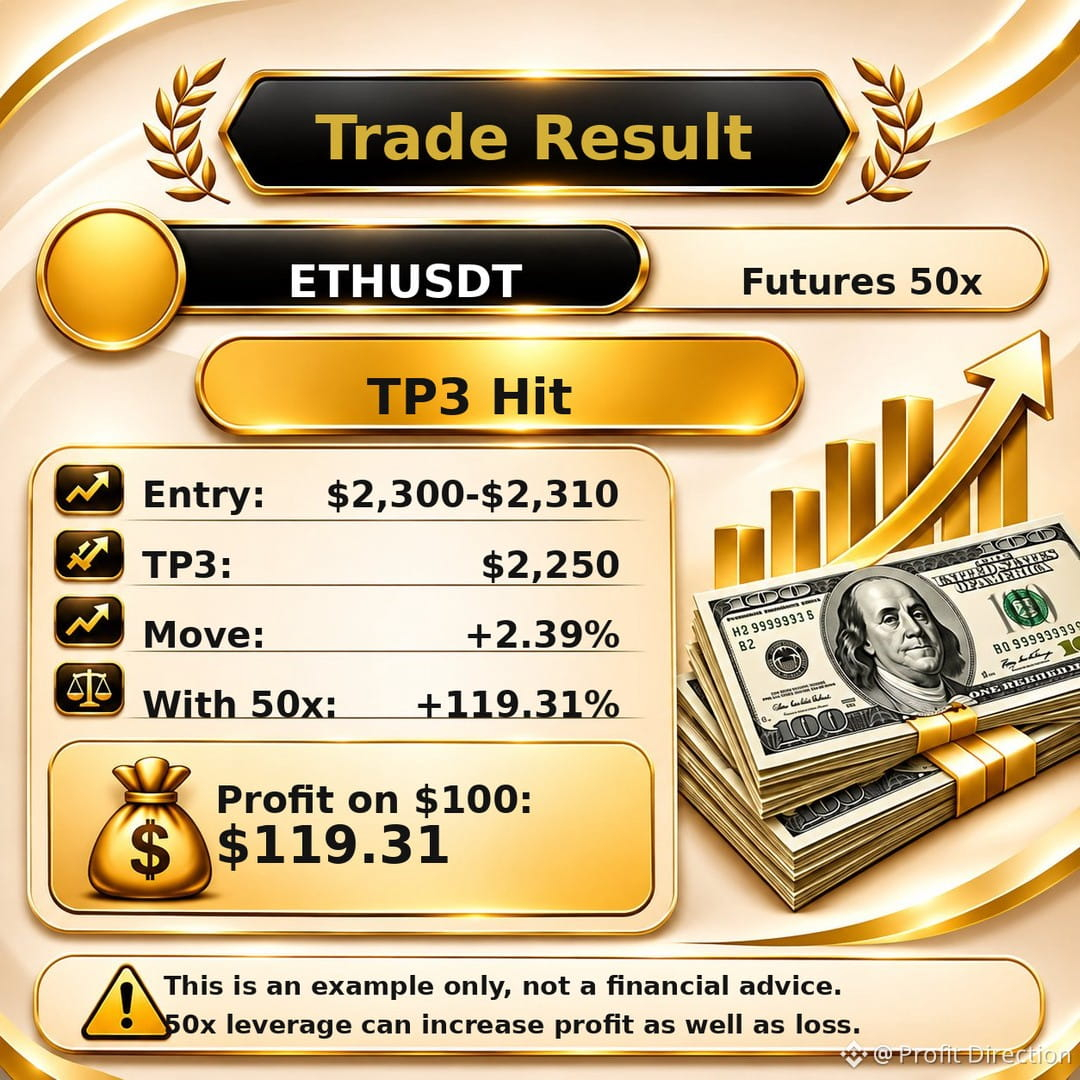
🔴 ETHUSDT — ဖျူးချား အတိုရောင်း — TP3 ထိပြီ! 🎯 ကျွန်ုပ်တို့၏ ETH ခန့်မှန်းချက်သည် TP3 အတွက် မှန်ကန်ကြောင်း သက်သေပြခဲ့ပါပြီ — ဤအရောင်းအဝယ်၏ နောက်ဆုံးပစ်မှတ်ဖြစ်သော ဤအဆင့်အတွက် ခန့်မှန်းချက် အောင်မြင်ခဲ့သည်။ ETHUSDT — ဖျူးချား အတိုရောင်း (1H SCALP) ဝင်ရောက်ဈေး: $2,300–$2,310 (အလယ်ဈေး $2,305) TP3: $2,250 — နိုဝင်ဘာ 2 ရက် UTC 17:45 တွင် ထိခဲ့သည် (1m အနိမ့်ဆုံး $2,247.44) အမြတ်: ဝင်ရောက်ဈေးအလယ်တန်ဖိုးမှ TP3 သို့ ဈေးရွေ့လျားမှုတွင် +2.39% ငွေကြေးဖြင့် ရိုးရိုးရှင်းရှင်း ဥပမာပေးရလျှင် — $100 အရင်းဖြင့် 50x leverage သုံးထားသောအခါ၊ 2.39% ဈေးရွေ့လျားမှုသည် +119.31% ဖြစ်ပြီး၊ $100 အပေါ် အမြတ် $119.31 ရရှိခြင်းဖြစ်သည်။ ဤသည်မှာ ဥပမာသက်သက်သာ ဖြစ်သည် — 50x leverage သည် ဆုံးရှုံးနိုင်ခြေကိုလည်း အလားတူ ပိုမိုမြင့်တက်စေပြီး မည်သူ့အတွက်မျှ အမြတ်အာမခံချက် မဟုတ်ပါ။ ဤမှန်ကန်သော အချက်ပြမှုကို အတည်ပြုရန် ကျွန်ုပ်တို့၏ ယခင်ပို့စ်ကို စစ်ဆေးနိုင်ပါသည်- မူရင်းပို့စ် ID: 383891677034413 https://app.binance.com/uni-qr/cpos/383891677034413?r=DU9Y4GSY&l=en နောက်လိုက်များသည် မှန်ကန်သော အချက်ပြမှုကို အတည်ပြုရန် ယခင်ပို့စ်များကို စစ်ဆေးနိုင်ပါသည်။ ဤအကြောင်းအရာသည် ဤအချက်ပြမှုတစ်ခုနှင့် ဤ TP3 အဆင့်တစ်ခုတည်းအတွက်သာ ဖြစ်သည် — အချက်ပြမှုတိုင်း အနိုင်ရသည်ဟု ဆိုလိုခြင်း မဟုတ်ပါ။ ပစ်မှတ်သုံးခုစလုံးဖြစ်သော TP1 ($2,280), TP2 ($2,265) နှင့် TP3 ($2,250) တို့ ယခု ထိခဲ့ပြီဖြစ်၍ ဤအရောင်းအဝယ် ပြီးဆုံးပါပြီ။ ခွဲခြမ်းစိတ်ဖြာချက်သာ — ငွေကြေးဆိုင်ရာ အကြံဉာဏ် မဟုတ်ပါ (NFA)။ အရောင်းအဝယ်ပြုလုပ်ရာတွင် အန္တရာယ်ရှိပါသည်။ အချက်ပြမှုများ၊ အကောင်းဆုံး အချက်ပြမှုများနှင့် ဈေးကွက်အပ်ဒိတ်များ ပိုမိုရရှိရန် Profit Direction ကို Follow လုပ်ပါ။ သင့်အမြင်ကို မှတ်ချက်များတွင် မျှဝေပါ။ #ETH #ETHUSDT #CryptoTrading #FuturesTrading
🔴 ETHUSDT — ဖျူးချား အတိုရောင်း — TP3 ထိပြီ! 🎯

ကျွန်ုပ်တို့၏ ETH ခန့်မှန်းချက်သည် TP3 အတွက် မှန်ကန်ကြောင်း သက်သေပြခဲ့ပါပြီ — ဤအရောင်းအဝယ်၏ နောက်ဆုံးပစ်မှတ်ဖြစ်သော ဤအဆင့်အတွက် ခန့်မှန်းချက် အောင်မြင်ခဲ့သည်။

ETHUSDT — ဖျူးချား အတိုရောင်း (1H SCALP)
ဝင်ရောက်ဈေး: $2,300–$2,310 (အလယ်ဈေး $2,305)
TP3: $2,250 — နိုဝင်ဘာ 2 ရက် UTC 17:45 တွင် ထိခဲ့သည် (1m အနိမ့်ဆုံး $2,247.44)

အမြတ်: ဝင်ရောက်ဈေးအလယ်တန်ဖိုးမှ TP3 သို့ ဈေးရွေ့လျားမှုတွင် +2.39%

ငွေကြေးဖြင့် ရိုးရိုးရှင်းရှင်း ဥပမာပေးရလျှင် — $100 အရင်းဖြင့် 50x leverage သုံးထားသောအခါ၊ 2.39% ဈေးရွေ့လျားမှုသည် +119.31% ဖြစ်ပြီး၊ $100 အပေါ် အမြတ် $119.31 ရရှိခြင်းဖြစ်သည်။ ဤသည်မှာ ဥပမာသက်သက်သာ ဖြစ်သည် — 50x leverage သည် ဆုံးရှုံးနိုင်ခြေကိုလည်း အလားတူ ပိုမိုမြင့်တက်စေပြီး မည်သူ့အတွက်မျှ အမြတ်အာမခံချက် မဟုတ်ပါ။

ဤမှန်ကန်သော အချက်ပြမှုကို အတည်ပြုရန် ကျွန်ုပ်တို့၏ ယခင်ပို့စ်ကို စစ်ဆေးနိုင်ပါသည်-
မူရင်းပို့စ် ID: 383891677034413
https://app.binance.com/uni-qr/cpos/383891677034413?r=DU9Y4GSY&l=en
နောက်လိုက်များသည် မှန်ကန်သော အချက်ပြမှုကို အတည်ပြုရန် ယခင်ပို့စ်များကို စစ်ဆေးနိုင်ပါသည်။

ဤအကြောင်းအရာသည် ဤအချက်ပြမှုတစ်ခုနှင့် ဤ TP3 အဆင့်တစ်ခုတည်းအတွက်သာ ဖြစ်သည် — အချက်ပြမှုတိုင်း အနိုင်ရသည်ဟု ဆိုလိုခြင်း မဟုတ်ပါ။ ပစ်မှတ်သုံးခုစလုံးဖြစ်သော TP1 ($2,280), TP2 ($2,265) နှင့် TP3 ($2,250) တို့ ယခု ထိခဲ့ပြီဖြစ်၍ ဤအရောင်းအဝယ် ပြီးဆုံးပါပြီ။

ခွဲခြမ်းစိတ်ဖြာချက်သာ — ငွေကြေးဆိုင်ရာ အကြံဉာဏ် မဟုတ်ပါ (NFA)။ အရောင်းအဝယ်ပြုလုပ်ရာတွင် အန္တရာယ်ရှိပါသည်။

အချက်ပြမှုများ၊ အကောင်းဆုံး အချက်ပြမှုများနှင့် ဈေးကွက်အပ်ဒိတ်များ ပိုမိုရရှိရန် Profit Direction ကို Follow လုပ်ပါ။ သင့်အမြင်ကို မှတ်ချက်များတွင် မျှဝေပါ။

#ETH #ETHUSDT #CryptoTrading #FuturesTrading
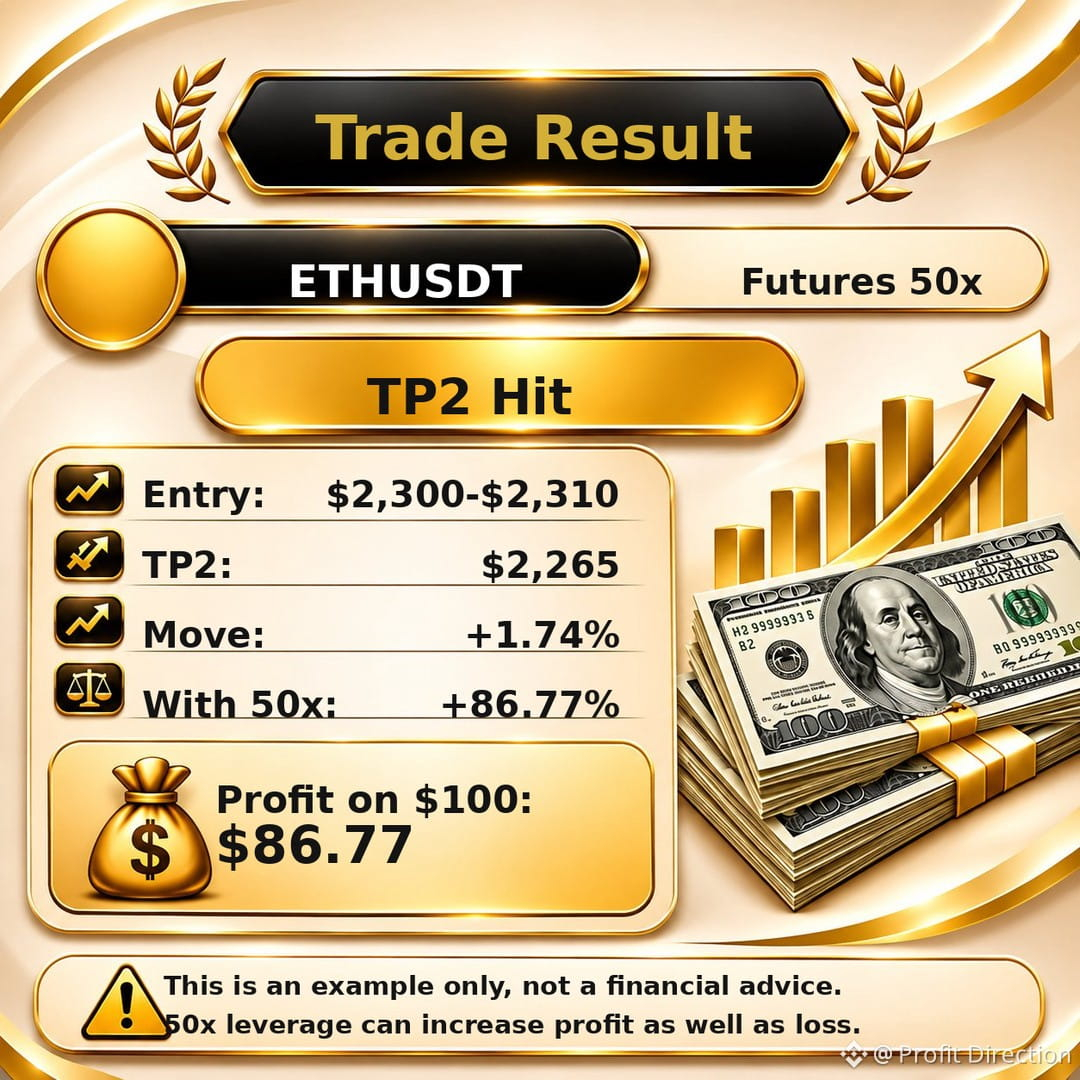
🔴 ETHUSDT — FUTURES SHORT — TP2 ထိမှန်! 🎯 ကျွန်ုပ်တို့၏ ETH ခန့်မှန်းချက်အတိုင်း TP2 ထိမှန်ခဲ့ပါပြီ — ဒီအဆင့်အတွက် ခန့်မှန်းချက် မှန်ကန်ခဲ့ပါတယ်။ ETHUSDT — FUTURES SHORT (1 နာရီ SCALP) ဝင်ဈေး: $2,300–$2,310 (အလယ်ဈေး $2,305) TP2: $2,265 — ထိမှန် အမြတ်: ဝင်ဈေးအလယ်တန်ဖိုးမှ TP2 အထိ ရွေ့လျားမှုအပေါ် +1.74% ဒီရွေ့လျားမှုအတွင်း TP1 ($2,280) ကိုလည်း UTC 15:55 တွင် ရောက်ရှိခဲ့ပြီး၊ နိုဝင်ဘာ 2 ရက် UTC 15:58 တွင် TP2 သို့ ဆက်လက်ရောက်ရှိခဲ့ပါတယ် — ဒီပို့စ်ကတော့ ဒီအတက်အကျတစ်ခုအတွင်း ရောက်ရှိခဲ့တဲ့ အမြင့်ဆုံးအဆင့်ဖြစ်သော TP2 ရလဒ်ကို ဖော်ပြထားတာပါ။ ငွေကြေးပမာဏနဲ့ ရိုးရိုးရှင်းရှင်း ဥပမာပေးရရင်၊ $100 ကို 50x leverage နဲ့ အသုံးပြုတဲ့အခါ 1.74% ရွေ့လျားမှုက +86.77% ဖြစ်ပြီး၊ $100 အပေါ် အမြတ် $86.77 ရရှိတာနဲ့ ညီမျှပါတယ်။ ဒါက ဥပမာသက်သက်သာ ဖြစ်ပါတယ် — 50x leverage က အရှုံးဖြစ်နိုင်ခြေကိုလည်း အလားတူ ပိုမိုမြင့်တက်စေပြီး၊ မည်သူ့အတွက်မျှ အမြတ်ရမယ်လို့ အာမခံထားတာ မဟုတ်ပါဘူး။ ဒီမှန်ကန်တဲ့ signal ကို အတည်ပြုဖို့ ကျွန်ုပ်တို့ရဲ့ အရင်ပို့စ်ကို စစ်ဆေးနိုင်ပါတယ်: မူရင်းပို့စ် ID: 383891677034413 https://app.binance.com/uni-qr/cpos/383891677034413?r=DU9Y4GSY&l=en မှန်ကန်တဲ့ signal ကို အတည်ပြုဖို့ နောက်လိုက်များအနေနဲ့ အရင်ပို့စ်များကို စစ်ဆေးနိုင်ပါတယ်။ ဤသည်မှာ ဒီ signal တစ်ခုနှင့် TP2 အဆင့်တစ်ခုတည်းအကြောင်းသာ ဖြစ်ပြီး signal တိုင်း အနိုင်ရသည်ဟု ဆိုလိုခြင်း မဟုတ်ပါ။ ဒီကုန်သွယ်မှုအတွက် TP3 ($2,250) ကို ဆက်လက်စောင့်ကြည့်နေဆဲဖြစ်ပြီး၊ SL ကို $2,320 (1 နာရီ candle ပိတ်ဈေး အထက်) တွင် သတ်မှတ်ထားပါတယ်။ ခွဲခြမ်းစိတ်ဖြာချက်သာဖြစ်ပြီး — ငွေကြေးဆိုင်ရာ အကြံဉာဏ် မဟုတ်ပါ (NFA)။ ကုန်သွယ်မှုတွင် အန္တရာယ်ရှိပါတယ်။ နောက်ထပ် signal များ၊ အကောင်းဆုံး signal များနှင့် ဈေးကွက်အပ်ဒိတ်များအတွက် Profit Direction ကို Follow လုပ်ပါ။ သင့်အမြင်ကို မှတ်ချက်များတွင် မျှဝေပါ။ #ETH #ETHUSDT #CryptoTrading #FuturesTrading
🔴 ETHUSDT — FUTURES SHORT — TP2 ထိမှန်! 🎯

ကျွန်ုပ်တို့၏ ETH ခန့်မှန်းချက်အတိုင်း TP2 ထိမှန်ခဲ့ပါပြီ — ဒီအဆင့်အတွက် ခန့်မှန်းချက် မှန်ကန်ခဲ့ပါတယ်။

ETHUSDT — FUTURES SHORT (1 နာရီ SCALP)
ဝင်ဈေး: $2,300–$2,310 (အလယ်ဈေး $2,305)
TP2: $2,265 — ထိမှန်
အမြတ်: ဝင်ဈေးအလယ်တန်ဖိုးမှ TP2 အထိ ရွေ့လျားမှုအပေါ် +1.74%

ဒီရွေ့လျားမှုအတွင်း TP1 ($2,280) ကိုလည်း UTC 15:55 တွင် ရောက်ရှိခဲ့ပြီး၊ နိုဝင်ဘာ 2 ရက် UTC 15:58 တွင် TP2 သို့ ဆက်လက်ရောက်ရှိခဲ့ပါတယ် — ဒီပို့စ်ကတော့ ဒီအတက်အကျတစ်ခုအတွင်း ရောက်ရှိခဲ့တဲ့ အမြင့်ဆုံးအဆင့်ဖြစ်သော TP2 ရလဒ်ကို ဖော်ပြထားတာပါ။

ငွေကြေးပမာဏနဲ့ ရိုးရိုးရှင်းရှင်း ဥပမာပေးရရင်၊ $100 ကို 50x leverage နဲ့ အသုံးပြုတဲ့အခါ 1.74% ရွေ့လျားမှုက +86.77% ဖြစ်ပြီး၊ $100 အပေါ် အမြတ် $86.77 ရရှိတာနဲ့ ညီမျှပါတယ်။ ဒါက ဥပမာသက်သက်သာ ဖြစ်ပါတယ် — 50x leverage က အရှုံးဖြစ်နိုင်ခြေကိုလည်း အလားတူ ပိုမိုမြင့်တက်စေပြီး၊ မည်သူ့အတွက်မျှ အမြတ်ရမယ်လို့ အာမခံထားတာ မဟုတ်ပါဘူး။

ဒီမှန်ကန်တဲ့ signal ကို အတည်ပြုဖို့ ကျွန်ုပ်တို့ရဲ့ အရင်ပို့စ်ကို စစ်ဆေးနိုင်ပါတယ်:
မူရင်းပို့စ် ID: 383891677034413
https://app.binance.com/uni-qr/cpos/383891677034413?r=DU9Y4GSY&l=en
မှန်ကန်တဲ့ signal ကို အတည်ပြုဖို့ နောက်လိုက်များအနေနဲ့ အရင်ပို့စ်များကို စစ်ဆေးနိုင်ပါတယ်။

ဤသည်မှာ ဒီ signal တစ်ခုနှင့် TP2 အဆင့်တစ်ခုတည်းအကြောင်းသာ ဖြစ်ပြီး signal တိုင်း အနိုင်ရသည်ဟု ဆိုလိုခြင်း မဟုတ်ပါ။ ဒီကုန်သွယ်မှုအတွက် TP3 ($2,250) ကို ဆက်လက်စောင့်ကြည့်နေဆဲဖြစ်ပြီး၊ SL ကို $2,320 (1 နာရီ candle ပိတ်ဈေး အထက်) တွင် သတ်မှတ်ထားပါတယ်။

ခွဲခြမ်းစိတ်ဖြာချက်သာဖြစ်ပြီး — ငွေကြေးဆိုင်ရာ အကြံဉာဏ် မဟုတ်ပါ (NFA)။ ကုန်သွယ်မှုတွင် အန္တရာယ်ရှိပါတယ်။

နောက်ထပ် signal များ၊ အကောင်းဆုံး signal များနှင့် ဈေးကွက်အပ်ဒိတ်များအတွက် Profit Direction ကို Follow လုပ်ပါ။ သင့်အမြင်ကို မှတ်ချက်များတွင် မျှဝေပါ။

#ETH #ETHUSDT #CryptoTrading #FuturesTrading
ဘာသာပြန်ဆိုချက် ကြည့်မည်
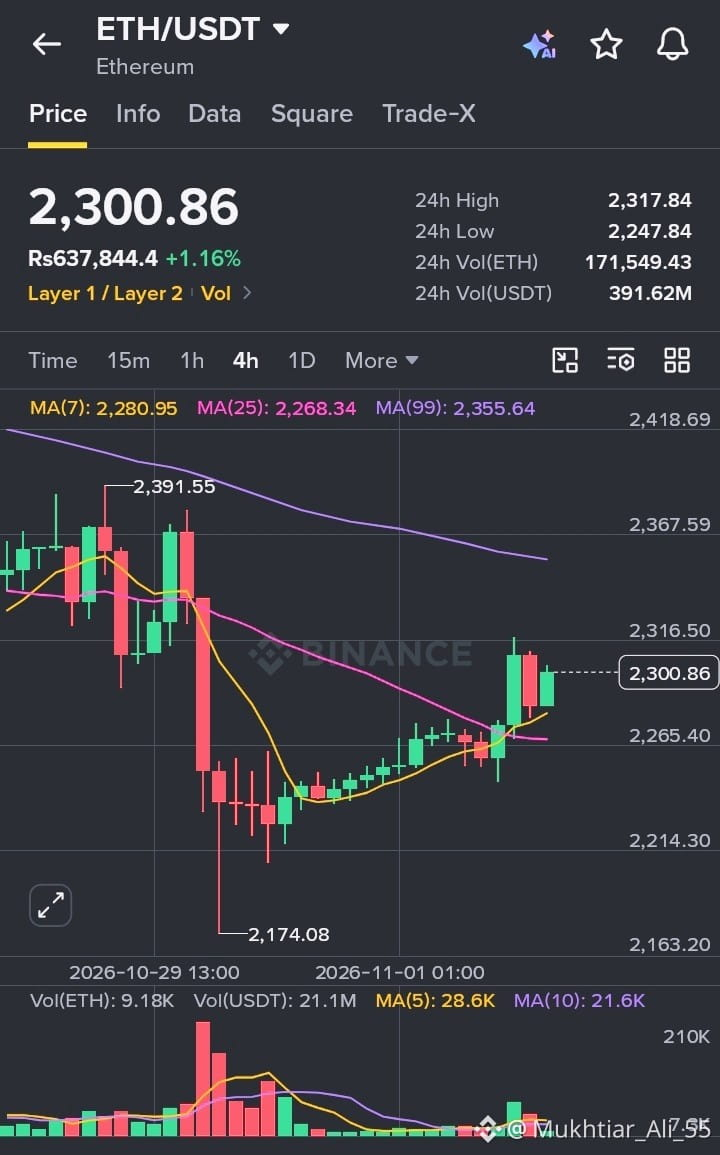
ETH Reclaims $2,300: Bulls Push Above the Short-Term Averages Ethereum is trading at $2,300.86 on the 4H chart, up 1.16% on the day. After the sharp drop from the $2,391 high down to $2,174, ETH has staged a steady recovery and is now outperforming Bitcoin on the session. Price structure: The 24h range sits between $2,247.84 and $2,317.84. The bounce off the $2,174 low has been orderly, with higher lows forming through the recovery. The latest push carried price right up to the top of the daily range, and the current candle is holding just below it. Moving averages: ETH has moved above both the MA(7) at 2,280 and the MA(25) at 2,268, and both are now curling upward. That is a constructive shift in short-term momentum. The MA(99) at 2,355 is still sloping down overhead, so the larger trend has not fully turned yet. Volume: 24h volume is about 171,549 ETH (roughly $391M). Volume during the recovery has been light compared to the heavy selling candles on the way down, though the latest green candle did show a noticeable pickup. I’d like to see that participation continue before calling this a confirmed reversal. What I’m watching: Support: $2,265 to $2,280, where the moving averages sit, followed by the $2,174 swing low Resistance: $2,318, then the $2,355 to $2,390 zone around the MA(99) and the previous high A clean 4H close above $2,318 with expanding volume would be the first real sign that buyers are in control. A slip back below $2,265 would put the recovery on hold. #Ethereum #ETH #CryptoTrading #TechnicalAnalysis #ETHUSDT $ETH {spot}(ETHUSDT)
ETH Reclaims $2,300: Bulls Push Above the Short-Term Averages

Ethereum is trading at $2,300.86 on the 4H chart, up 1.16% on the day. After the sharp drop from the $2,391 high down to $2,174, ETH has staged a steady recovery and is now outperforming Bitcoin on the session.

Price structure: The 24h range sits between $2,247.84 and $2,317.84. The bounce off the $2,174 low has been orderly, with higher lows forming through the recovery. The latest push carried price right up to the top of the daily range, and the current candle is holding just below it.

Moving averages: ETH has moved above both the MA(7) at 2,280 and the MA(25) at 2,268, and both are now curling upward. That is a constructive shift in short-term momentum. The MA(99) at 2,355 is still sloping down overhead, so the larger trend has not fully turned yet.

Volume: 24h volume is about 171,549 ETH (roughly $391M). Volume during the recovery has been light compared to the heavy selling candles on the way down, though the latest green candle did show a noticeable pickup. I’d like to see that participation continue before calling this a confirmed reversal.

What I’m watching:

Support: $2,265 to $2,280, where the moving averages sit, followed by the $2,174 swing low
Resistance: $2,318, then the $2,355 to $2,390 zone around the MA(99) and the previous high

A clean 4H close above $2,318 with expanding volume would be the first real sign that buyers are in control. A slip back below $2,265 would put the recovery on hold.

#Ethereum #ETH #CryptoTrading #TechnicalAnalysis #ETHUSDT

$ETH
ETH ကာလတို ကျဆင်းနိုင်ခြေရှိ 📉၊ 2253 သည် အရေးကြီးသော ကာကွယ်ရေးအဆင့် ပေကျင်းစံတော်ချိန် နိုဝင်ဘာ 2 ရက် မနက်အစောပိုင်းတွင် ETHUSDT အမြဲတမ်းစာချုပ်၏ စျေးကွက်အခြေအနေ snapshot (https://bykaranteli.com/symbols/ETHUSDT) အရ အမှတ်အသားစျေးနှုန်းမှာ 2257.48 ဖြစ်ပြီး၊ 24 နာရီအတွင်း 0.28% တက်ခဲ့သည်။ OI သည် 0.5% တိုးလာပြီး၊ ရန်ပုံငွေကြေးနှုန်းမှာ -0.0001% ဖြစ်သည်။ ပြီးခဲ့သည့် 1 နာရီအတွင်း တက်ကြွသော အဝယ်/အရောင်း အချိုးမှာ 1.04 ဖြစ်ကာ အဝယ်ဘက်၏ အသာစီးမှာ အကန့်အသတ်ရှိသည်။ 24 နာရီအတွင်း အရောင်းအဝယ်ပမာဏမှာ အမေရိကန်ဒေါ်လာ 2.57 ဘီလီယံခန့် ရှိသည် (https://fibonomy.com/en/futures/binance/ethusdt)။ Spot ဈေးကွက်၏ 1 နာရီ RSI သည် 49.5၊ MACD histogram သည် -1.22 ဖြစ်သည် (https://closedcandle.com/coin/eth/indicators)။ ပြန်လည်တက်လာသည့် အရှိန်အဟုန်မှာ အားနည်းနေပြီး၊ အဖွင့်စာချုပ်များ တိုးလာခြင်းက အထက်သို့ ထိုးတက်မည်ဟု အတည်ပြုရန် မလုံလောက်သေးပါ။ လာမည့် 4–24 နာရီအတွင်း 2253 ထောက်ပံ့မှုအဆင့်ကို စမ်းသပ်ရန် ဦးတည်နိုင်သည် (https://makeea.com/markets/ethusdt)။ ထိုအဆင့်ကို ချိုးကျပါက 2244–2237 ကို ကြည့်နိုင်သည်။ ခုခံမှုအဆင့်မှာ 2278 ဖြစ်သည်။ အရောင်းအဝယ်ပမာဏ မြင့်တက်စွာဖြင့် ချိုးကျော်ပြီး ထိုအဆင့်အထက်တွင် တည်မြဲပါက ကာလတိုကျဆင်းမည်ဟူသော သုံးသပ်ချက် ပျက်ပြယ်ပြီး 2305 အထိ တက်နိုင်သည်။ #ETH #ETHUSDT #以太坊 #စျေးကွက်သုံးသပ်ချက်
ETH ကာလတို ကျဆင်းနိုင်ခြေရှိ 📉၊ 2253 သည် အရေးကြီးသော ကာကွယ်ရေးအဆင့်

ပေကျင်းစံတော်ချိန် နိုဝင်ဘာ 2 ရက် မနက်အစောပိုင်းတွင် ETHUSDT အမြဲတမ်းစာချုပ်၏ စျေးကွက်အခြေအနေ snapshot (https://bykaranteli.com/symbols/ETHUSDT) အရ အမှတ်အသားစျေးနှုန်းမှာ 2257.48 ဖြစ်ပြီး၊ 24 နာရီအတွင်း 0.28% တက်ခဲ့သည်။ OI သည် 0.5% တိုးလာပြီး၊ ရန်ပုံငွေကြေးနှုန်းမှာ -0.0001% ဖြစ်သည်။ ပြီးခဲ့သည့် 1 နာရီအတွင်း တက်ကြွသော အဝယ်/အရောင်း အချိုးမှာ 1.04 ဖြစ်ကာ အဝယ်ဘက်၏ အသာစီးမှာ အကန့်အသတ်ရှိသည်။ 24 နာရီအတွင်း အရောင်းအဝယ်ပမာဏမှာ အမေရိကန်ဒေါ်လာ 2.57 ဘီလီယံခန့် ရှိသည် (https://fibonomy.com/en/futures/binance/ethusdt)။

Spot ဈေးကွက်၏ 1 နာရီ RSI သည် 49.5၊ MACD histogram သည် -1.22 ဖြစ်သည် (https://closedcandle.com/coin/eth/indicators)။ ပြန်လည်တက်လာသည့် အရှိန်အဟုန်မှာ အားနည်းနေပြီး၊ အဖွင့်စာချုပ်များ တိုးလာခြင်းက အထက်သို့ ထိုးတက်မည်ဟု အတည်ပြုရန် မလုံလောက်သေးပါ။

လာမည့် 4–24 နာရီအတွင်း 2253 ထောက်ပံ့မှုအဆင့်ကို စမ်းသပ်ရန် ဦးတည်နိုင်သည် (https://makeea.com/markets/ethusdt)။ ထိုအဆင့်ကို ချိုးကျပါက 2244–2237 ကို ကြည့်နိုင်သည်။ ခုခံမှုအဆင့်မှာ 2278 ဖြစ်သည်။ အရောင်းအဝယ်ပမာဏ မြင့်တက်စွာဖြင့် ချိုးကျော်ပြီး ထိုအဆင့်အထက်တွင် တည်မြဲပါက ကာလတိုကျဆင်းမည်ဟူသော သုံးသပ်ချက် ပျက်ပြယ်ပြီး 2305 အထိ တက်နိုင်သည်။

#ETH #ETHUSDT #以太坊 #စျေးကွက်သုံးသပ်ချက်
扛单扫地僧:
2253守不住,短线先别硬多
ဘာသာပြန်ဆိုချက် ကြည့်မည်
ETH ကာလတိုအတွင်း အတက်အကျရှိနေပြီး 2274 သည် အတက်ဘက်သို့ ချိုးဖောက်ရန် အရေးကြီးသောအဆင့် 🔥 နိုဝင်ဘာ 2 ရက် 09:00 (ပေကျင်းစံတော်ချိန်) အများပြည်သူကြည့်ရှုနိုင်သော အချက်အလက်များအရ ETHUSDT သည် 2272 ဝန်းကျင်ရှိပြီး 24 နာရီအတွင်း 0.49% တက်ခဲ့သည်။ အရောင်းအဝယ်တန်ဖိုးမှာ အမေရိကန်ဒေါ်လာ 3.01 ဘီလီယံဖြစ်ပြီး OI သည် 0.2% သာ တိုးခဲ့သဖြင့် အဖွင့်စာချုပ်များ တိုးလာသည့်အားမှာ အကန့်အသတ်ရှိသည်။ စျေးကွက်အခြေအနေ(https://bykaranteli.com/symbols) OI သည် အမေရိကန်ဒေါ်လာ 5.4 ဘီလီယံဝန်းကျင်ရှိသည်။ ရန်ပုံငွေကြေးနှုန်း အနည်းငယ် အနုတ်ဘက်ဖြစ်ပြီး၊ ပြီးခဲ့သည့် 1 နာရီအတွင်း အပြင်းအထန်ဝယ်ယူမှုနှင့် ရောင်းချမှုအချိုးမှာ 1.22 ဖြစ်ကာ ဝယ်ယူသူများဘက်က အသာစီးရနေသည်။ သို့သော် 1 နာရီ RSI သည် 54၊ 4 နာရီ RSI သည် 47 သာရှိသဖြင့် အားကောင်းသော ညီညွတ်လှုပ်ရှားမှု မဖြစ်ပေါ်သေးပါ။ လာမည့် 4–24 နာရီအတွင်း စျေးကွက်သည် အတက်အကျရှိနေမည်ဟု ခန့်မှန်းသည်။ OI(https://bitcoinleverage.com/eth/funding-rate)、ညွှန်းကိန်းများ(https://bykaranteli.com/symbols/ETHUSDT) ထောက်ပံ့မှုအဆင့်များမှာ 2260 နှင့် 2253၊ ခုခံမှုအဆင့်မှာ 2274 ဖြစ်သည်။ 2260–2274 အတွင်း အတက်အကျ ထပ်ခါတလဲလဲဖြစ်နိုင်သည်ဟု ယူဆသည်။ ကုန်သွယ်မှုပမာဏ မြင့်တက်လာပြီး 2274 အထက်တွင် တည်ငြိမ်ပါက 2300 အထိ တက်နိုင်သည်။ 2260 အောက်သို့ ကျဆင်းပါက 2253 နှင့် 2244 ကို ဆက်လက်ကြည့်ရှုရမည်ဖြစ်ပြီး၊ ယင်းအခြေအနေတွင် စျေးနှုန်းအကွာအဝေးအပေါ် ခန့်မှန်းချက် ပျက်ပြယ်မည်။ MACD အတွက် တစ်ပြိုင်နက်တည်းရရှိသော အချက်အလက် မလုံလောက်ပါ။ #ETH #ETHUSDT #以太坊 #စျေးကွက်သုံးသပ်ချက်
ETH ကာလတိုအတွင်း အတက်အကျရှိနေပြီး 2274 သည် အတက်ဘက်သို့ ချိုးဖောက်ရန် အရေးကြီးသောအဆင့် 🔥

နိုဝင်ဘာ 2 ရက် 09:00 (ပေကျင်းစံတော်ချိန်) အများပြည်သူကြည့်ရှုနိုင်သော အချက်အလက်များအရ ETHUSDT သည် 2272 ဝန်းကျင်ရှိပြီး 24 နာရီအတွင်း 0.49% တက်ခဲ့သည်။ အရောင်းအဝယ်တန်ဖိုးမှာ အမေရိကန်ဒေါ်လာ 3.01 ဘီလီယံဖြစ်ပြီး OI သည် 0.2% သာ တိုးခဲ့သဖြင့် အဖွင့်စာချုပ်များ တိုးလာသည့်အားမှာ အကန့်အသတ်ရှိသည်။ စျေးကွက်အခြေအနေ(https://bykaranteli.com/symbols)

OI သည် အမေရိကန်ဒေါ်လာ 5.4 ဘီလီယံဝန်းကျင်ရှိသည်။ ရန်ပုံငွေကြေးနှုန်း အနည်းငယ် အနုတ်ဘက်ဖြစ်ပြီး၊ ပြီးခဲ့သည့် 1 နာရီအတွင်း အပြင်းအထန်ဝယ်ယူမှုနှင့် ရောင်းချမှုအချိုးမှာ 1.22 ဖြစ်ကာ ဝယ်ယူသူများဘက်က အသာစီးရနေသည်။ သို့သော် 1 နာရီ RSI သည် 54၊ 4 နာရီ RSI သည် 47 သာရှိသဖြင့် အားကောင်းသော ညီညွတ်လှုပ်ရှားမှု မဖြစ်ပေါ်သေးပါ။ လာမည့် 4–24 နာရီအတွင်း စျေးကွက်သည် အတက်အကျရှိနေမည်ဟု ခန့်မှန်းသည်။ OI(https://bitcoinleverage.com/eth/funding-rate)、ညွှန်းကိန်းများ(https://bykaranteli.com/symbols/ETHUSDT)

ထောက်ပံ့မှုအဆင့်များမှာ 2260 နှင့် 2253၊ ခုခံမှုအဆင့်မှာ 2274 ဖြစ်သည်။ 2260–2274 အတွင်း အတက်အကျ ထပ်ခါတလဲလဲဖြစ်နိုင်သည်ဟု ယူဆသည်။ ကုန်သွယ်မှုပမာဏ မြင့်တက်လာပြီး 2274 အထက်တွင် တည်ငြိမ်ပါက 2300 အထိ တက်နိုင်သည်။ 2260 အောက်သို့ ကျဆင်းပါက 2253 နှင့် 2244 ကို ဆက်လက်ကြည့်ရှုရမည်ဖြစ်ပြီး၊ ယင်းအခြေအနေတွင် စျေးနှုန်းအကွာအဝေးအပေါ် ခန့်မှန်းချက် ပျက်ပြယ်မည်။ MACD အတွက် တစ်ပြိုင်နက်တည်းရရှိသော အချက်အလက် မလုံလောက်ပါ။

#ETH #ETHUSDT #以太坊 #စျေးကွက်သုံးသပ်ချက်
ဘာသာပြန်ဆိုချက် ကြည့်မည်
🚀 $ETH REBOUND TARGETING 2.34 – RIDE THE 15M BUY SURGE! ⚡ The 15‑minute chart is lighting up with aggressive buying, pushing the price into the 2.273‑2.278 band while the 1‑hour RSI nudges up to 59.8 – a clear sign the bulls are flexing their muscles. 🟢📊 Yet the 4‑hour EMA corridor stays icy, reminding us that any bounce could be fragile. I’m slicing profit at 2.297, 2.314 and 2.340, with a hard stop at 2.236 to keep the horse from tripping again. 💎⚡ 💬 Are you stacking bids on this swing or waiting for a cleaner breakout? 👇 ⚠️ Not financial advice. Always manage your risk. 🛡️ 🏷️ #ETH #LongSetup #ETHUSDT #Crypto 🔥 💎
🚀 $ETH REBOUND TARGETING 2.34 – RIDE THE 15M BUY SURGE! ⚡

The 15‑minute chart is lighting up with aggressive buying, pushing the price into the 2.273‑2.278 band while the 1‑hour RSI nudges up to 59.8 – a clear sign the bulls are flexing their muscles. 🟢📊

Yet the 4‑hour EMA corridor stays icy, reminding us that any bounce could be fragile. I’m slicing profit at 2.297, 2.314 and 2.340, with a hard stop at 2.236 to keep the horse from tripping again. 💎⚡

💬 Are you stacking bids on this swing or waiting for a cleaner breakout? 👇

⚠️ Not financial advice. Always manage your risk. 🛡️

🏷️ #ETH #LongSetup #ETHUSDT #Crypto

🔥 💎
ဘာသာပြန်ဆိုချက် ကြည့်မည်
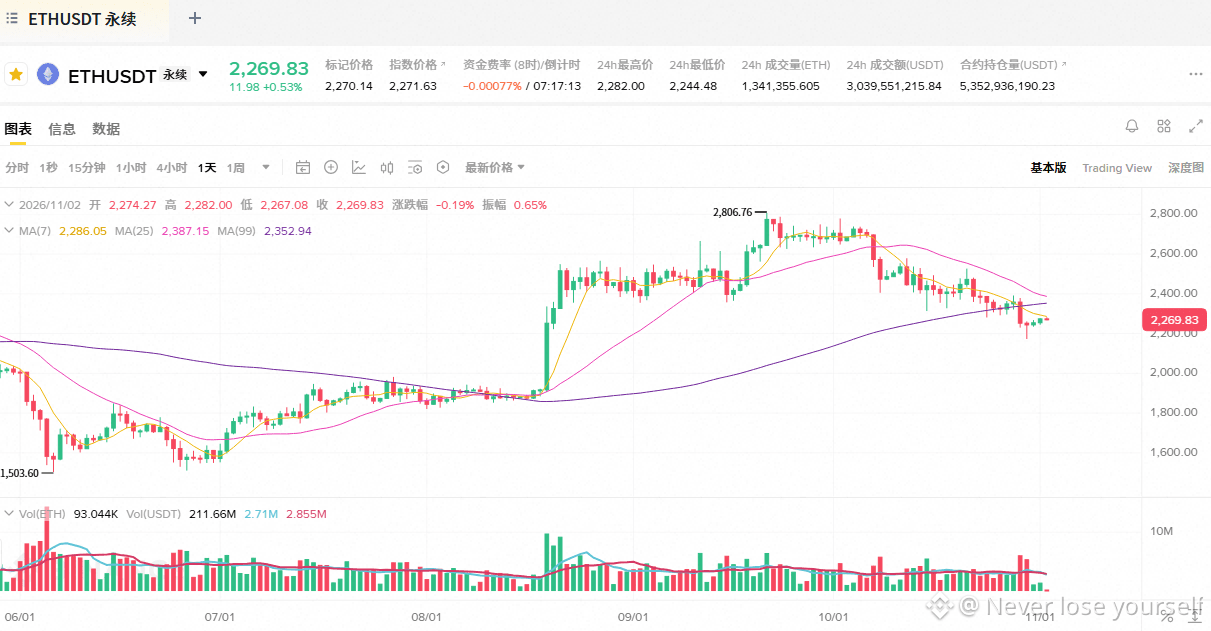
【ETH 复盘:反弹撞进 2,286~2,306 压力带,量能先交了白卷】11.02 一、行情切片 现价 2,269.83,24h +0.53%,盘中最高 2,282。自 10-30 低点 2,172(当日放量 117 亿 USDT 长下影)反弹三日,累计约 +4.5%。 二、压力与量能 上方两重压制:MA7 在 2,286,上周反弹高点 2,306 紧随其后,今天K线顶在前者之下没能再进一步。更值得注意的是量:反弹段 24h 成交约 30 亿,仅为锤子日的 26%——典型的缩量反抽形态,进攻动能不足。 三、下方依据 2,172 是放量锤子确认过的承接位,也是本轮破位后的第一防线;再下 2,100、2,000 整数带。只要 2,172 不破,这段走势仍是"破位后修复"而非"二次破位"。 四、中期结构 MA25(2,387)、MA99(2,353)仍压在价格上方,空头排列未解除,反弹整体定性仍属弱势修复。资金费率 -0.0008% 中性,无杠杆偏向;持仓 53.5 亿稳定。 五、今晚裁决(早 8 点收盘口径) ① 收盘仍被压回 2,306 下方 → 弱反抽确认,回踩看 2,180/2,100; ② 放量收盘站上 2,306 → 修复升级,目标 MA99 2,353、MA25 2,387; ③ 缩量僵在 2,270~2,290 → 方向未定,继续等。 $ETH #ETHUSDT (以上为个人技术分析记录,不构成任何投资建议。市场波动剧烈,请严格控制风险,DYOR) {future}(ETHUSDT)
【ETH 复盘:反弹撞进 2,286~2,306 压力带,量能先交了白卷】11.02
一、行情切片
现价 2,269.83,24h +0.53%,盘中最高 2,282。自 10-30 低点 2,172(当日放量 117 亿 USDT 长下影)反弹三日,累计约 +4.5%。
二、压力与量能
上方两重压制:MA7 在 2,286,上周反弹高点 2,306 紧随其后,今天K线顶在前者之下没能再进一步。更值得注意的是量:反弹段 24h 成交约 30 亿,仅为锤子日的 26%——典型的缩量反抽形态,进攻动能不足。
三、下方依据
2,172 是放量锤子确认过的承接位,也是本轮破位后的第一防线;再下 2,100、2,000 整数带。只要 2,172 不破,这段走势仍是"破位后修复"而非"二次破位"。
四、中期结构
MA25(2,387)、MA99(2,353)仍压在价格上方,空头排列未解除,反弹整体定性仍属弱势修复。资金费率 -0.0008% 中性,无杠杆偏向;持仓 53.5 亿稳定。
五、今晚裁决(早 8 点收盘口径)
① 收盘仍被压回 2,306 下方 → 弱反抽确认,回踩看 2,180/2,100;
② 放量收盘站上 2,306 → 修复升级,目标 MA99 2,353、MA25 2,387;
③ 缩量僵在 2,270~2,290 → 方向未定,继续等。
$ETH #ETHUSDT
(以上为个人技术分析记录,不构成任何投资建议。市场波动剧烈,请严格控制风险,DYOR)
Log in to explore more content
Join global crypto users on Binance Square
⚡️ Get latest and useful information about crypto.
💬 Trusted by the world’s largest crypto exchange.
👍 Discover real insights from verified creators.
အီးမေးလ် / ဖုန်းနံပါတ်