

#chartpatterns
chartpatterns
657,020 views
1,987 Discussing
ရေပန်းစားသော
နောက်ဆုံး

·
--
Article
Pennant Pattern: Explained Simply📘 What is a Pennant?
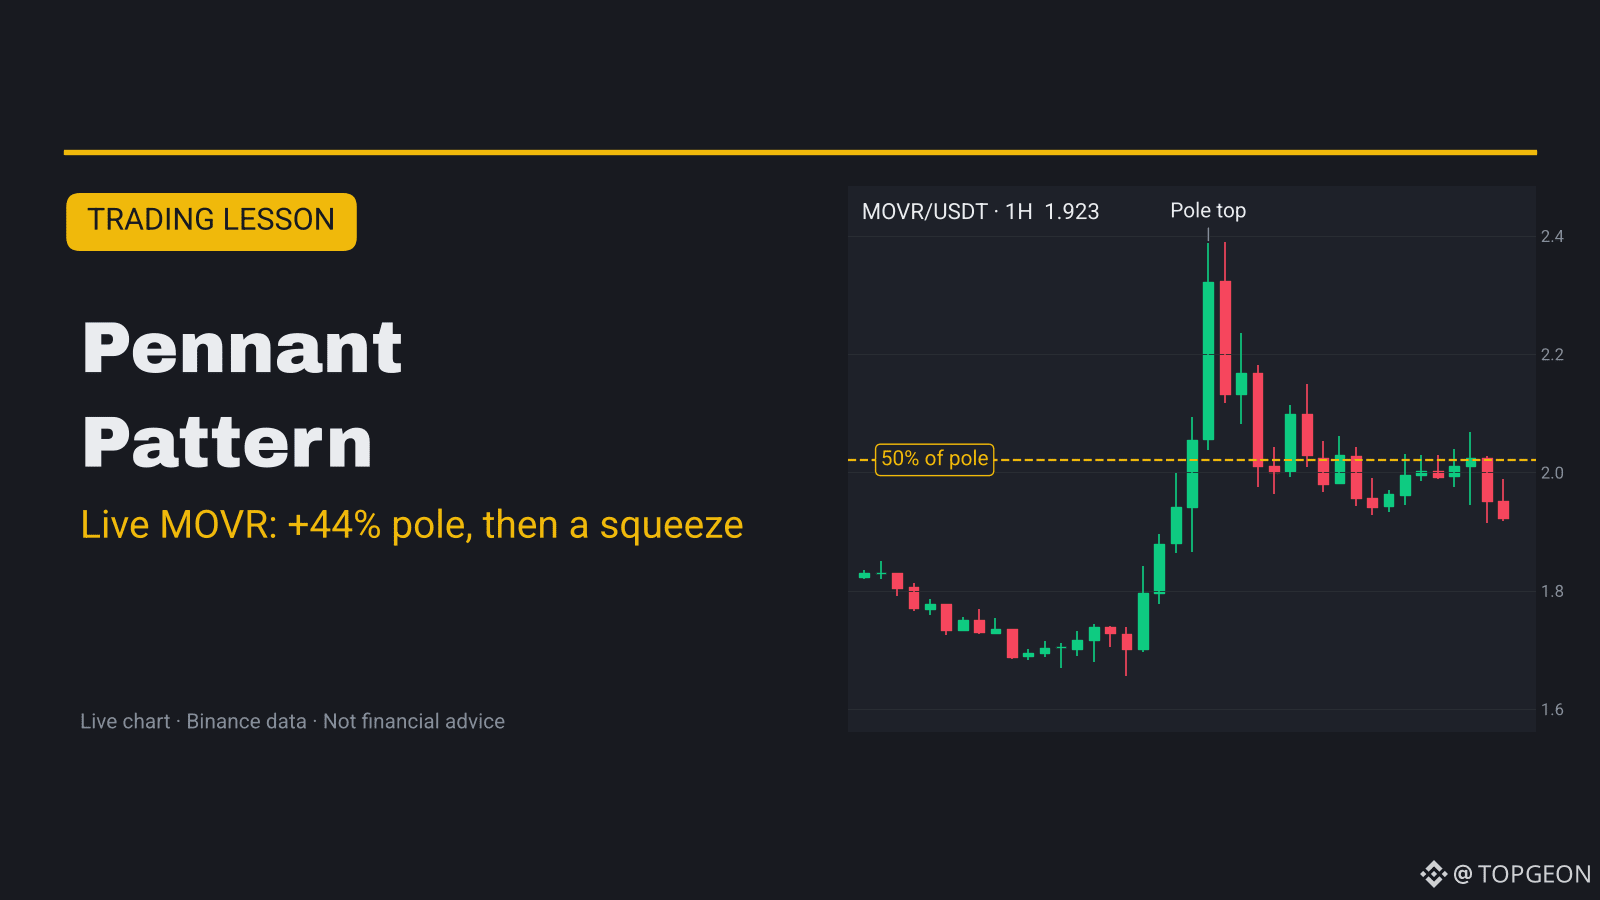
$MOVR jumped 44% in 5 hours yesterday, then started to squeeze into a small triangle. That is exactly how a pennant begins, and it is a great live lesson.
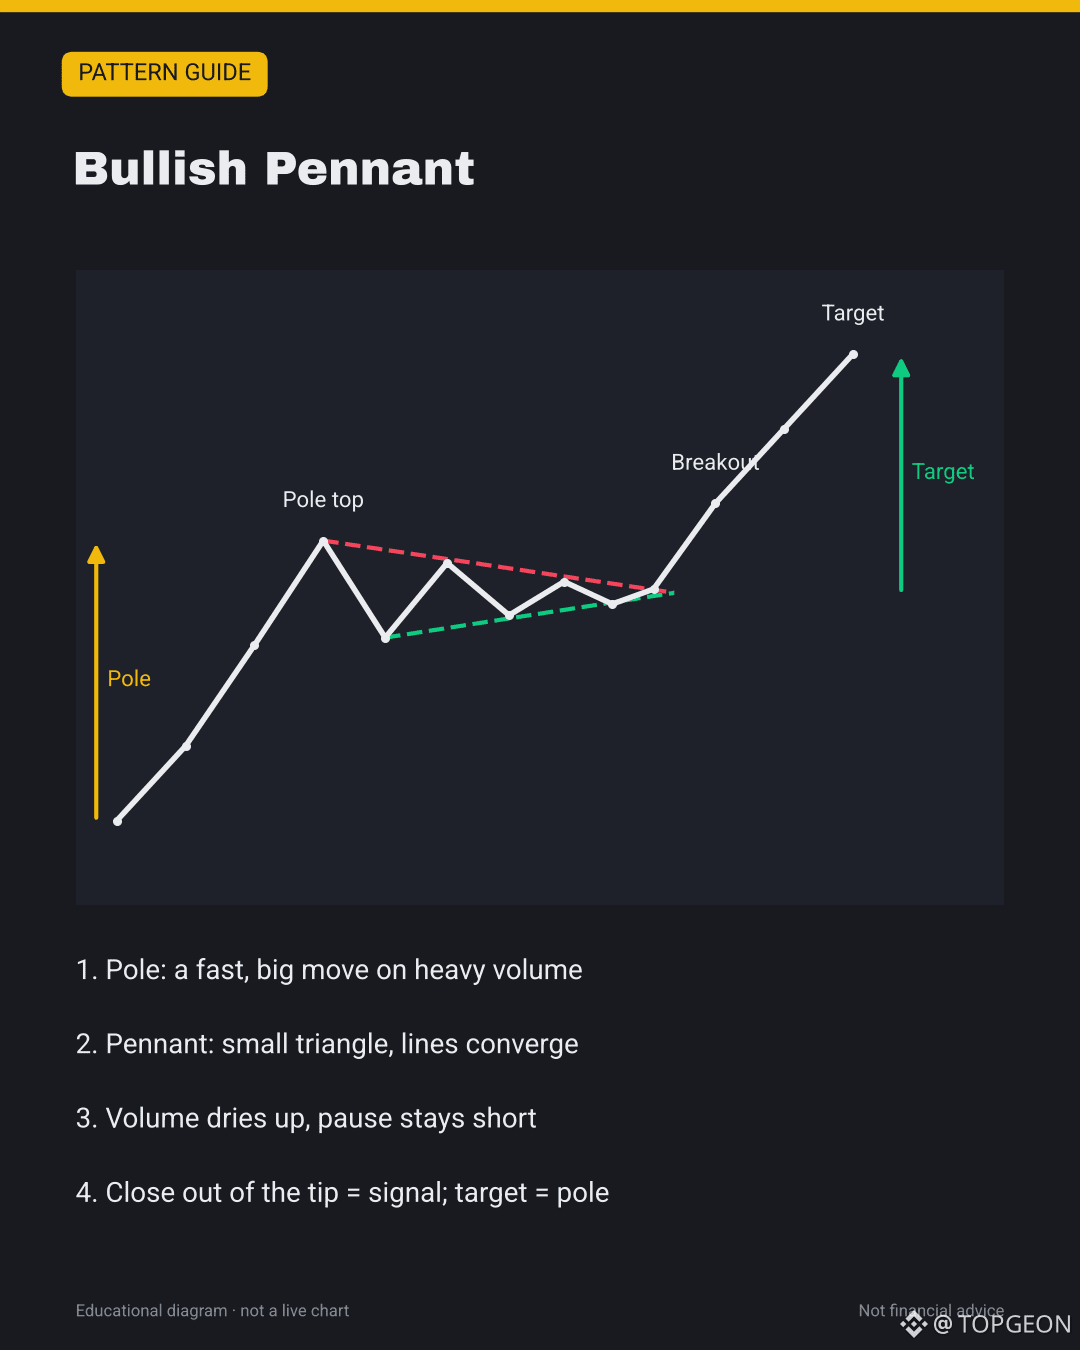
A pennant is a short pause after a very fast move. First comes the "pole": a big, quick candle run on heavy volume. Then price trades in a small triangle where the highs go down and the lows go up. The lines meet at a point, like a little flag on a pole.
• Bullish pennant: fast move up, then a small converging triangle
• Bearish pennant: fast move down, then the same small triangle
• Flag vs pennant: a flag is a tilted channel (parallel lines), a pennant has lines that meet
📊 Live chart in the cover and in the image post below.
🔍 How to spot a pennant
• Find the pole first: a sharp move, much bigger than normal candles
• Draw a line over the falling highs and a line under the rising lows
• The 2 lines should converge into a small, tight triangle
• Volume should fade during the pause
• The pause is short: usually 1–3 weeks on daily charts, hours to a day on 1H
• The pullback should stay shallow, ideally under 50% of the pole
📈 How traders use it
• Entry: on a candle CLOSE out of the triangle in the pole's direction
• Stop-loss: just beyond the other side of the pennant
• Target: measure the pole height and add it to the breakout point
🧪 Live example: MOVR 1H, October 5–6, 2026
The pole:
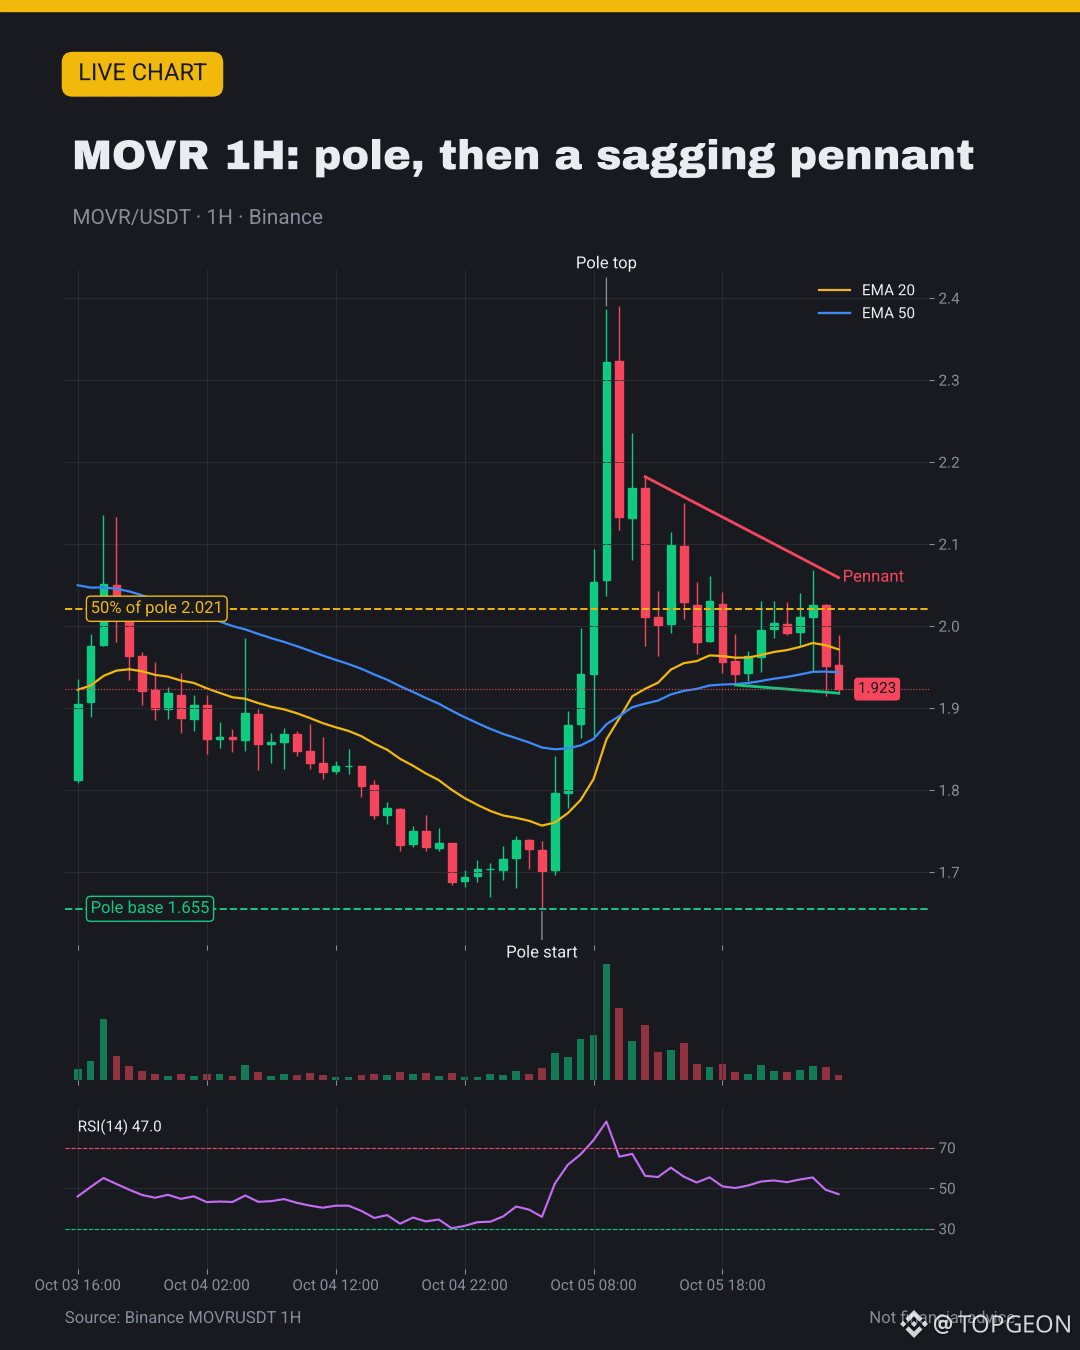
• Oct 5, 04:00 UTC: low at $1.655
• Oct 5, 09:00 UTC: high at $2.387
• About +44% in 5 hours, on the biggest hourly volume on the chart
The pause:
• Highs stepped down: $2.235, $2.182, $2.150, then near $2.06
• Range narrowed from about $0.31 to about $0.15
• Volume faded hour by hour
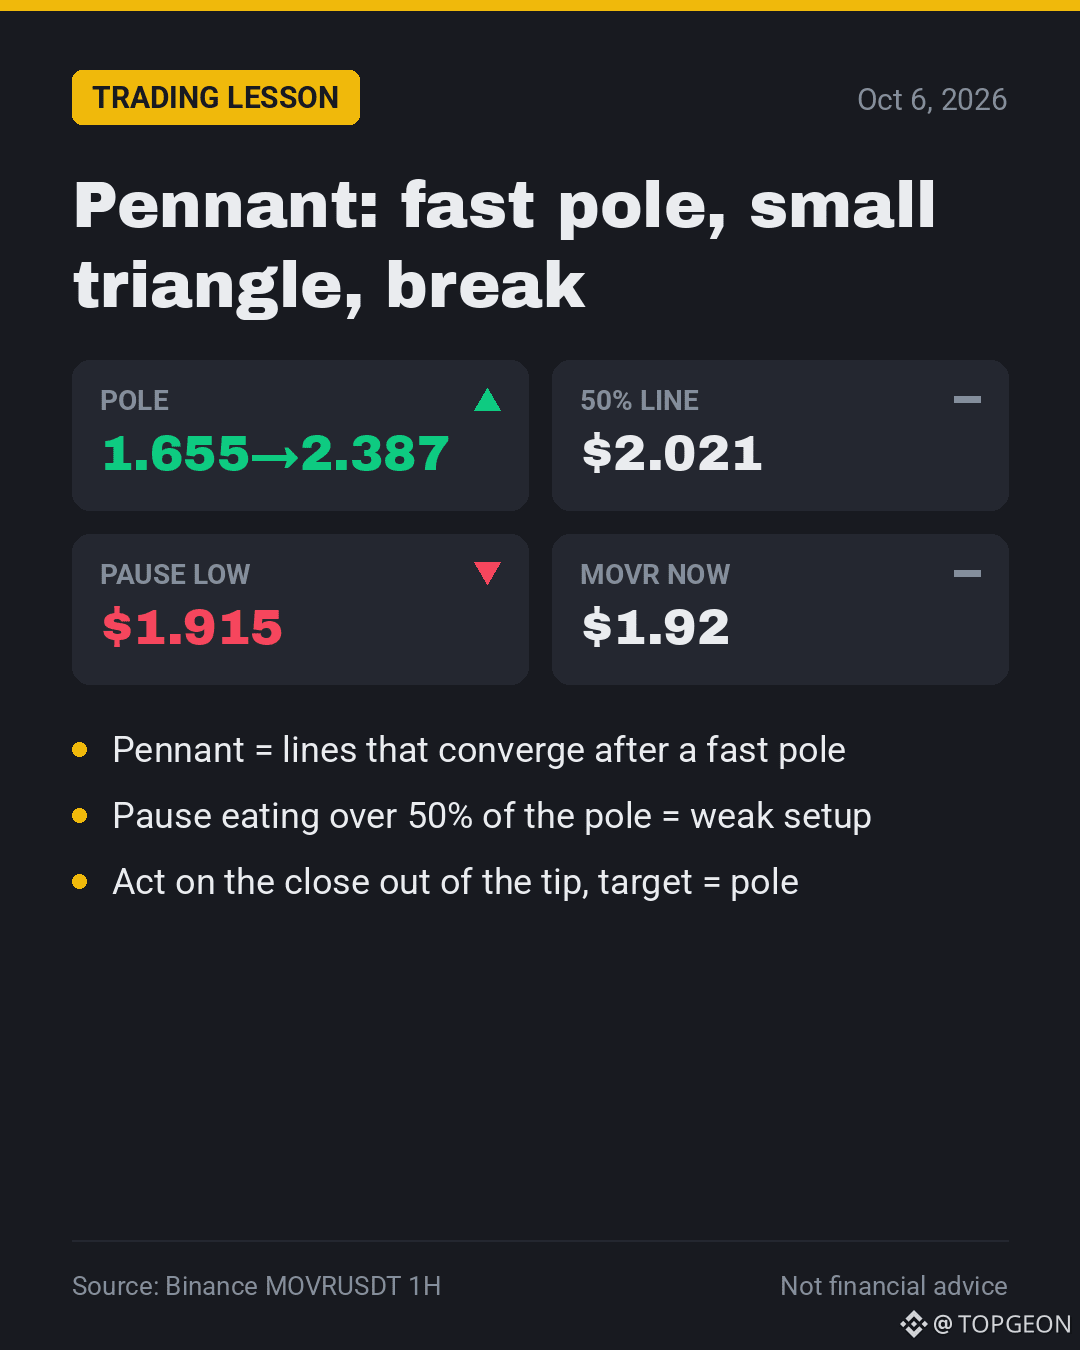
The problem: the lows did not rise. They slid from $1.963 to $1.915. Price now trades near $1.92, so the pause has given back about 63% of the pole. The 50% line is $2.021, and price is below it.
Right now RSI(14) on 1H is 47, with price just under the 20 EMA ($1.97) and near the 50 EMA ($1.94). That is a weak, sagging pennant, not a clean one.
What would need to happen: a 1H close above the upper line (around $2.06) on rising volume. A close under $1.915 would break the structure.
For comparison, $BTC shows no pennant now. Its last push (Oct 5, $84,972 to $86,130) was too slow to count as a pole.
⚠️ Common mistakes
• Calling any small triangle a pennant. No fast pole = just a triangle
• Ignoring depth. A pause that eats more than 50% of the pole is a warning
• Buying inside the pennant before the close out of it
• Waiting too long. If the pause drags on, the pattern loses its power
✅ Quick checklist
• Is there a clear, fast pole on high volume?
• Do the lines converge into a small triangle?
• Did volume fade and the pullback stay under 50%?
• Did a candle close out of the tip, with volume?
• Stop on the other side, target = pole height?
💬 Flag or pennant: which pattern has worked better for you? 👇
Not financial advice. DYOR.
#TradingTips #ChartPatterns #Pennant
Pennant Pattern: Explained Simply
📘 What is a Pennant?
$MOVR jumped 44% in 5 hours yesterday, then started to squeeze into a small triangle. That is exactly how a pennant begins, and it is a great live lesson.
A pennant is a short pause after a very fast move. First comes the "pole": a big, quick candle run on heavy volume. Then price trades in a small triangle where the highs go down and the lows go up. The lines meet at a point, like a little flag on a pole.
• Bullish pennant: fast move up, then a small converging triangle
• Bearish pennant: fast move down, then the same small triangle
• Flag vs pennant: a flag is a tilted channel (parallel lines), a pennant has lines that meet
📊 Live chart in the cover and in the image post below.
🔍 How to spot a pennant
• Find the pole first: a sharp move, much bigger than normal candles
• Draw a line over the falling highs and a line under the rising lows
• The 2 lines should converge into a small, tight triangle
• Volume should fade during the pause
• The pause is short: usually 1–3 weeks on daily charts, hours to a day on 1H
• The pullback should stay shallow, ideally under 50% of the pole
📈 How traders use it
• Entry: on a candle CLOSE out of the triangle in the pole's direction
• Stop-loss: just beyond the other side of the pennant
• Target: measure the pole height and add it to the breakout point
🧪 Live example: MOVR 1H, October 5–6, 2026
The pole:
• Oct 5, 04:00 UTC: low at $1.655
• Oct 5, 09:00 UTC: high at $2.387
• About +44% in 5 hours, on the biggest hourly volume on the chart
The pause:
• Highs stepped down: $2.235, $2.182, $2.150, then near $2.06
• Range narrowed from about $0.31 to about $0.15
• Volume faded hour by hour
The problem: the lows did not rise. They slid from $1.963 to $1.915. Price now trades near $1.92, so the pause has given back about 63% of the pole. The 50% line is $2.021, and price is below it.
Right now RSI(14) on 1H is 47, with price just under the 20 EMA ($1.97) and near the 50 EMA ($1.94). That is a weak, sagging pennant, not a clean one.
What would need to happen: a 1H close above the upper line (around $2.06) on rising volume. A close under $1.915 would break the structure.
For comparison, $BTC shows no pennant now. Its last push (Oct 5, $84,972 to $86,130) was too slow to count as a pole.
⚠️ Common mistakes
• Calling any small triangle a pennant. No fast pole = just a triangle
• Ignoring depth. A pause that eats more than 50% of the pole is a warning
• Buying inside the pennant before the close out of it
• Waiting too long. If the pause drags on, the pattern loses its power
✅ Quick checklist
• Is there a clear, fast pole on high volume?
• Do the lines converge into a small triangle?
• Did volume fade and the pullback stay under 50%?
• Did a candle close out of the tip, with volume?
• Stop on the other side, target = pole height?
💬 Flag or pennant: which pattern has worked better for you? 👇
Not financial advice. DYOR.
#TradingTips #ChartPatterns #Pennant
$MOVR jumped 44% in 5 hours yesterday, then started to squeeze into a small triangle. That is exactly how a pennant begins, and it is a great live lesson.
A pennant is a short pause after a very fast move. First comes the "pole": a big, quick candle run on heavy volume. Then price trades in a small triangle where the highs go down and the lows go up. The lines meet at a point, like a little flag on a pole.
• Bullish pennant: fast move up, then a small converging triangle
• Bearish pennant: fast move down, then the same small triangle
• Flag vs pennant: a flag is a tilted channel (parallel lines), a pennant has lines that meet
📊 Live chart in the cover and in the image post below.
🔍 How to spot a pennant
• Find the pole first: a sharp move, much bigger than normal candles
• Draw a line over the falling highs and a line under the rising lows
• The 2 lines should converge into a small, tight triangle
• Volume should fade during the pause
• The pause is short: usually 1–3 weeks on daily charts, hours to a day on 1H
• The pullback should stay shallow, ideally under 50% of the pole
📈 How traders use it
• Entry: on a candle CLOSE out of the triangle in the pole's direction
• Stop-loss: just beyond the other side of the pennant
• Target: measure the pole height and add it to the breakout point
🧪 Live example: MOVR 1H, October 5–6, 2026
The pole:
• Oct 5, 04:00 UTC: low at $1.655
• Oct 5, 09:00 UTC: high at $2.387
• About +44% in 5 hours, on the biggest hourly volume on the chart
The pause:
• Highs stepped down: $2.235, $2.182, $2.150, then near $2.06
• Range narrowed from about $0.31 to about $0.15
• Volume faded hour by hour
The problem: the lows did not rise. They slid from $1.963 to $1.915. Price now trades near $1.92, so the pause has given back about 63% of the pole. The 50% line is $2.021, and price is below it.
Right now RSI(14) on 1H is 47, with price just under the 20 EMA ($1.97) and near the 50 EMA ($1.94). That is a weak, sagging pennant, not a clean one.
What would need to happen: a 1H close above the upper line (around $2.06) on rising volume. A close under $1.915 would break the structure.
For comparison, $BTC shows no pennant now. Its last push (Oct 5, $84,972 to $86,130) was too slow to count as a pole.
⚠️ Common mistakes
• Calling any small triangle a pennant. No fast pole = just a triangle
• Ignoring depth. A pause that eats more than 50% of the pole is a warning
• Buying inside the pennant before the close out of it
• Waiting too long. If the pause drags on, the pattern loses its power
✅ Quick checklist
• Is there a clear, fast pole on high volume?
• Do the lines converge into a small triangle?
• Did volume fade and the pullback stay under 50%?
• Did a candle close out of the tip, with volume?
• Stop on the other side, target = pole height?
💬 Flag or pennant: which pattern has worked better for you? 👇
Not financial advice. DYOR.
#TradingTips #ChartPatterns #Pennant
275
·
--
🔺 Is $MOVR building a pennant after its +44% pole?
✅ Pole: $1.655 → $2.387 in 5 hours, on huge volume
✅ Highs stepping down, range cut in half, volume fading
⚠️ Lows slid to $1.915: about 63% of the pole given back
⚠️ Below the 50% line ($2.021), so this pennant is weak
🧭 Watch: 1H close above ~$2.06 vs a break under $1.915
💬 Do you trade pennants, or wait for the breakout retest? 👇
📖 Full lesson: https://app.binance.com/uni-qr/cart/374241952463850
#ChartPatterns #Pennant #TradingTips
🔺 Is $MOVR building a pennant after its +44% pole?
✅ Pole: $1.655 → $2.387 in 5 hours, on huge volume
✅ Highs stepping down, range cut in half, volume fading
⚠️ Lows slid to $1.915: about 63% of the pole given back
⚠️ Below the 50% line ($2.021), so this pennant is weak
🧭 Watch: 1H close above ~$2.06 vs a break under $1.915
💬 Do you trade pennants, or wait for the breakout retest? 👇
📖 Full lesson: https://app.binance.com/uni-qr/cart/374241952463850
#ChartPatterns #Pennant #TradingTips
✅ Pole: $1.655 → $2.387 in 5 hours, on huge volume
✅ Highs stepping down, range cut in half, volume fading
⚠️ Lows slid to $1.915: about 63% of the pole given back
⚠️ Below the 50% line ($2.021), so this pennant is weak
🧭 Watch: 1H close above ~$2.06 vs a break under $1.915
💬 Do you trade pennants, or wait for the breakout retest? 👇
📖 Full lesson: https://app.binance.com/uni-qr/cart/374241952463850
#ChartPatterns #Pennant #TradingTips
361

·
--
Article
📊 LEARNING CHART PATTERNS ON THE CHARTA practical guide to recognizing, confirming, and understanding chart patterns.
Learning Chart Patterns on the Chart
If you have ever opened someone else's breakdown, you have probably seen flags, triangles, head and shoulders, and more.
A beginner may think experienced traders know some secret.
No.
They recognize repeating shapes and understand what those shapes can tell us about market behaviour.
In this guide, we'll break down five useful chart patterns, how to confirm them, and where beginners commonly get them wrong.
THEORY
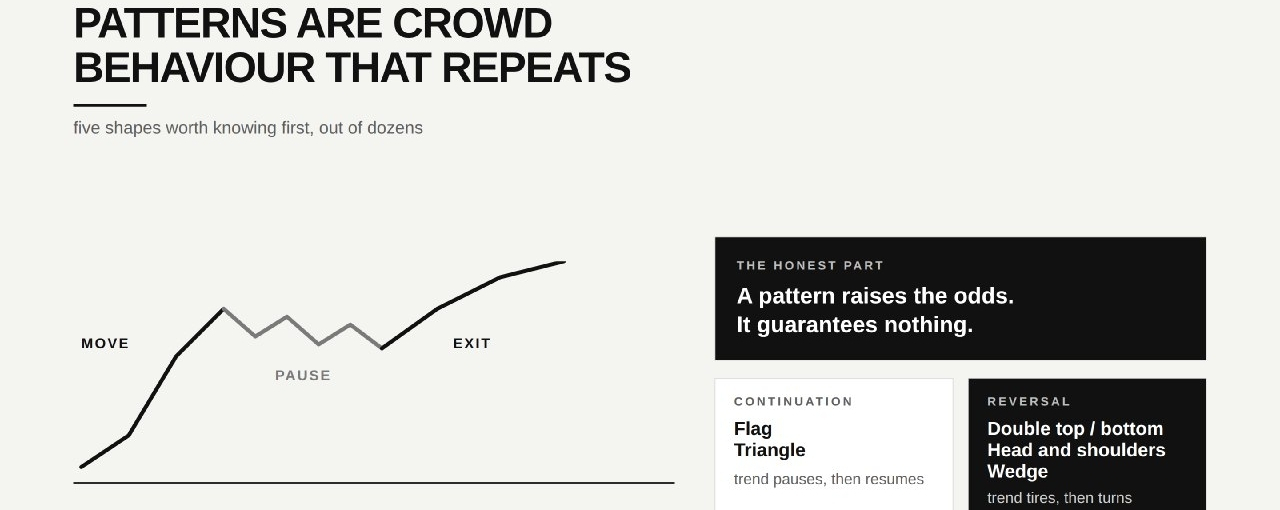
A pattern is a repeating form of crowd behaviour on the chart.
Most patterns can be understood through:
A MOVE → A PAUSE → A BREAKOUT
During the pause, buyers and sellers fight over price. The resulting shape can hint at which side is gaining strength.
A pattern raises the odds. It guarantees nothing.
The two main categories are:
Continuation Patterns
The current trend pauses and may continue.
Reversal Patterns
The existing trend loses momentum and may reverse.
THE FLAG
A flag starts with a sharp move known as the flagpole, followed by a short consolidation forming a small channel against the original trend.
After the pause, price may break out and continue in the original direction.
After a strong impulse, some traders take profits and price pulls back, but sellers may not have enough strength to reverse the market.
Volume inside the flag usually fades, while breakout volume can expand.
A bearish flag is the same structure in reverse: sharp drop → upward-sloping channel → potential continuation lower.
THE TRIANGLE
A triangle forms when price gets squeezed between two converging lines.
Ascending Triangle
Flat resistance + rising lows. Buyers repeatedly test the same level.
Descending Triangle
Flat support + falling highs. Sellers repeatedly pressure the same floor.
Symmetrical Triangle
Both trendlines converge, leaving the breakout direction to decide the next move.
Volume often decreases inside the triangle and increases when price breaks out.
DOUBLE TOP & DOUBLE BOTTOM
The idea is simple:
Two failed attempts to break the same level.
Double Top
Price reaches a high twice and fails both times. The dip between them creates the neckline.
A close below the neckline can confirm a bearish reversal.
Double Bottom
Price tests the same low twice and sellers fail to break it.
A close above the neckline can confirm a bullish reversal.
HEAD & SHOULDERS
The classic structure has three peaks:
LEFT SHOULDER → HEAD → RIGHT SHOULDER
The middle peak is the highest.
If buyers cannot push the right shoulder toward the head, bullish strength may be fading.
The neckline connects the lows beneath the structure.
A close below the neckline, preferably with increasing volume, strengthens the bearish confirmation.
The inverse Head and Shoulders can appear at market bottoms and signal a potential reversal upward.
THE WEDGE
A wedge forms when both trendlines slope in the same direction while gradually converging.
Rising Wedge
Price makes higher highs, but momentum weakens. It most often warns of a potential drop.
Falling Wedge
Price makes lower lows, but selling pressure fades. It most often signals a potential rally.
The interesting part is that a wedge can look like continuation while actually warning that the trend is becoming tired.
HOW TO CONFIRM A PATTERN
Until a pattern is confirmed, it's just a drawing on the chart.
Candle Close
A wick beyond the level isn't enough. Look for the candle body to close beyond the pattern line.
Volume
A breakout with stronger participation is generally more convincing. Weak-volume breakouts can reverse.
Retest
After breaking out, price may return to test the broken level from the other side.
Resistance → Breakout → Retest → Support
If the level holds, confirmation becomes stronger.
WHERE BEGINNERS MESS UP
False Breakouts
Crypto can push through a pattern line with a wick, trigger traders, and immediately reverse. Don't enter on the first poke.
Patterns Everywhere
Once you learn patterns, every chart can start looking like one. 😂
If you have to hunt for the formation, it probably isn't clear enough.
Lower Timeframe vs Higher Timeframe
A bullish hourly flag inside a strong daily downtrend may simply be a temporary move against the bigger trend.
Always check:
Higher timeframe → Market direction → Lower timeframe setup
WHAT TO STUDY NEXT
These five patterns are only the starting point.
Other formations include:
Pennants
Rectangles
Cup and HandleTriple Tops
Triple Bottoms
Broadening Formations
Recommended Study
📚 Thomas Bulkowski — Encyclopedia of Chart Patterns
A major reference with statistics on historical pattern performance.
📚 John Murphy — Technical Analysis of the Financial Markets
A classic technical-analysis resource covering chart patterns and market behaviour.
📚 Robert Edwards & John Magee — Technical Analysis of Stock Trends
A foundational work in traditional technical analysis, first published in 1948.
📚 BabyPips — School of Pipsology
A free, beginner-friendly resource for technical analysis.
FINAL THOUGHT
Theory without practice fades fast.
Study the pattern.
Find it on old charts.
Watch it form live.
Learn how it behaves.
Don't trade a pattern just because you can name it. Wait for confirmation.
And if you made it all the way here:
You're definitely not dumb. 😂📊
🔥 CHAINBALLER
Learn the chart. Understand the crowd. Wait for confirmation.
#ChainBaller #TradingEducation #ChartPatterns
$RLC $ZEC $SAND
📊 LEARNING CHART PATTERNS ON THE CHART
A practical guide to recognizing, confirming, and understanding chart patterns.
Learning Chart Patterns on the Chart
If you have ever opened someone else's breakdown, you have probably seen flags, triangles, head and shoulders, and more.
A beginner may think experienced traders know some secret.
No.
They recognize repeating shapes and understand what those shapes can tell us about market behaviour.
In this guide, we'll break down five useful chart patterns, how to confirm them, and where beginners commonly get them wrong.
THEORY
A pattern is a repeating form of crowd behaviour on the chart.
Most patterns can be understood through:
A MOVE → A PAUSE → A BREAKOUT
During the pause, buyers and sellers fight over price. The resulting shape can hint at which side is gaining strength.
A pattern raises the odds. It guarantees nothing.
The two main categories are:
Continuation Patterns
The current trend pauses and may continue.
Reversal Patterns
The existing trend loses momentum and may reverse.
THE FLAG
A flag starts with a sharp move known as the flagpole, followed by a short consolidation forming a small channel against the original trend.
After the pause, price may break out and continue in the original direction.
After a strong impulse, some traders take profits and price pulls back, but sellers may not have enough strength to reverse the market.
Volume inside the flag usually fades, while breakout volume can expand.
A bearish flag is the same structure in reverse: sharp drop → upward-sloping channel → potential continuation lower.
THE TRIANGLE
A triangle forms when price gets squeezed between two converging lines.
Ascending Triangle
Flat resistance + rising lows. Buyers repeatedly test the same level.
Descending Triangle
Flat support + falling highs. Sellers repeatedly pressure the same floor.
Symmetrical Triangle
Both trendlines converge, leaving the breakout direction to decide the next move.
Volume often decreases inside the triangle and increases when price breaks out.
DOUBLE TOP & DOUBLE BOTTOM
The idea is simple:
Two failed attempts to break the same level.
Double Top
Price reaches a high twice and fails both times. The dip between them creates the neckline.
A close below the neckline can confirm a bearish reversal.
Double Bottom
Price tests the same low twice and sellers fail to break it.
A close above the neckline can confirm a bullish reversal.
HEAD & SHOULDERS
The classic structure has three peaks:
LEFT SHOULDER → HEAD → RIGHT SHOULDER
The middle peak is the highest.
If buyers cannot push the right shoulder toward the head, bullish strength may be fading.
The neckline connects the lows beneath the structure.
A close below the neckline, preferably with increasing volume, strengthens the bearish confirmation.
The inverse Head and Shoulders can appear at market bottoms and signal a potential reversal upward.
THE WEDGE
A wedge forms when both trendlines slope in the same direction while gradually converging.
Rising Wedge
Price makes higher highs, but momentum weakens. It most often warns of a potential drop.
Falling Wedge
Price makes lower lows, but selling pressure fades. It most often signals a potential rally.
The interesting part is that a wedge can look like continuation while actually warning that the trend is becoming tired.
HOW TO CONFIRM A PATTERN
Until a pattern is confirmed, it's just a drawing on the chart.
Candle Close
A wick beyond the level isn't enough. Look for the candle body to close beyond the pattern line.
Volume
A breakout with stronger participation is generally more convincing. Weak-volume breakouts can reverse.
Retest
After breaking out, price may return to test the broken level from the other side.
Resistance → Breakout → Retest → Support
If the level holds, confirmation becomes stronger.
WHERE BEGINNERS MESS UP
False Breakouts
Crypto can push through a pattern line with a wick, trigger traders, and immediately reverse. Don't enter on the first poke.
Patterns Everywhere
Once you learn patterns, every chart can start looking like one. 😂
If you have to hunt for the formation, it probably isn't clear enough.
Lower Timeframe vs Higher Timeframe
A bullish hourly flag inside a strong daily downtrend may simply be a temporary move against the bigger trend.
Always check:
Higher timeframe → Market direction → Lower timeframe setup
WHAT TO STUDY NEXT
These five patterns are only the starting point.
Other formations include:
Pennants
Rectangles
Cup and HandleTriple Tops
Triple Bottoms
Broadening Formations
Recommended Study
📚 Thomas Bulkowski — Encyclopedia of Chart Patterns
A major reference with statistics on historical pattern performance.
📚 John Murphy — Technical Analysis of the Financial Markets
A classic technical-analysis resource covering chart patterns and market behaviour.
📚 Robert Edwards & John Magee — Technical Analysis of Stock Trends
A foundational work in traditional technical analysis, first published in 1948.
📚 BabyPips — School of Pipsology
A free, beginner-friendly resource for technical analysis.
FINAL THOUGHT
Theory without practice fades fast.
Study the pattern.
Find it on old charts.
Watch it form live.
Learn how it behaves.
Don't trade a pattern just because you can name it. Wait for confirmation.
And if you made it all the way here:
You're definitely not dumb. 😂📊
🔥 CHAINBALLER
Learn the chart. Understand the crowd. Wait for confirmation.
#ChainBaller #TradingEducation #ChartPatterns
$RLC $ZEC $SAND
Learning Chart Patterns on the Chart
If you have ever opened someone else's breakdown, you have probably seen flags, triangles, head and shoulders, and more.
A beginner may think experienced traders know some secret.
No.
They recognize repeating shapes and understand what those shapes can tell us about market behaviour.
In this guide, we'll break down five useful chart patterns, how to confirm them, and where beginners commonly get them wrong.
THEORY
A pattern is a repeating form of crowd behaviour on the chart.
Most patterns can be understood through:
A MOVE → A PAUSE → A BREAKOUT
During the pause, buyers and sellers fight over price. The resulting shape can hint at which side is gaining strength.
A pattern raises the odds. It guarantees nothing.
The two main categories are:
Continuation Patterns
The current trend pauses and may continue.
Reversal Patterns
The existing trend loses momentum and may reverse.
THE FLAG
A flag starts with a sharp move known as the flagpole, followed by a short consolidation forming a small channel against the original trend.
After the pause, price may break out and continue in the original direction.
After a strong impulse, some traders take profits and price pulls back, but sellers may not have enough strength to reverse the market.
Volume inside the flag usually fades, while breakout volume can expand.
A bearish flag is the same structure in reverse: sharp drop → upward-sloping channel → potential continuation lower.
THE TRIANGLE
A triangle forms when price gets squeezed between two converging lines.
Ascending Triangle
Flat resistance + rising lows. Buyers repeatedly test the same level.
Descending Triangle
Flat support + falling highs. Sellers repeatedly pressure the same floor.
Symmetrical Triangle
Both trendlines converge, leaving the breakout direction to decide the next move.
Volume often decreases inside the triangle and increases when price breaks out.
DOUBLE TOP & DOUBLE BOTTOM
The idea is simple:
Two failed attempts to break the same level.
Double Top
Price reaches a high twice and fails both times. The dip between them creates the neckline.
A close below the neckline can confirm a bearish reversal.
Double Bottom
Price tests the same low twice and sellers fail to break it.
A close above the neckline can confirm a bullish reversal.
HEAD & SHOULDERS
The classic structure has three peaks:
LEFT SHOULDER → HEAD → RIGHT SHOULDER
The middle peak is the highest.
If buyers cannot push the right shoulder toward the head, bullish strength may be fading.
The neckline connects the lows beneath the structure.
A close below the neckline, preferably with increasing volume, strengthens the bearish confirmation.
The inverse Head and Shoulders can appear at market bottoms and signal a potential reversal upward.
THE WEDGE
A wedge forms when both trendlines slope in the same direction while gradually converging.
Rising Wedge
Price makes higher highs, but momentum weakens. It most often warns of a potential drop.
Falling Wedge
Price makes lower lows, but selling pressure fades. It most often signals a potential rally.
The interesting part is that a wedge can look like continuation while actually warning that the trend is becoming tired.
HOW TO CONFIRM A PATTERN
Until a pattern is confirmed, it's just a drawing on the chart.
Candle Close
A wick beyond the level isn't enough. Look for the candle body to close beyond the pattern line.
Volume
A breakout with stronger participation is generally more convincing. Weak-volume breakouts can reverse.
Retest
After breaking out, price may return to test the broken level from the other side.
Resistance → Breakout → Retest → Support
If the level holds, confirmation becomes stronger.
WHERE BEGINNERS MESS UP
False Breakouts
Crypto can push through a pattern line with a wick, trigger traders, and immediately reverse. Don't enter on the first poke.
Patterns Everywhere
Once you learn patterns, every chart can start looking like one. 😂
If you have to hunt for the formation, it probably isn't clear enough.
Lower Timeframe vs Higher Timeframe
A bullish hourly flag inside a strong daily downtrend may simply be a temporary move against the bigger trend.
Always check:
Higher timeframe → Market direction → Lower timeframe setup
WHAT TO STUDY NEXT
These five patterns are only the starting point.
Other formations include:
Pennants
Rectangles
Cup and HandleTriple Tops
Triple Bottoms
Broadening Formations
Recommended Study
📚 Thomas Bulkowski — Encyclopedia of Chart Patterns
A major reference with statistics on historical pattern performance.
📚 John Murphy — Technical Analysis of the Financial Markets
A classic technical-analysis resource covering chart patterns and market behaviour.
📚 Robert Edwards & John Magee — Technical Analysis of Stock Trends
A foundational work in traditional technical analysis, first published in 1948.
📚 BabyPips — School of Pipsology
A free, beginner-friendly resource for technical analysis.
FINAL THOUGHT
Theory without practice fades fast.
Study the pattern.
Find it on old charts.
Watch it form live.
Learn how it behaves.
Don't trade a pattern just because you can name it. Wait for confirmation.
And if you made it all the way here:
You're definitely not dumb. 😂📊
🔥 CHAINBALLER
Learn the chart. Understand the crowd. Wait for confirmation.
#ChainBaller #TradingEducation #ChartPatterns
$RLC $ZEC $SAND
366
·
--
Article
Bull & Bear Flags: Explained Simply📘 What are Bull and Bear Flags?
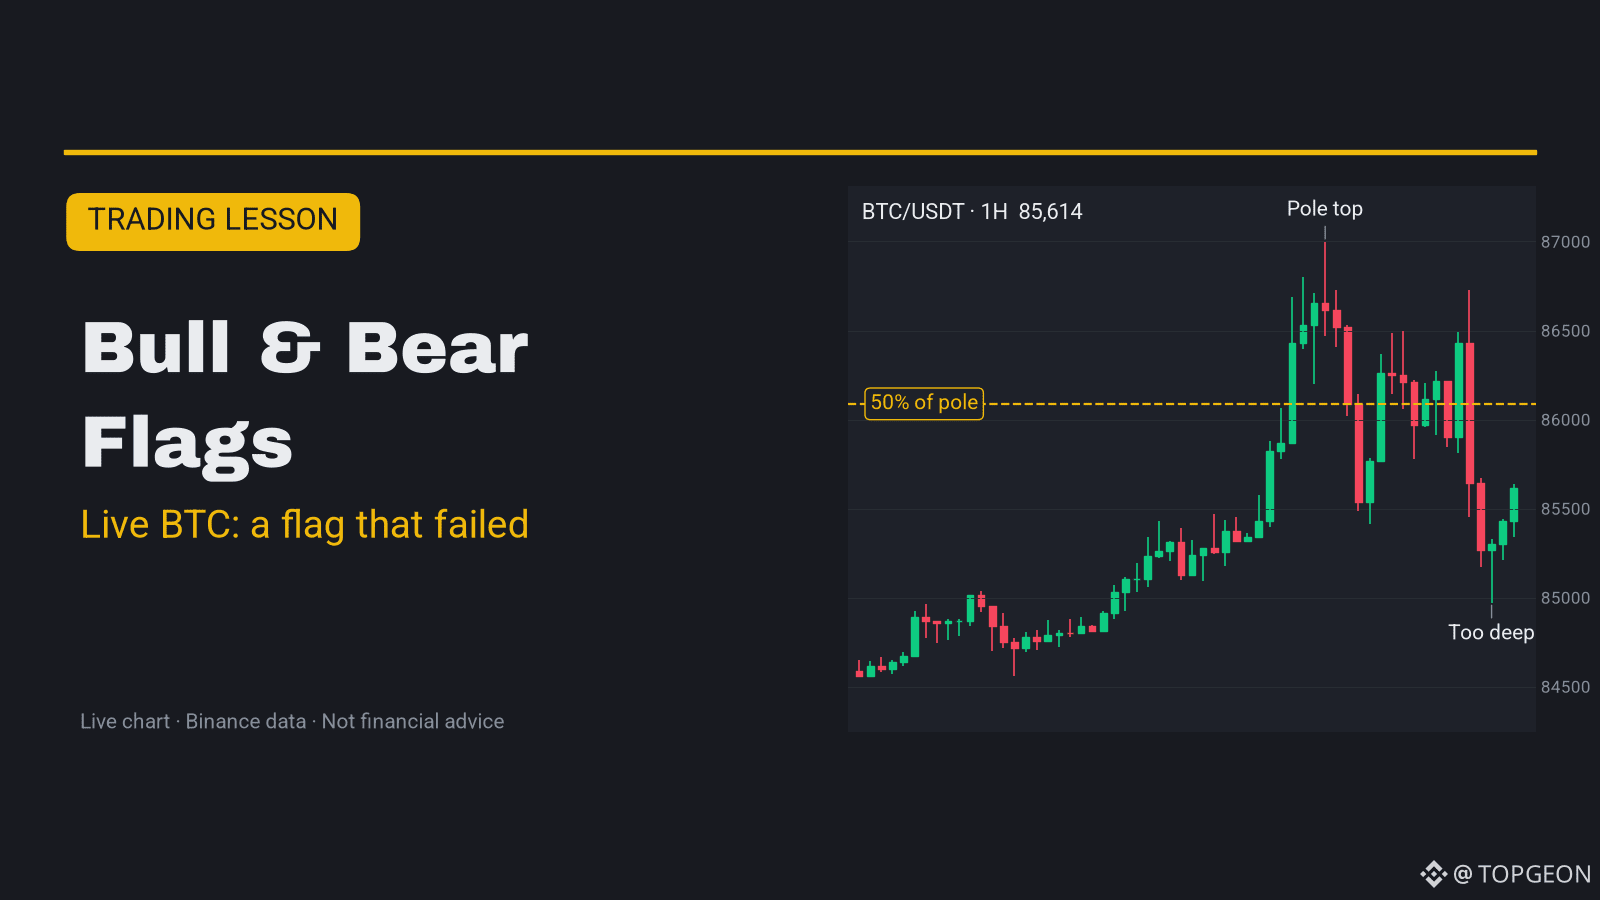
$BTC tried to draw a bull flag on the 1H chart this weekend, and it failed. That makes it a perfect live lesson.
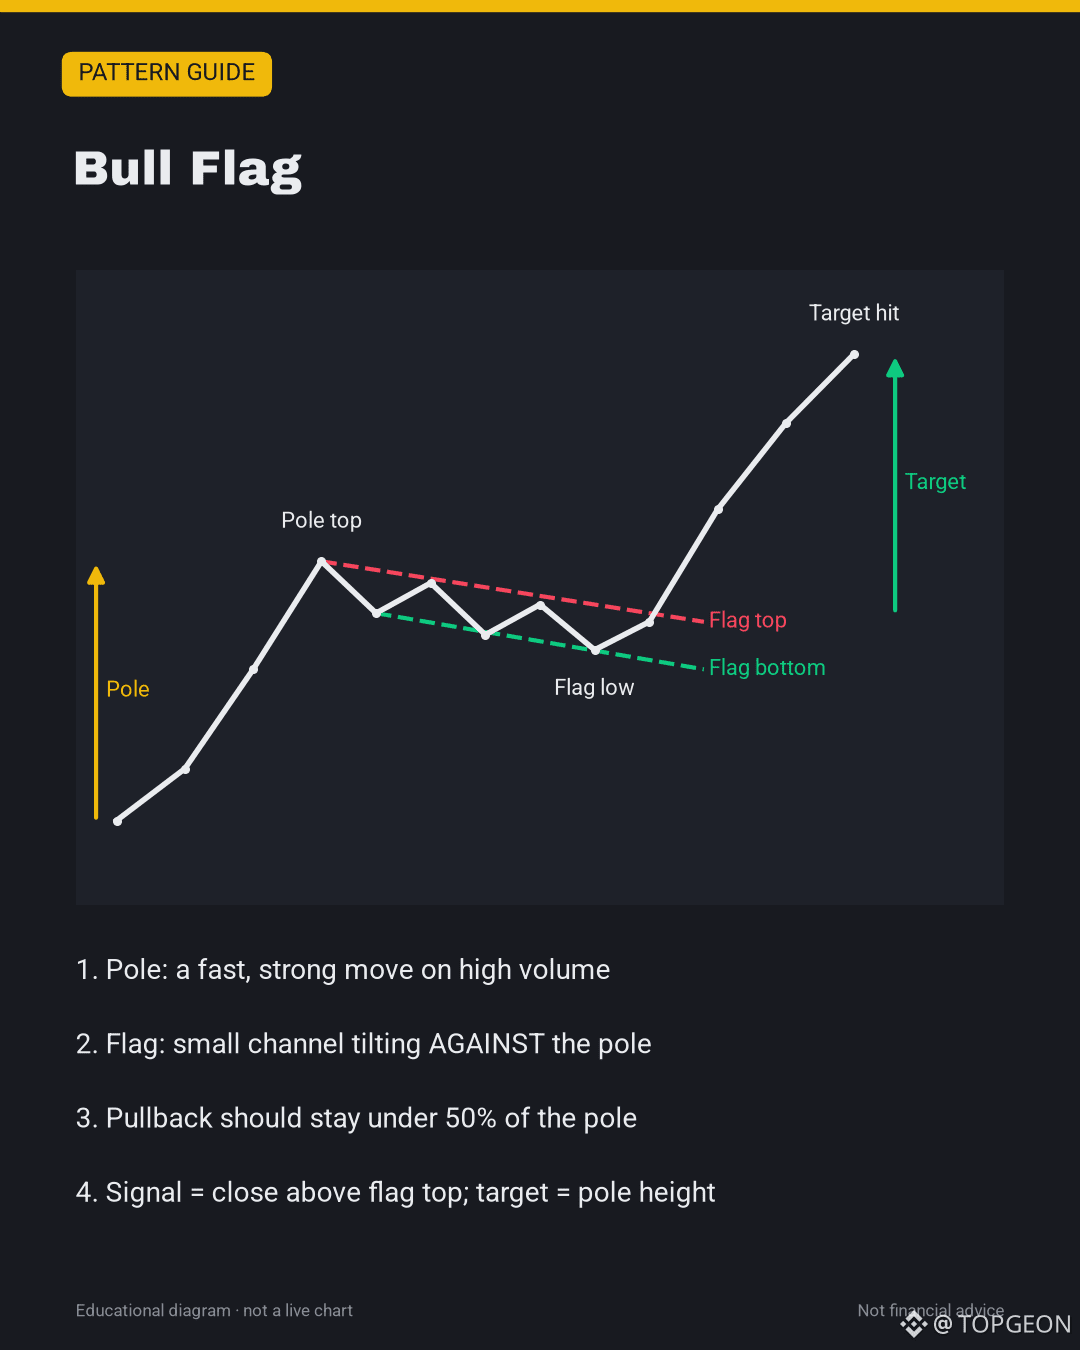
A flag is a short pause inside a strong trend. Price makes a fast move (the "pole"), then drifts sideways in a small channel (the "flag"), then often continues in the same direction.
• Bull flag: sharp move up, then a small channel that tilts slightly DOWN. Usually bullish.
• Bear flag: sharp move down, then a small channel that tilts slightly UP. Usually bearish.
📊 Live chart in the cover and in the image post below.
🔍 How to spot a flag
• First find the pole: a fast, strong move, ideally on rising volume
• Then a pause: 2 parallel lines, tilting against the pole
• Volume should dry up during the pause
• The pullback should stay shallow, under 50% of the pole (best under 38%)
• The signal is a candle CLOSE out of the flag in the pole's direction
📈 How traders use it
• Entry: on the close above the flag top (bull) or below the flag bottom (bear)
• Stop-loss: on the other side of the flag, often under the flag low for a bull flag
• Target: measure the pole height and add it from the breakout point
🧪 Live example: $BTC 1H, October 4–5, 2026
The pole:
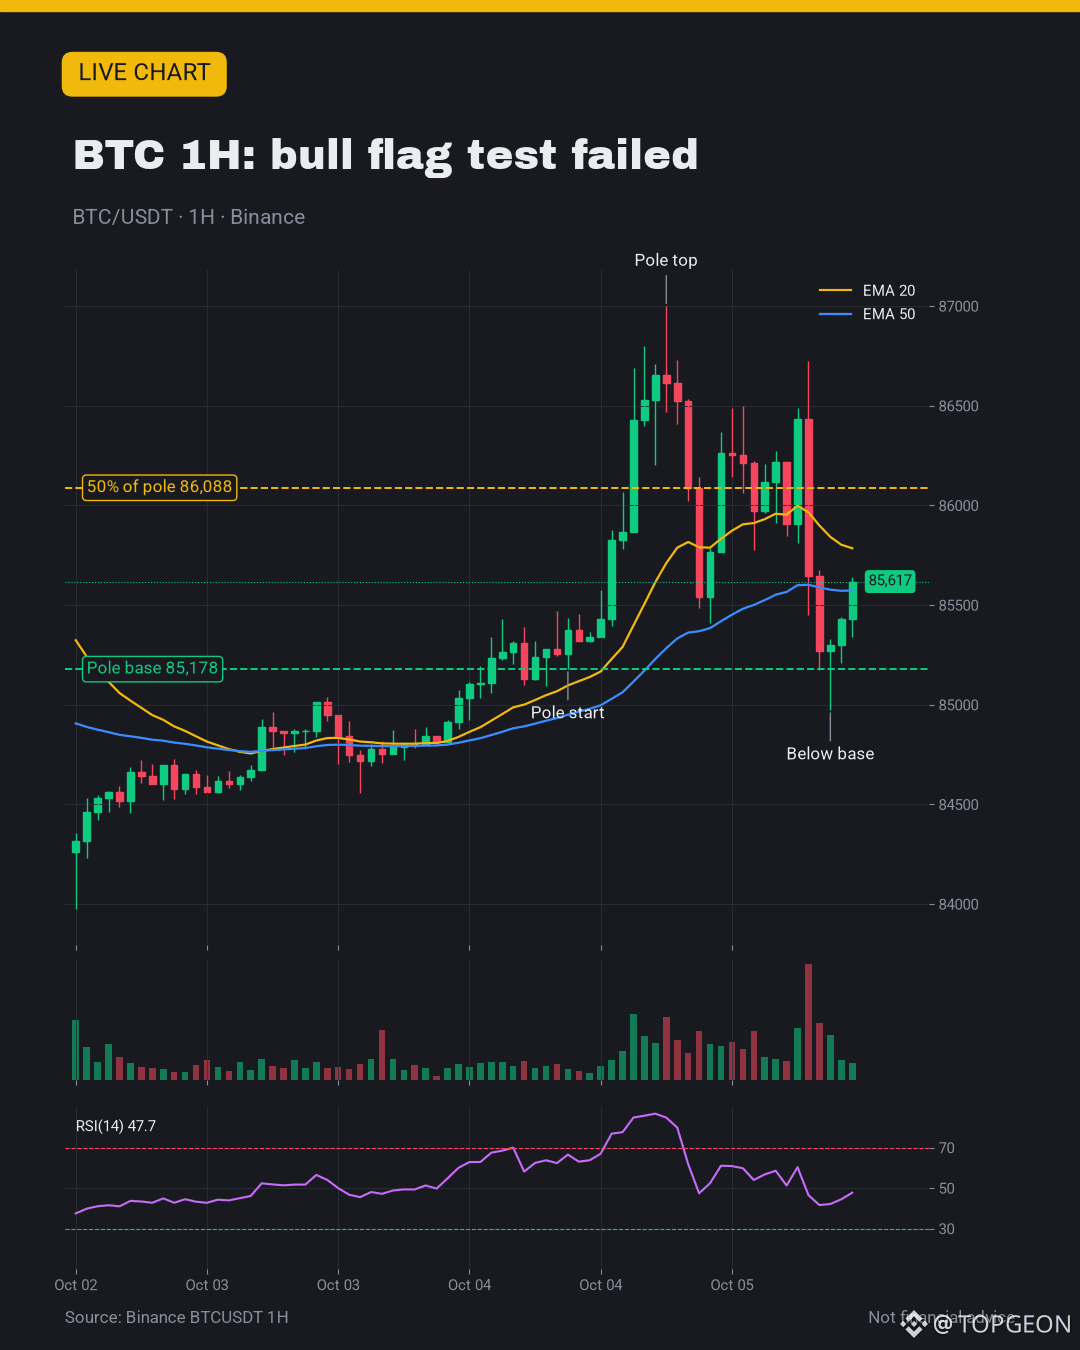
• Oct 4, 16:00 UTC: low at $85,178
• Oct 5, 01:00 UTC: high at $86,999
• A move of about $1,821 (+2.1%) in 9 hours, on strong volume
The 50% line of that pole sits at about $86,088. For a healthy bull flag, dips should hold above it.
What happened:
• By 04:00 UTC price already dipped to $85,412, deeper than 50%
• The bounce failed near $86,725
• At 16:00 UTC price hit $84,972, BELOW the start of the pole
The pullback ate more than 100% of the pole. That is not a flag anymore. It is just a failed move.
Now BTC trades near $85,610. 1H RSI is about 48, price sits between the 20 EMA ($85,785) and 50 EMA ($85,573). No flag is active.
What would need to happen: a new strong push (for example through $87K) and then a tight, shallow pause that holds above its own 50% line.
⚠️ Common mistakes
• Calling any sideways drift a flag. No strong pole = no flag
• Ignoring depth. A pullback over 50% of the pole is a warning, over 100% kills it
• Buying inside the flag before the breakout close
• Forgetting volume. A breakout on weak volume often fails
✅ Quick checklist
• Is there a clear, fast pole?
• Does the pause tilt against the pole, in a tight channel?
• Did the pullback stay under 50% of the pole?
• Is there a candle close out of the flag, with volume?
• Stop on the other side of the flag, target = pole height?
💬 Have you ever bought a "bull flag" that turned out to be a top? 👇
Not financial advice. DYOR.
#TradingTips #ChartPatterns #BTC
Bull & Bear Flags: Explained Simply
📘 What are Bull and Bear Flags?
$BTC tried to draw a bull flag on the 1H chart this weekend, and it failed. That makes it a perfect live lesson.
A flag is a short pause inside a strong trend. Price makes a fast move (the "pole"), then drifts sideways in a small channel (the "flag"), then often continues in the same direction.
• Bull flag: sharp move up, then a small channel that tilts slightly DOWN. Usually bullish.
• Bear flag: sharp move down, then a small channel that tilts slightly UP. Usually bearish.
📊 Live chart in the cover and in the image post below.
🔍 How to spot a flag
• First find the pole: a fast, strong move, ideally on rising volume
• Then a pause: 2 parallel lines, tilting against the pole
• Volume should dry up during the pause
• The pullback should stay shallow, under 50% of the pole (best under 38%)
• The signal is a candle CLOSE out of the flag in the pole's direction
📈 How traders use it
• Entry: on the close above the flag top (bull) or below the flag bottom (bear)
• Stop-loss: on the other side of the flag, often under the flag low for a bull flag
• Target: measure the pole height and add it from the breakout point
🧪 Live example: $BTC 1H, October 4–5, 2026
The pole:
• Oct 4, 16:00 UTC: low at $85,178
• Oct 5, 01:00 UTC: high at $86,999
• A move of about $1,821 (+2.1%) in 9 hours, on strong volume
The 50% line of that pole sits at about $86,088. For a healthy bull flag, dips should hold above it.
What happened:
• By 04:00 UTC price already dipped to $85,412, deeper than 50%
• The bounce failed near $86,725
• At 16:00 UTC price hit $84,972, BELOW the start of the pole
The pullback ate more than 100% of the pole. That is not a flag anymore. It is just a failed move.
Now BTC trades near $85,610. 1H RSI is about 48, price sits between the 20 EMA ($85,785) and 50 EMA ($85,573). No flag is active.
What would need to happen: a new strong push (for example through $87K) and then a tight, shallow pause that holds above its own 50% line.
⚠️ Common mistakes
• Calling any sideways drift a flag. No strong pole = no flag
• Ignoring depth. A pullback over 50% of the pole is a warning, over 100% kills it
• Buying inside the flag before the breakout close
• Forgetting volume. A breakout on weak volume often fails
✅ Quick checklist
• Is there a clear, fast pole?
• Does the pause tilt against the pole, in a tight channel?
• Did the pullback stay under 50% of the pole?
• Is there a candle close out of the flag, with volume?
• Stop on the other side of the flag, target = pole height?
💬 Have you ever bought a "bull flag" that turned out to be a top? 👇
Not financial advice. DYOR.
#TradingTips #ChartPatterns #BTC
$BTC tried to draw a bull flag on the 1H chart this weekend, and it failed. That makes it a perfect live lesson.
A flag is a short pause inside a strong trend. Price makes a fast move (the "pole"), then drifts sideways in a small channel (the "flag"), then often continues in the same direction.
• Bull flag: sharp move up, then a small channel that tilts slightly DOWN. Usually bullish.
• Bear flag: sharp move down, then a small channel that tilts slightly UP. Usually bearish.
📊 Live chart in the cover and in the image post below.
🔍 How to spot a flag
• First find the pole: a fast, strong move, ideally on rising volume
• Then a pause: 2 parallel lines, tilting against the pole
• Volume should dry up during the pause
• The pullback should stay shallow, under 50% of the pole (best under 38%)
• The signal is a candle CLOSE out of the flag in the pole's direction
📈 How traders use it
• Entry: on the close above the flag top (bull) or below the flag bottom (bear)
• Stop-loss: on the other side of the flag, often under the flag low for a bull flag
• Target: measure the pole height and add it from the breakout point
🧪 Live example: $BTC 1H, October 4–5, 2026
The pole:
• Oct 4, 16:00 UTC: low at $85,178
• Oct 5, 01:00 UTC: high at $86,999
• A move of about $1,821 (+2.1%) in 9 hours, on strong volume
The 50% line of that pole sits at about $86,088. For a healthy bull flag, dips should hold above it.
What happened:
• By 04:00 UTC price already dipped to $85,412, deeper than 50%
• The bounce failed near $86,725
• At 16:00 UTC price hit $84,972, BELOW the start of the pole
The pullback ate more than 100% of the pole. That is not a flag anymore. It is just a failed move.
Now BTC trades near $85,610. 1H RSI is about 48, price sits between the 20 EMA ($85,785) and 50 EMA ($85,573). No flag is active.
What would need to happen: a new strong push (for example through $87K) and then a tight, shallow pause that holds above its own 50% line.
⚠️ Common mistakes
• Calling any sideways drift a flag. No strong pole = no flag
• Ignoring depth. A pullback over 50% of the pole is a warning, over 100% kills it
• Buying inside the flag before the breakout close
• Forgetting volume. A breakout on weak volume often fails
✅ Quick checklist
• Is there a clear, fast pole?
• Does the pause tilt against the pole, in a tight channel?
• Did the pullback stay under 50% of the pole?
• Is there a candle close out of the flag, with volume?
• Stop on the other side of the flag, target = pole height?
💬 Have you ever bought a "bull flag" that turned out to be a top? 👇
Not financial advice. DYOR.
#TradingTips #ChartPatterns #BTC
13
·
--
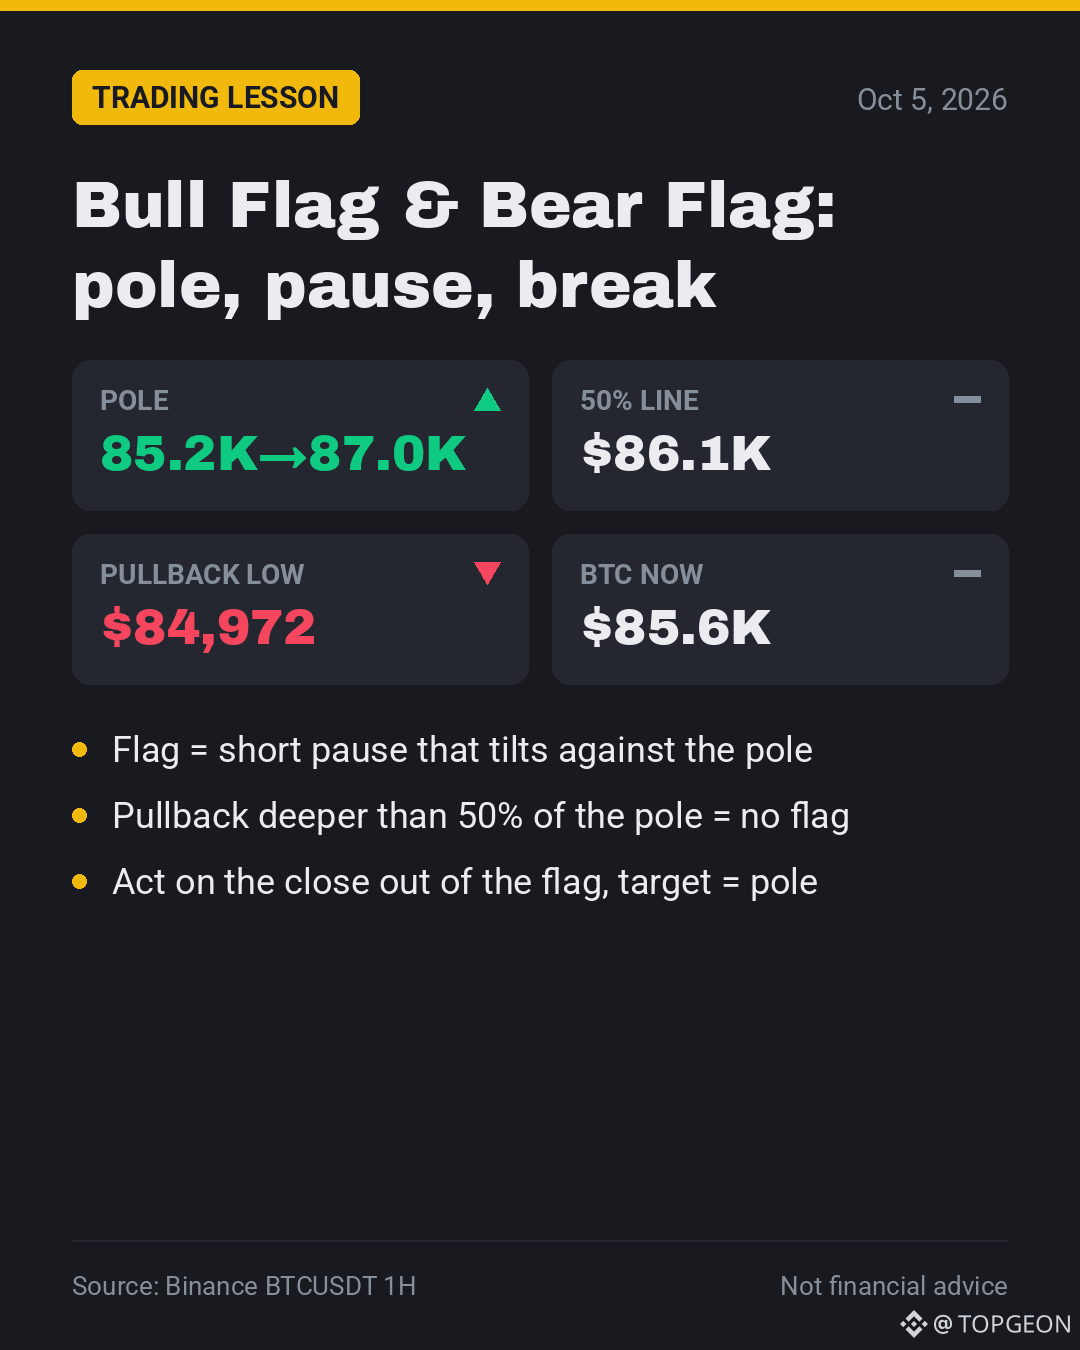
🚩 $BTC drew a perfect pole, then the "flag" ate it all
✅ Pole: $85,178 → $86,999 in 9 hours (+2.1%)
⚠️ Healthy flags hold above 50% of the pole ($86,088)
❌ Pullback hit $84,972, below the pole's start
🧭 Rule: deeper than 50% = warning, deeper than 100% = no flag
💬 Do you measure the pullback before buying a flag? 👇
📖 Full lesson: https://app.binance.com/uni-qr/cart/374107071994592
#ChartPatterns #BullFlag
🚩 $BTC drew a perfect pole, then the "flag" ate it all
✅ Pole: $85,178 → $86,999 in 9 hours (+2.1%)
⚠️ Healthy flags hold above 50% of the pole ($86,088)
❌ Pullback hit $84,972, below the pole's start
🧭 Rule: deeper than 50% = warning, deeper than 100% = no flag
💬 Do you measure the pullback before buying a flag? 👇
📖 Full lesson: https://app.binance.com/uni-qr/cart/374107071994592
#ChartPatterns #BullFlag
✅ Pole: $85,178 → $86,999 in 9 hours (+2.1%)
⚠️ Healthy flags hold above 50% of the pole ($86,088)
❌ Pullback hit $84,972, below the pole's start
🧭 Rule: deeper than 50% = warning, deeper than 100% = no flag
💬 Do you measure the pullback before buying a flag? 👇
📖 Full lesson: https://app.binance.com/uni-qr/cart/374107071994592
#ChartPatterns #BullFlag
1
59
·
--
Article
Triangle Patterns: Explained Simply📘 What are Triangle patterns?
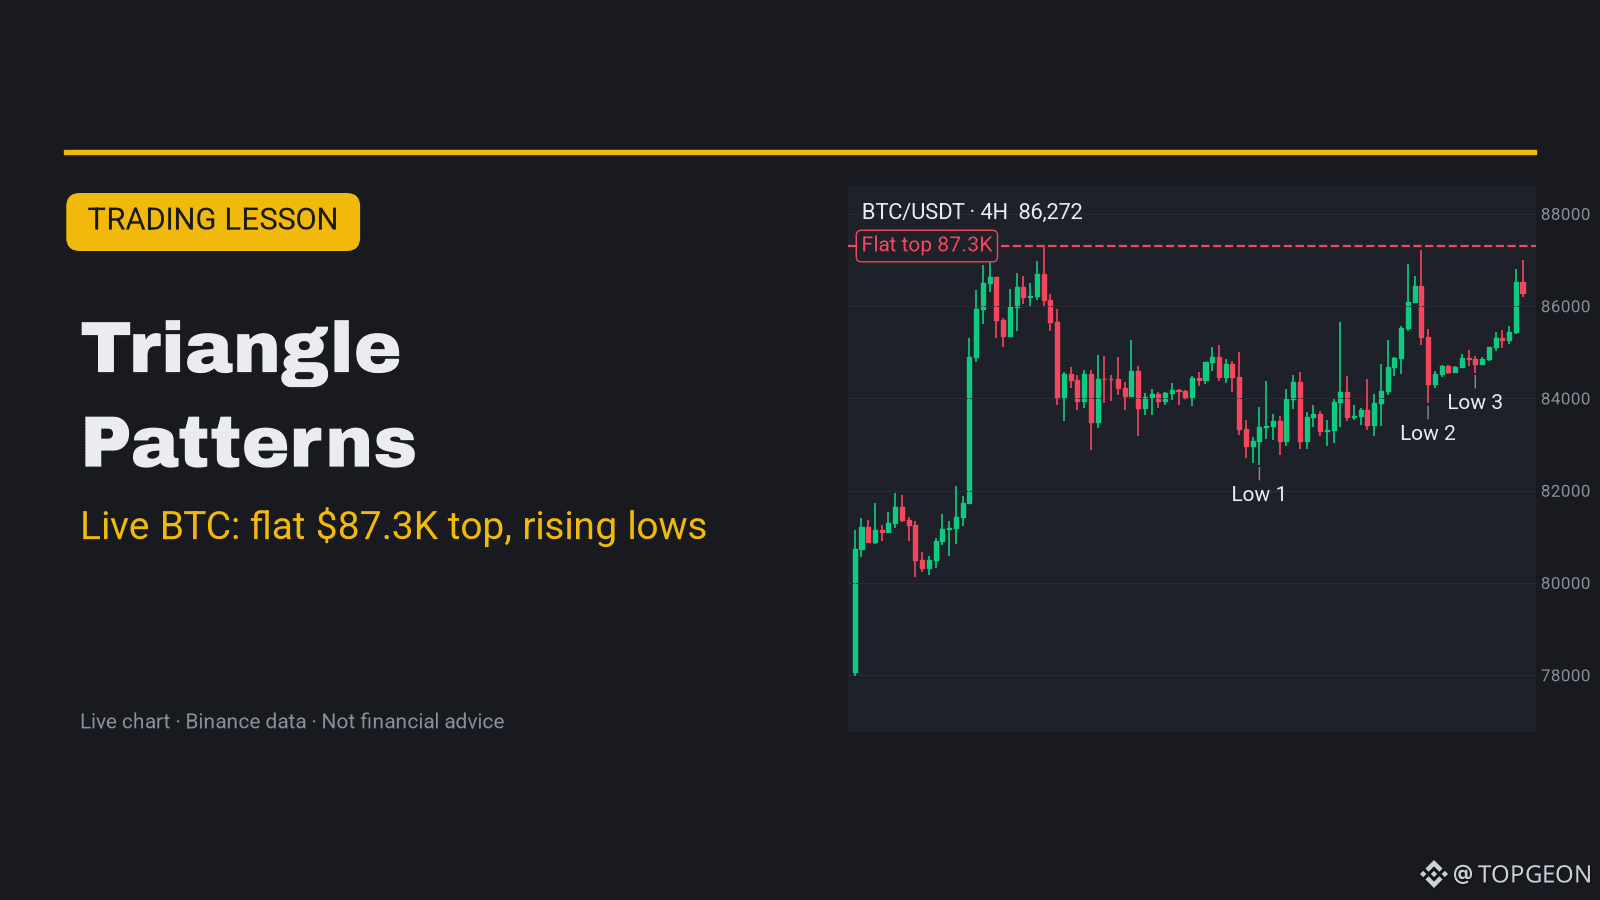
$BTC is drawing one on the 4H chart right now. A triangle forms when price swings get smaller and smaller, squeezed between two lines that move toward each other. At some point price must break out of the squeeze, and the shape gives a hint about which way.
There are three types:
• Ascending triangle: flat top, rising lows. Buyers step in higher each time. Usually bullish.
• Descending triangle: flat floor, falling highs. Sellers push down harder each time. Usually bearish.
• Symmetrical triangle: falling highs AND rising lows. Nobody is in control. It often breaks in the direction of the trend before it.
📊 Live chart in the cover and in the image post below.
🔍 How to spot a triangle
• Draw a line across at least 2 highs and another across at least 2 lows
• Each line needs 2–3 clean touches, not just one wick
• The lines must move toward each other (they meet at the "apex")
• Volume usually shrinks while the triangle forms
• The signal is a candle CLOSE outside one of the lines
📈 How traders use it
• Entry: on the close outside the line, or on a retest of the broken line
• Stop-loss: back inside the triangle, often below the last low (or above the last high for a breakdown)
• Target: measure the widest part of the triangle and project it from the breakout point
🧪 Live example: $BTC 4H, September–October 2026
The flat top:
• Sep 21: high at $87,396
• Sep 23: high at $87,279
• Oct 2: high at $87,220
• Three tests within $180 of each other. A clear ceiling near $87.3K.
The rising lows:
• Sep 28: low at $82,563
• Oct 2: low at $83,888
• Oct 3: low at $84,558
• Every dip stopped higher. That is the ascending triangle.
Today BTC trades near $86,270, about 1% under the ceiling. It tagged $86,999 overnight but has not closed above $87.3K yet. 4H RSI is 65, price sits above the 20 EMA ($85,140) and 50 EMA ($84,515).
Target math (only if it breaks):
• Height = $87,300 − $82,563 = about $4,740
• Target = $87,300 + $4,740 = about $92,000
• Invalidation: a 4H close below the rising line (around $84.6K–$85K today)
No breakout yet means no signal yet. The pattern can still fail.
⚠️ Common mistakes
• Buying the wick above the top. A close is the signal, not a spike
• Drawing lines through only one touch. That is a guess, not a triangle
• Waiting until the apex. Breakouts late in the triangle are often weak
• Forgetting a descending or symmetrical triangle can break UP too. Trade the break, not the bias
✅ Quick checklist
• Two lines with 2–3 touches each?
• Lines moving toward each other?
• Candle close outside the line, ideally on rising volume?
• Stop placed back inside the triangle?
• Target measured from the widest part before entering?
💬 Do you trade triangle breakouts, or wait for the retest? 👇
Not financial advice. DYOR.
#TradingTips #ChartPatterns #BTC
Triangle Patterns: Explained Simply
📘 What are Triangle patterns?
$BTC is drawing one on the 4H chart right now. A triangle forms when price swings get smaller and smaller, squeezed between two lines that move toward each other. At some point price must break out of the squeeze, and the shape gives a hint about which way.
There are three types:
• Ascending triangle: flat top, rising lows. Buyers step in higher each time. Usually bullish.
• Descending triangle: flat floor, falling highs. Sellers push down harder each time. Usually bearish.
• Symmetrical triangle: falling highs AND rising lows. Nobody is in control. It often breaks in the direction of the trend before it.
📊 Live chart in the cover and in the image post below.
🔍 How to spot a triangle
• Draw a line across at least 2 highs and another across at least 2 lows
• Each line needs 2–3 clean touches, not just one wick
• The lines must move toward each other (they meet at the "apex")
• Volume usually shrinks while the triangle forms
• The signal is a candle CLOSE outside one of the lines
📈 How traders use it
• Entry: on the close outside the line, or on a retest of the broken line
• Stop-loss: back inside the triangle, often below the last low (or above the last high for a breakdown)
• Target: measure the widest part of the triangle and project it from the breakout point
🧪 Live example: $BTC 4H, September–October 2026
The flat top:
• Sep 21: high at $87,396
• Sep 23: high at $87,279
• Oct 2: high at $87,220
• Three tests within $180 of each other. A clear ceiling near $87.3K.
The rising lows:
• Sep 28: low at $82,563
• Oct 2: low at $83,888
• Oct 3: low at $84,558
• Every dip stopped higher. That is the ascending triangle.
Today BTC trades near $86,270, about 1% under the ceiling. It tagged $86,999 overnight but has not closed above $87.3K yet. 4H RSI is 65, price sits above the 20 EMA ($85,140) and 50 EMA ($84,515).
Target math (only if it breaks):
• Height = $87,300 − $82,563 = about $4,740
• Target = $87,300 + $4,740 = about $92,000
• Invalidation: a 4H close below the rising line (around $84.6K–$85K today)
No breakout yet means no signal yet. The pattern can still fail.
⚠️ Common mistakes
• Buying the wick above the top. A close is the signal, not a spike
• Drawing lines through only one touch. That is a guess, not a triangle
• Waiting until the apex. Breakouts late in the triangle are often weak
• Forgetting a descending or symmetrical triangle can break UP too. Trade the break, not the bias
✅ Quick checklist
• Two lines with 2–3 touches each?
• Lines moving toward each other?
• Candle close outside the line, ideally on rising volume?
• Stop placed back inside the triangle?
• Target measured from the widest part before entering?
💬 Do you trade triangle breakouts, or wait for the retest? 👇
Not financial advice. DYOR.
#TradingTips #ChartPatterns #BTC
$BTC is drawing one on the 4H chart right now. A triangle forms when price swings get smaller and smaller, squeezed between two lines that move toward each other. At some point price must break out of the squeeze, and the shape gives a hint about which way.
There are three types:
• Ascending triangle: flat top, rising lows. Buyers step in higher each time. Usually bullish.
• Descending triangle: flat floor, falling highs. Sellers push down harder each time. Usually bearish.
• Symmetrical triangle: falling highs AND rising lows. Nobody is in control. It often breaks in the direction of the trend before it.
📊 Live chart in the cover and in the image post below.
🔍 How to spot a triangle
• Draw a line across at least 2 highs and another across at least 2 lows
• Each line needs 2–3 clean touches, not just one wick
• The lines must move toward each other (they meet at the "apex")
• Volume usually shrinks while the triangle forms
• The signal is a candle CLOSE outside one of the lines
📈 How traders use it
• Entry: on the close outside the line, or on a retest of the broken line
• Stop-loss: back inside the triangle, often below the last low (or above the last high for a breakdown)
• Target: measure the widest part of the triangle and project it from the breakout point
🧪 Live example: $BTC 4H, September–October 2026
The flat top:
• Sep 21: high at $87,396
• Sep 23: high at $87,279
• Oct 2: high at $87,220
• Three tests within $180 of each other. A clear ceiling near $87.3K.
The rising lows:
• Sep 28: low at $82,563
• Oct 2: low at $83,888
• Oct 3: low at $84,558
• Every dip stopped higher. That is the ascending triangle.
Today BTC trades near $86,270, about 1% under the ceiling. It tagged $86,999 overnight but has not closed above $87.3K yet. 4H RSI is 65, price sits above the 20 EMA ($85,140) and 50 EMA ($84,515).
Target math (only if it breaks):
• Height = $87,300 − $82,563 = about $4,740
• Target = $87,300 + $4,740 = about $92,000
• Invalidation: a 4H close below the rising line (around $84.6K–$85K today)
No breakout yet means no signal yet. The pattern can still fail.
⚠️ Common mistakes
• Buying the wick above the top. A close is the signal, not a spike
• Drawing lines through only one touch. That is a guess, not a triangle
• Waiting until the apex. Breakouts late in the triangle are often weak
• Forgetting a descending or symmetrical triangle can break UP too. Trade the break, not the bias
✅ Quick checklist
• Two lines with 2–3 touches each?
• Lines moving toward each other?
• Candle close outside the line, ideally on rising volume?
• Stop placed back inside the triangle?
• Target measured from the widest part before entering?
💬 Do you trade triangle breakouts, or wait for the retest? 👇
Not financial advice. DYOR.
#TradingTips #ChartPatterns #BTC
92
·
--
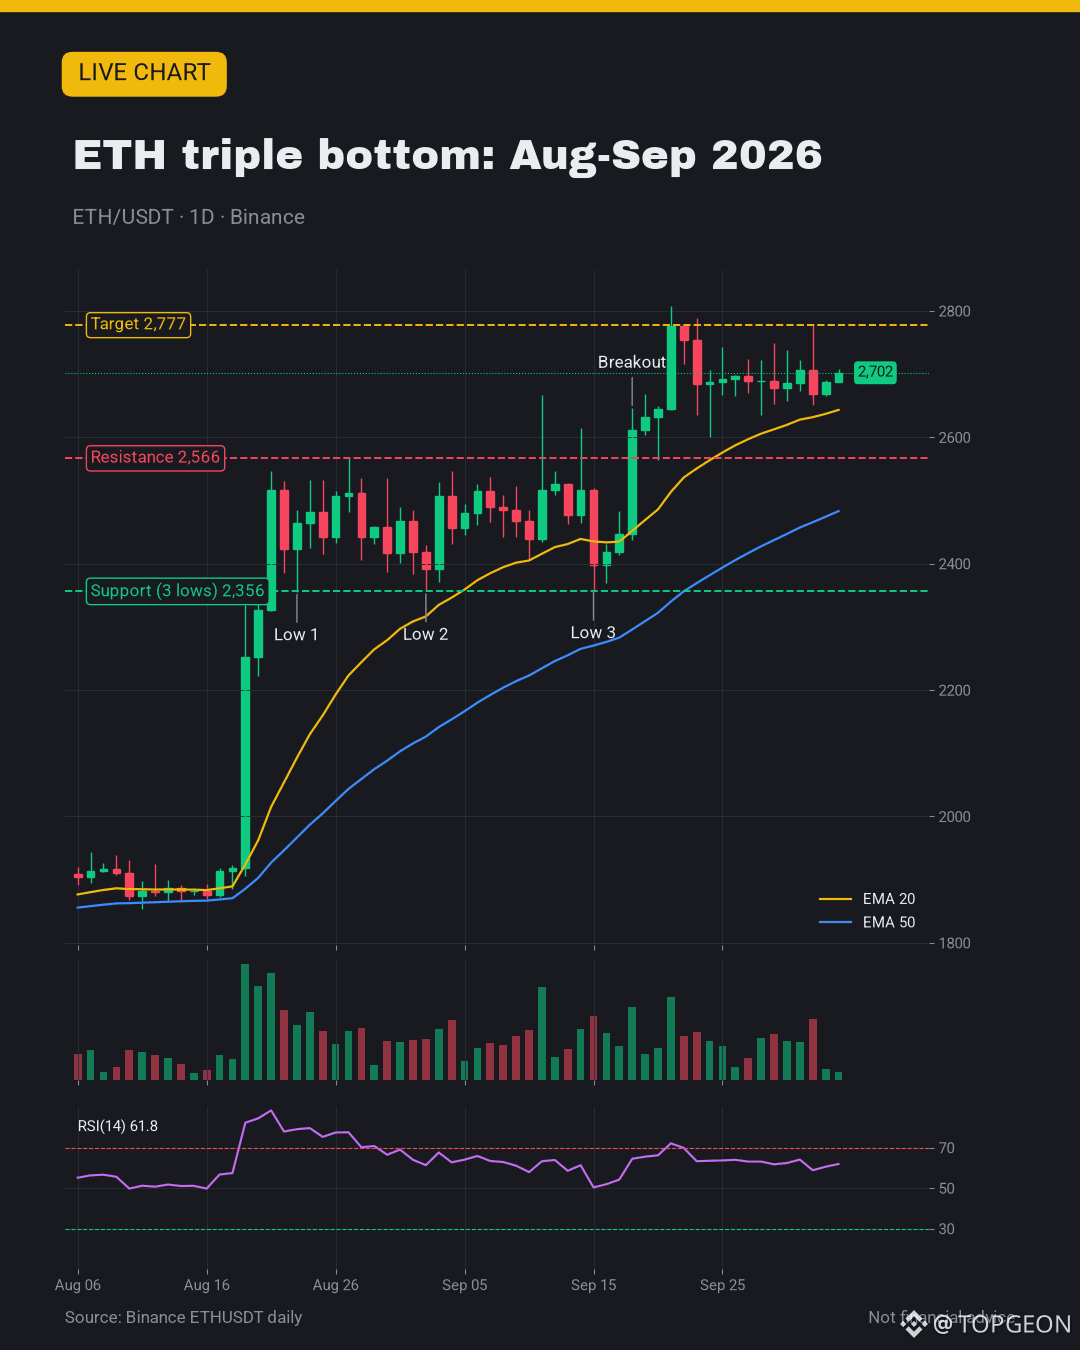
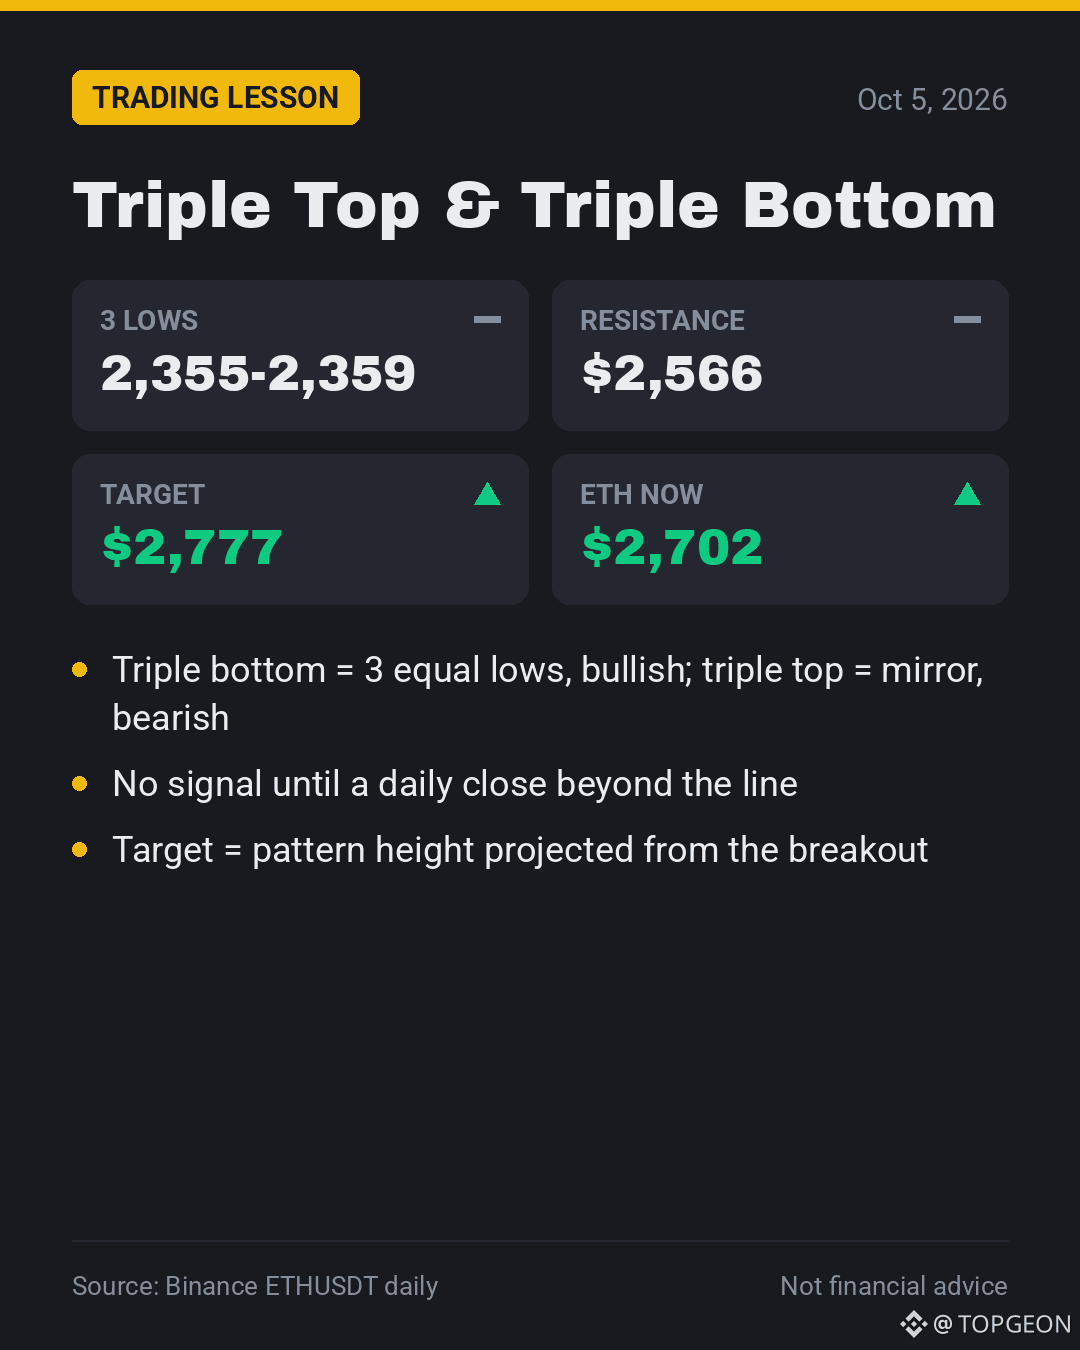
🧱 $ETH held the same floor 3 times: $2,355 to $2,359
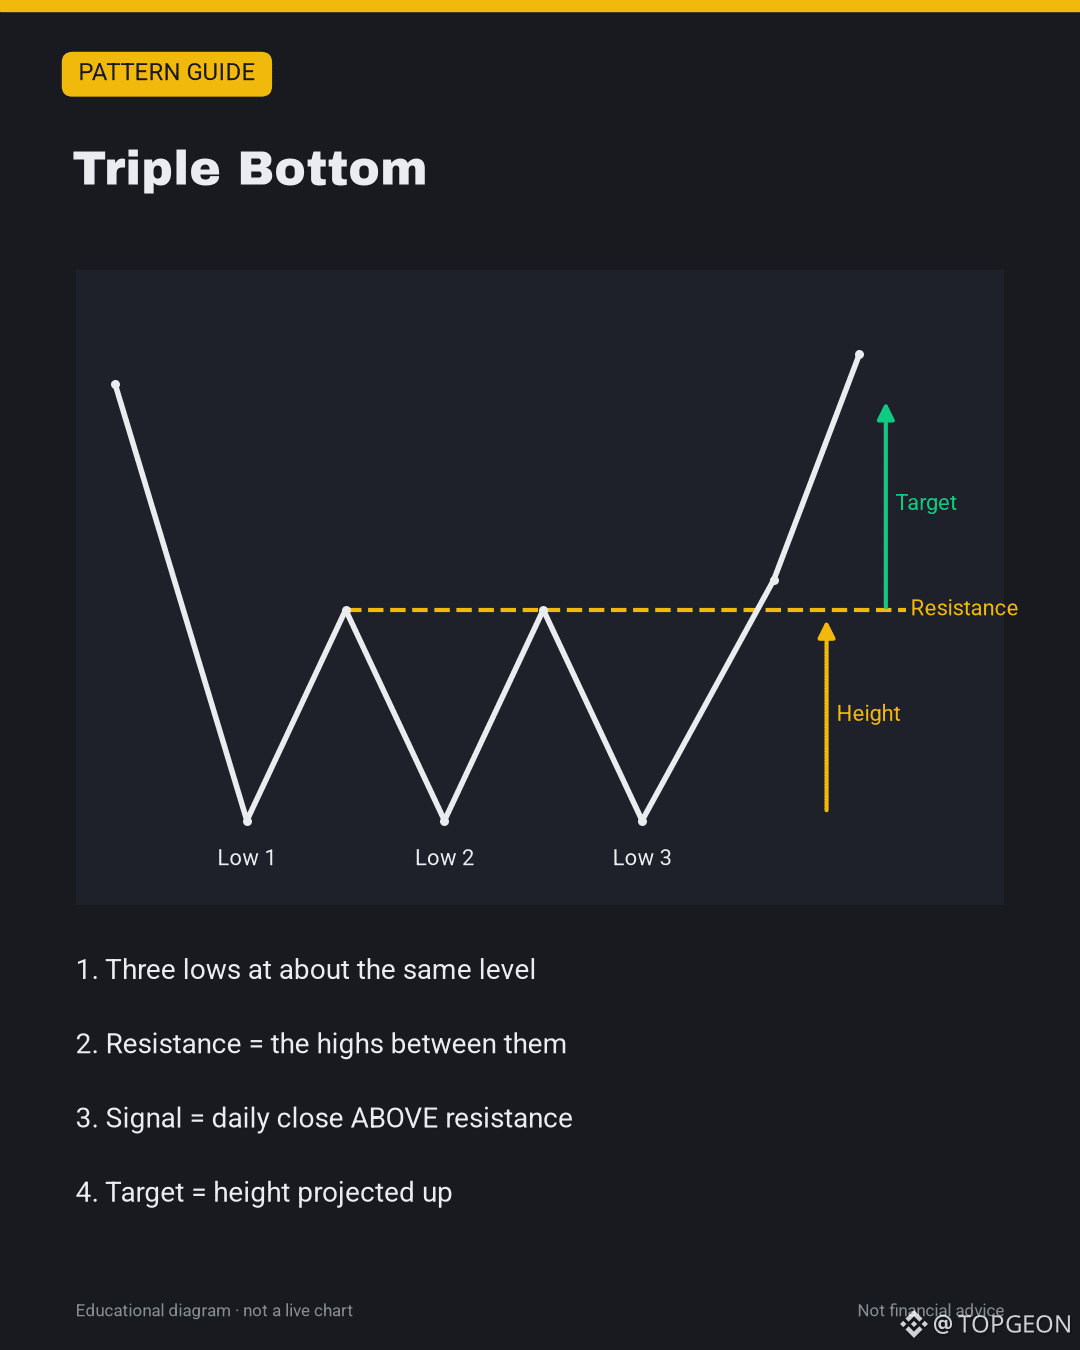
1️⃣ 3 equal lows + a close above resistance = triple bottom
2️⃣ Stop below the 3rd low, target = pattern height
3️⃣ Sep 11 and Sep 14 wicks were traps: wait for the close
📈 Breakout Sep 18 → $2,777 target hit 3 days later
💬 Ever been trapped by a fake breakout wick? 👇
📖 Full lesson: https://app.binance.com/uni-qr/cart/373753800463939
#TradingTips #ChartPatterns
🧱 $ETH held the same floor 3 times: $2,355 to $2,359
1️⃣ 3 equal lows + a close above resistance = triple bottom
2️⃣ Stop below the 3rd low, target = pattern height
3️⃣ Sep 11 and Sep 14 wicks were traps: wait for the close
📈 Breakout Sep 18 → $2,777 target hit 3 days later
💬 Ever been trapped by a fake breakout wick? 👇
📖 Full lesson: https://app.binance.com/uni-qr/cart/373753800463939
#TradingTips #ChartPatterns
1️⃣ 3 equal lows + a close above resistance = triple bottom
2️⃣ Stop below the 3rd low, target = pattern height
3️⃣ Sep 11 and Sep 14 wicks were traps: wait for the close
📈 Breakout Sep 18 → $2,777 target hit 3 days later
💬 Ever been trapped by a fake breakout wick? 👇
📖 Full lesson: https://app.binance.com/uni-qr/cart/373753800463939
#TradingTips #ChartPatterns
25
·
--
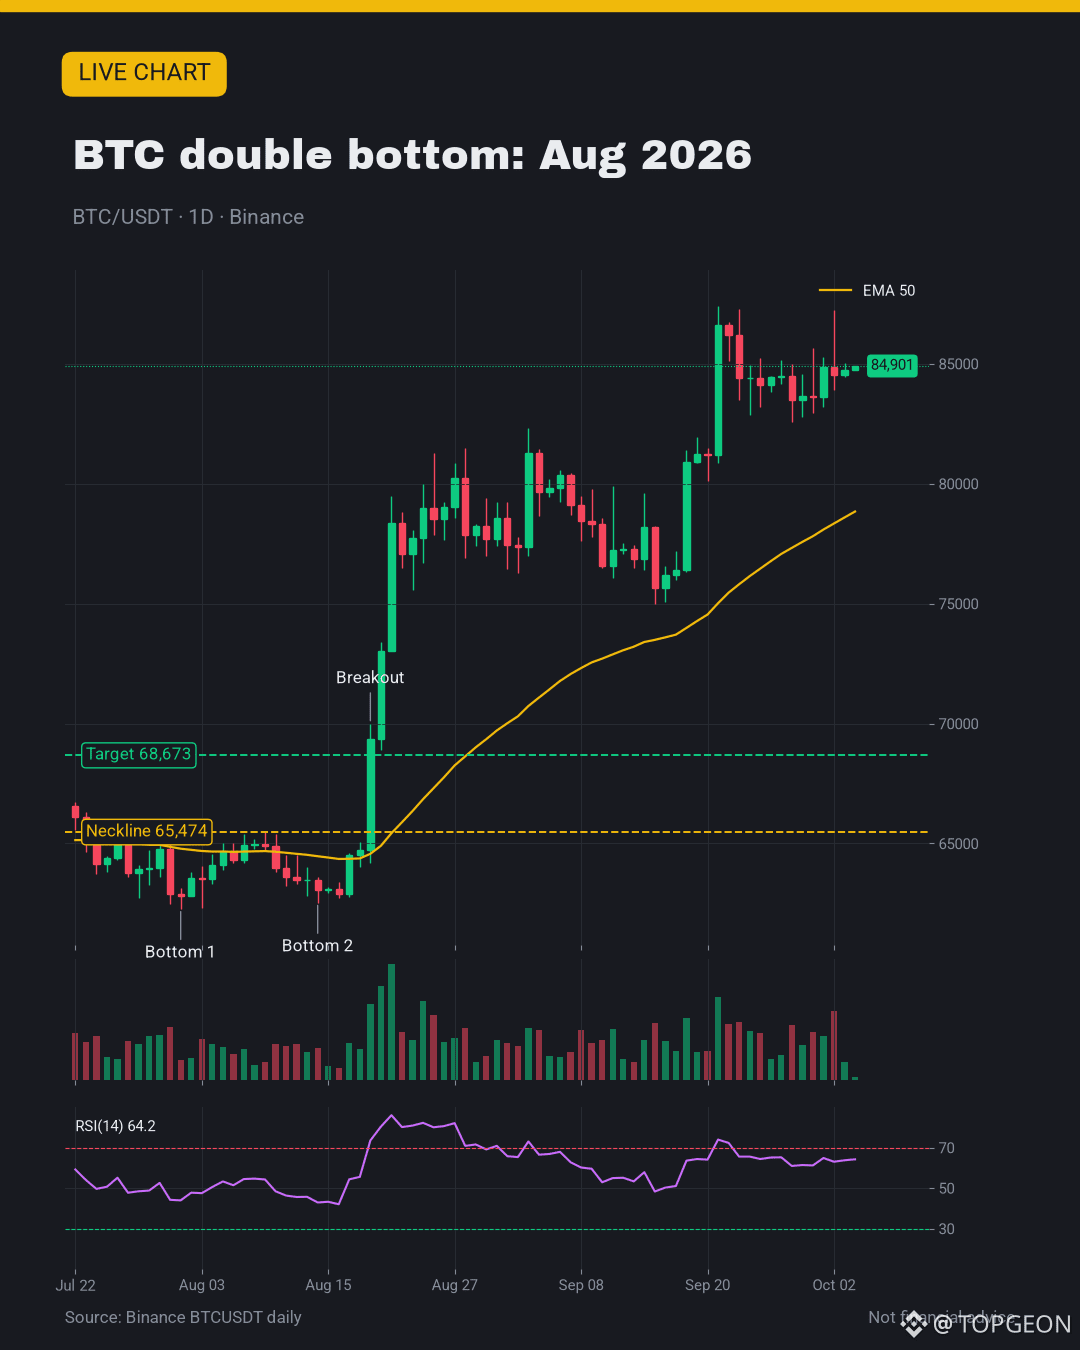
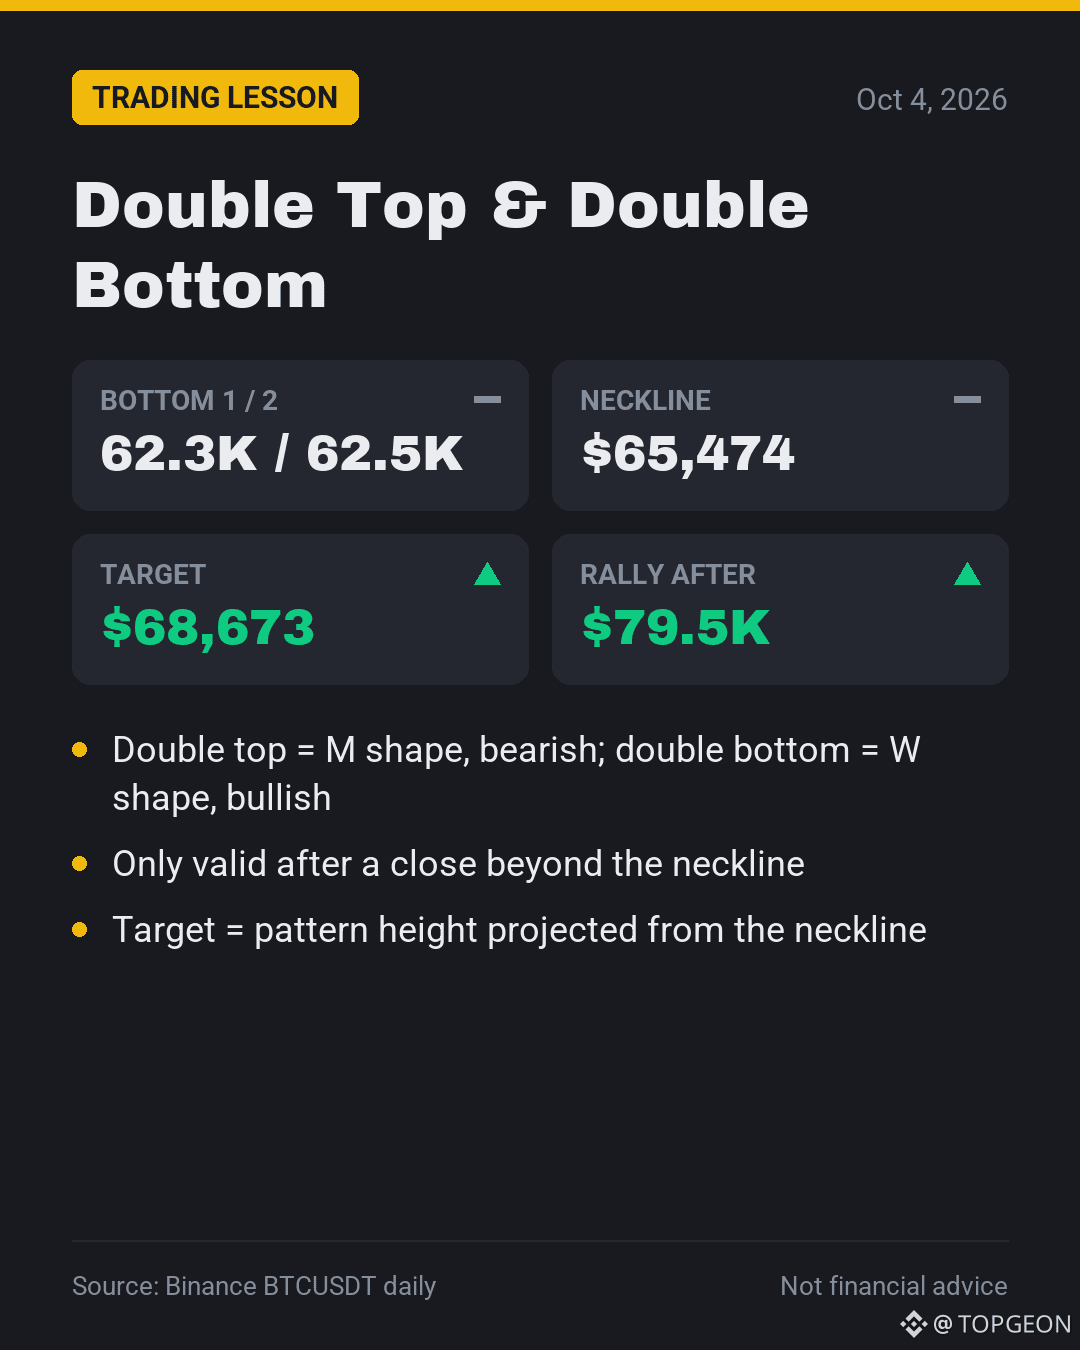
📘 Double Bottom: Real $BTC Example
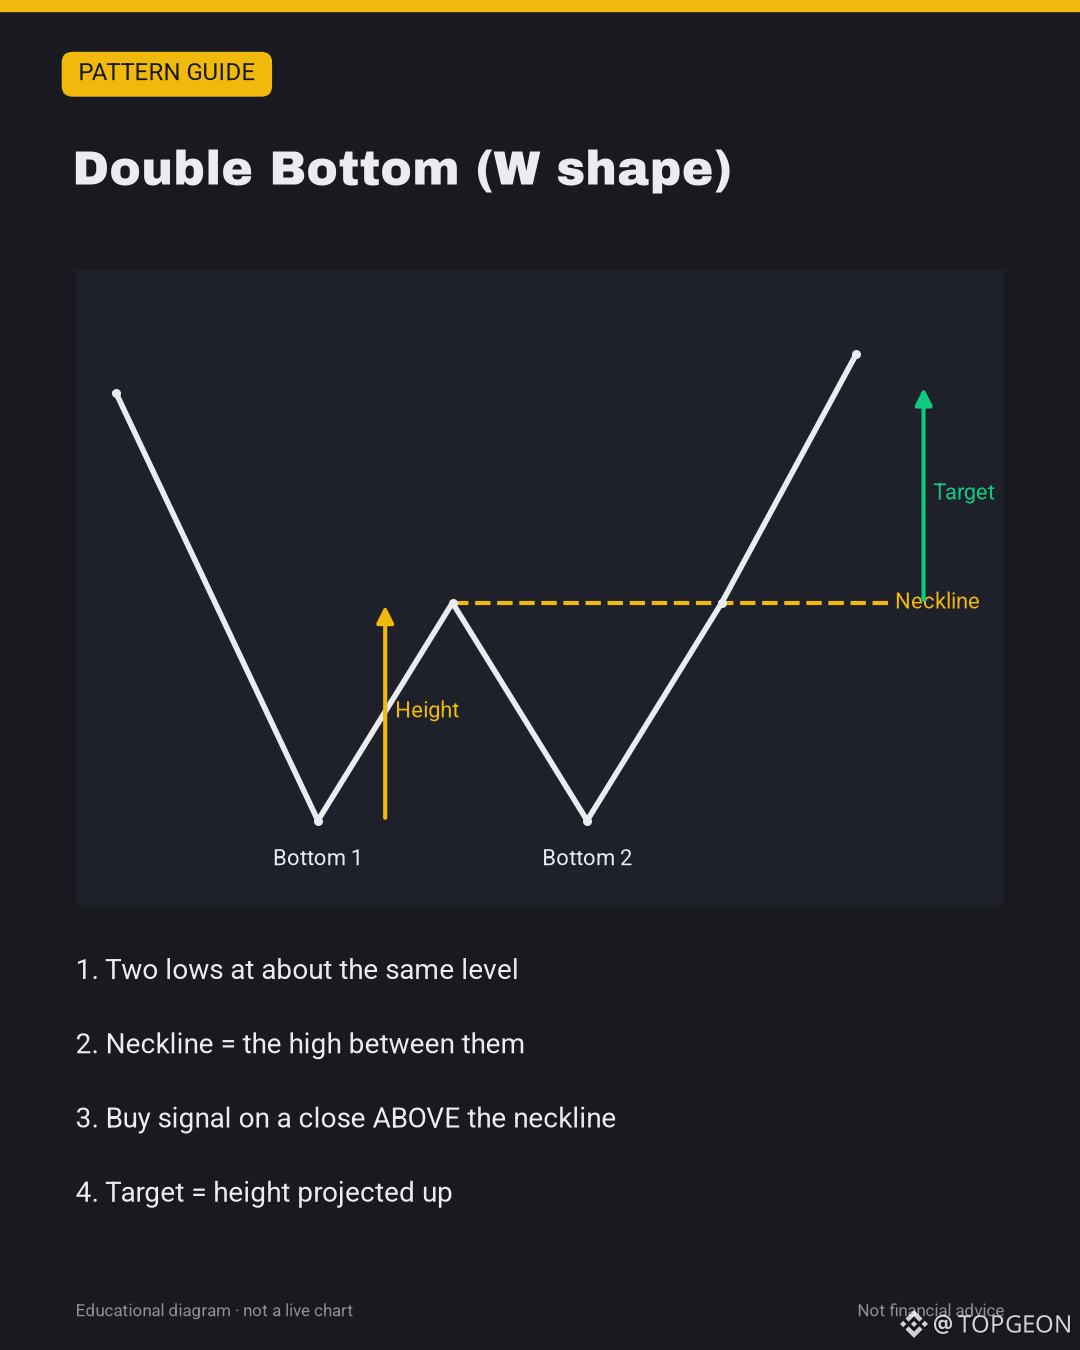
• W shape: two equal lows, then a break above the neckline
• Aug 1 low $62,275 → Aug 14 low $62,535 (same level)
• Neckline $65,474 broke on Aug 19 with big volume
• Target $68,673 hit the same day, BTC then ran to $79.5K
• Double Top = the bearish mirror (M shape)
📖 Full lesson: https://app.binance.com/uni-qr/cart/373560509445369
Not financial advice. DYOR.
#TradingTips #DoubleBottom #ChartPatterns
📘 Double Bottom: Real $BTC Example
• W shape: two equal lows, then a break above the neckline
• Aug 1 low $62,275 → Aug 14 low $62,535 (same level)
• Neckline $65,474 broke on Aug 19 with big volume
• Target $68,673 hit the same day, BTC then ran to $79.5K
• Double Top = the bearish mirror (M shape)
📖 Full lesson: https://app.binance.com/uni-qr/cart/373560509445369
Not financial advice. DYOR.
#TradingTips #DoubleBottom #ChartPatterns
• W shape: two equal lows, then a break above the neckline
• Aug 1 low $62,275 → Aug 14 low $62,535 (same level)
• Neckline $65,474 broke on Aug 19 with big volume
• Target $68,673 hit the same day, BTC then ran to $79.5K
• Double Top = the bearish mirror (M shape)
📖 Full lesson: https://app.binance.com/uni-qr/cart/373560509445369
Not financial advice. DYOR.
#TradingTips #DoubleBottom #ChartPatterns
Binance BiBi:
Hey! I see the content only mentions Bitcoin (BTC), using BTC/USDT as the example pair. BTC: About $85,010, slightly up on the day (around +0.4%) as of 2026-10-04 06:41 UTC; the post’s idea is a bullish double-bottom (W) where the “neckline” break is the confirmation and the measured-move target is set by projecting the pattern height upward—use it as a framework, not a guarantee. Not financial advice—DYOR.
3
71

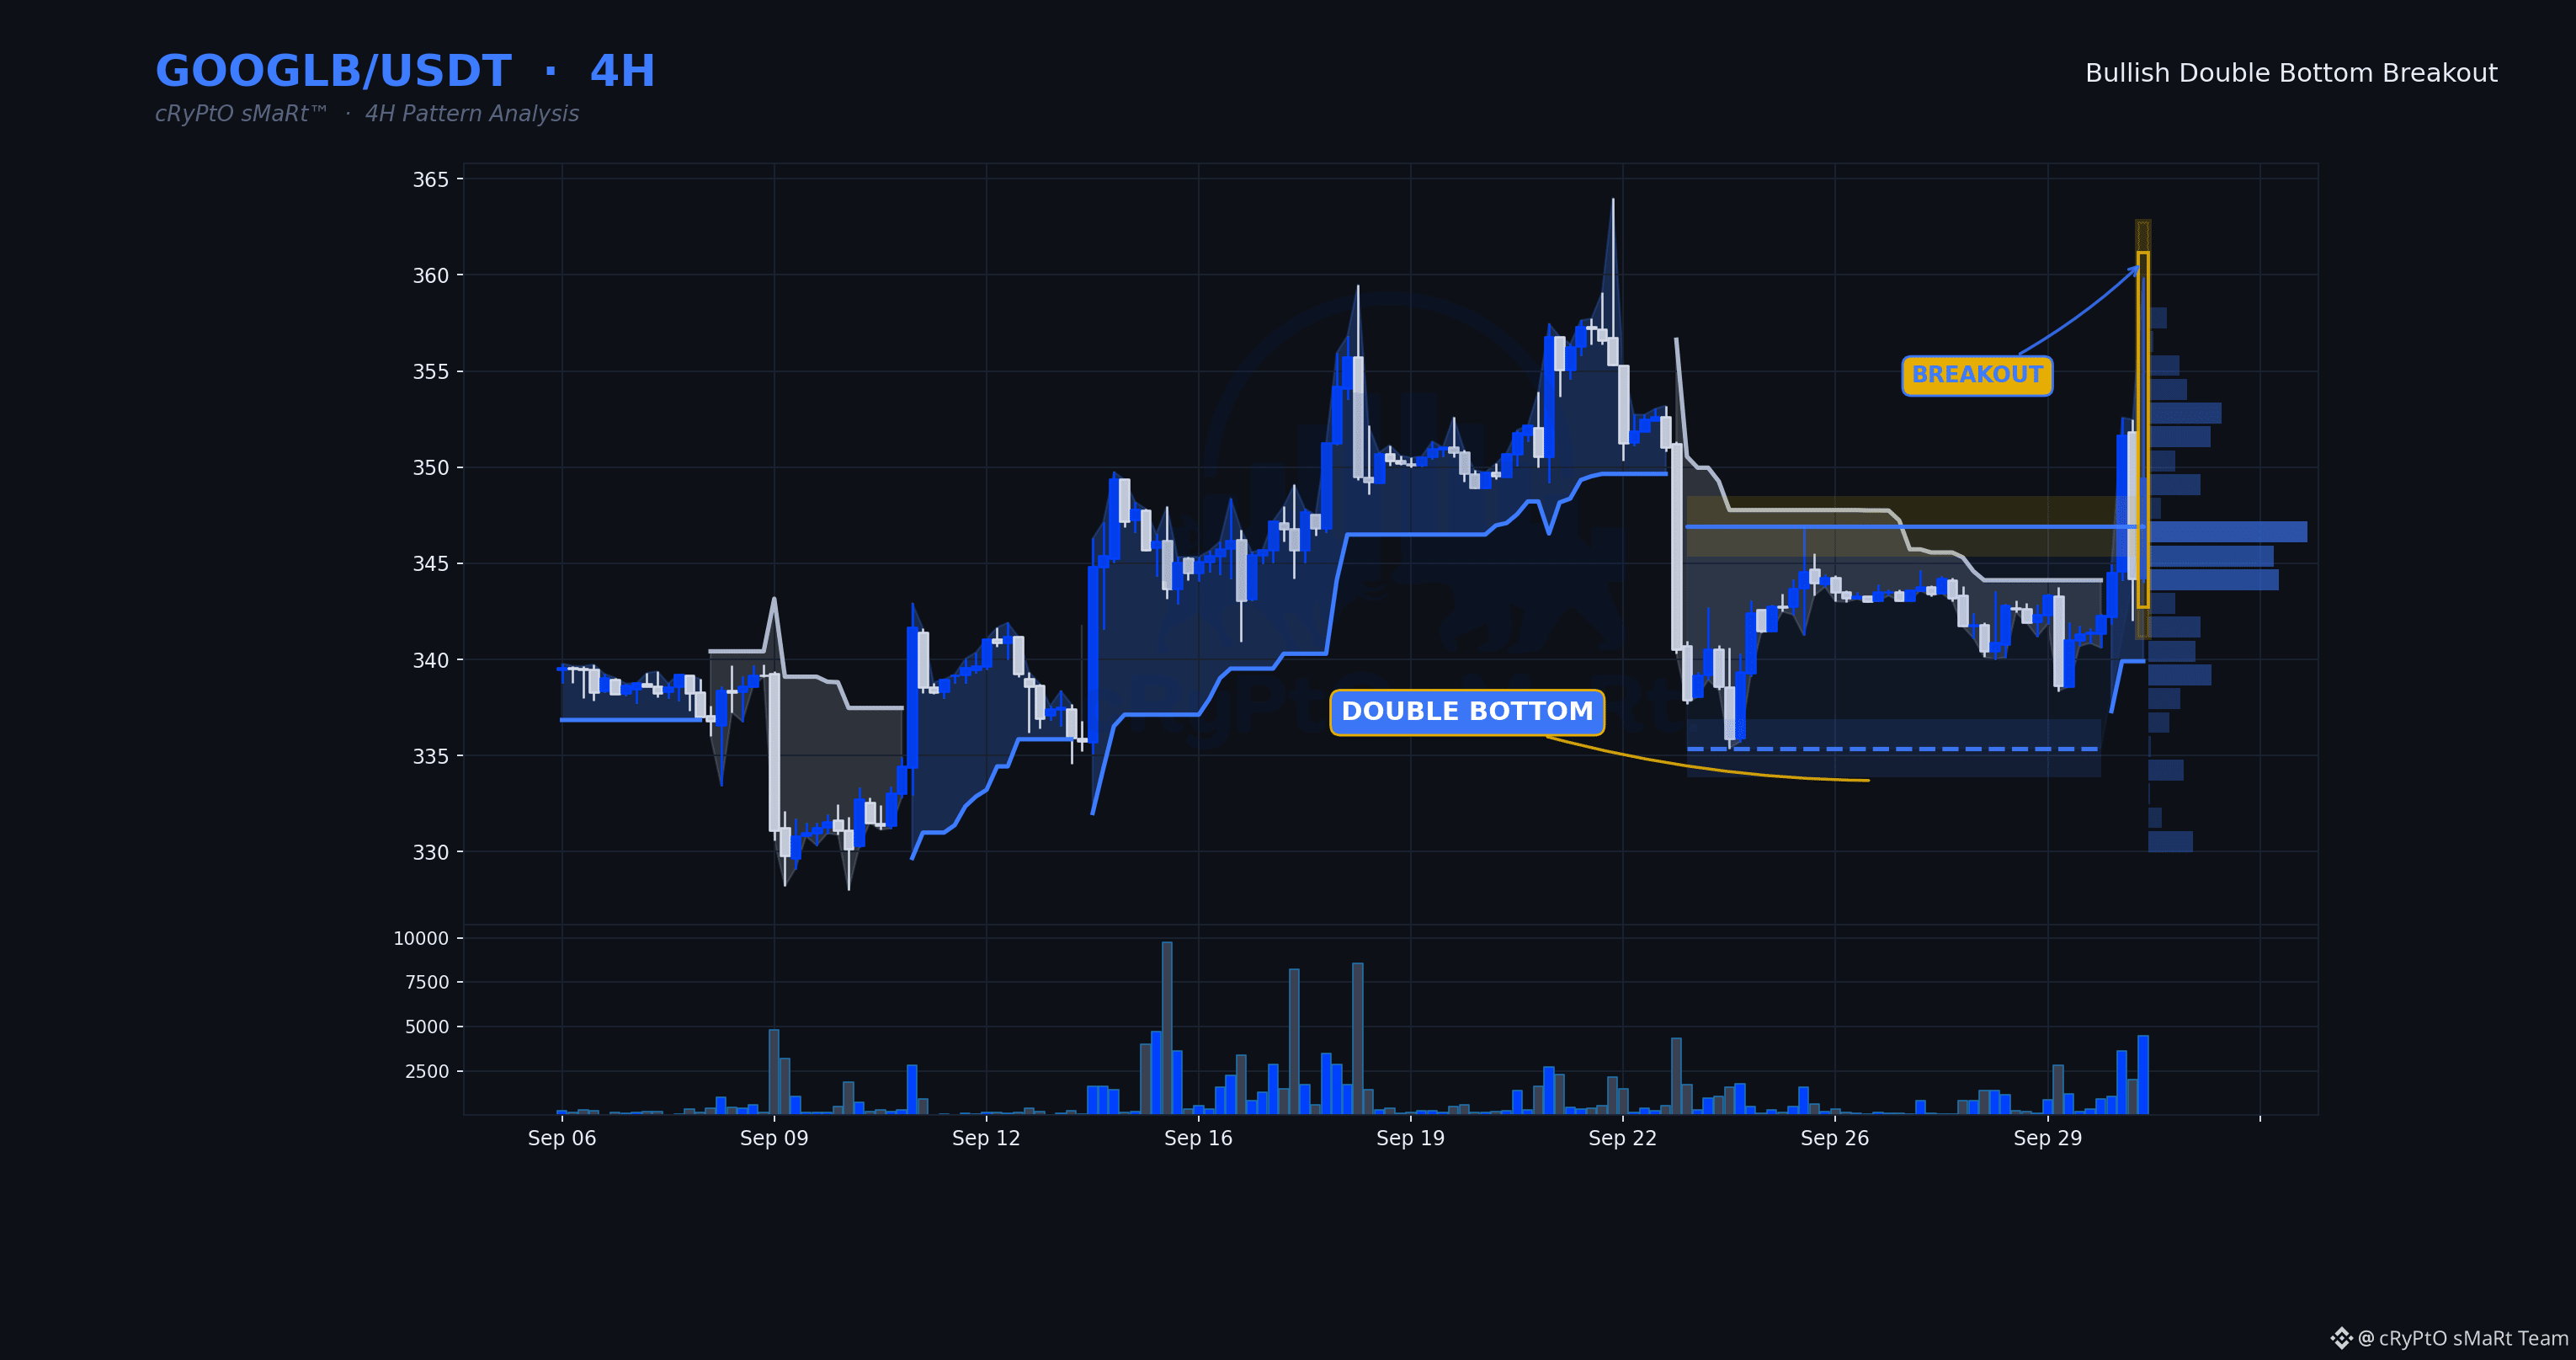
Double bottom resolving with a decisive breakout, and the volume behind it confirms real participation, not a thin push. Momentum still has room, which matters — this isn't a move already stretched into exhaustion.
🗓 Daily: Bullish — daily Supertrend up, price holding above the 50 EMA
⏱ 4H: Double Bottom · Bullish bias
⏳ 1H: price is above the level but the 1H trend hasn't turned up yet — a 1H close that flips the trend up is the trigger.
📋 WHY IT QUALIFIES
✓ Double Bottom structure completed
✓ Decisive breakout — closed 0.7% beyond the line
✓ Volume 3.8× its 20-bar average
✓ RSI 60 — momentum confirms, not yet exhausted
🧭 Bias: Bullish while price holds above $346.9300
⚠️ Invalidation: 4H close back below $346.9300
🔵 Support $335.3800 🟡 Resistance $346.9300
$GOOGLB $BTC #ChartPatterns
Education only, not financial advice.
Double bottom resolving with a decisive breakout, and the volume behind it confirms real participation, not a thin push. Momentum still has room, which matters — this isn't a move already stretched into exhaustion.
🗓 Daily: Bullish — daily Supertrend up, price holding above the 50 EMA
⏱ 4H: Double Bottom · Bullish bias
⏳ 1H: price is above the level but the 1H trend hasn't turned up yet — a 1H close that flips the trend up is the trigger.
📋 WHY IT QUALIFIES
✓ Double Bottom structure completed
✓ Decisive breakout — closed 0.7% beyond the line
✓ Volume 3.8× its 20-bar average
✓ RSI 60 — momentum confirms, not yet exhausted
🧭 Bias: Bullish while price holds above $346.9300
⚠️ Invalidation: 4H close back below $346.9300
🔵 Support $335.3800 🟡 Resistance $346.9300
$GOOGLB $BTC #ChartPatterns
Education only, not financial advice.
🗓 Daily: Bullish — daily Supertrend up, price holding above the 50 EMA
⏱ 4H: Double Bottom · Bullish bias
⏳ 1H: price is above the level but the 1H trend hasn't turned up yet — a 1H close that flips the trend up is the trigger.
📋 WHY IT QUALIFIES
✓ Double Bottom structure completed
✓ Decisive breakout — closed 0.7% beyond the line
✓ Volume 3.8× its 20-bar average
✓ RSI 60 — momentum confirms, not yet exhausted
🧭 Bias: Bullish while price holds above $346.9300
⚠️ Invalidation: 4H close back below $346.9300
🔵 Support $335.3800 🟡 Resistance $346.9300
$GOOGLB $BTC #ChartPatterns
Education only, not financial advice.
115

4. Analyse Technique : Identifier les ruptures de tendance 📊
Support brisé : Que faire en cas de cassure par le bas ? 📉⚡
Lorsqu'un niveau de support majeur cède, le cours bascule souvent dans une phase d'invalidation.
🔑 Comment réagir professionnellement :
Ne cherchez pas à "moyennez à la baisse" immédiatement : Attendez que le prix trouve une vraie zone de consolidation.
Observez le retest : Un ancien support brisé devient fréquemment une nouvelle résistance. C'est l'endroit idéal pour réévaluer ou réduire son exposition.
Privilégiez les ordres Limit : Évitez les ordres Market au milieu de la volatilité pour ne pas subir de glissement de prix (slippage).
La patience reste l'indicateur technique le plus rentable.
#TechnicalAnalysis #ChartPatterns #SpotTrading #Binance #CryptoStrategy @Square-Creator-ce2378404
4. Analyse Technique : Identifier les ruptures de tendance 📊
Support brisé : Que faire en cas de cassure par le bas ? 📉⚡
Lorsqu'un niveau de support majeur cède, le cours bascule souvent dans une phase d'invalidation.
🔑 Comment réagir professionnellement :
Ne cherchez pas à "moyennez à la baisse" immédiatement : Attendez que le prix trouve une vraie zone de consolidation.
Observez le retest : Un ancien support brisé devient fréquemment une nouvelle résistance. C'est l'endroit idéal pour réévaluer ou réduire son exposition.
Privilégiez les ordres Limit : Évitez les ordres Market au milieu de la volatilité pour ne pas subir de glissement de prix (slippage).
La patience reste l'indicateur technique le plus rentable.
#TechnicalAnalysis #ChartPatterns #SpotTrading #Binance #CryptoStrategy @BNB
Support brisé : Que faire en cas de cassure par le bas ? 📉⚡
Lorsqu'un niveau de support majeur cède, le cours bascule souvent dans une phase d'invalidation.
🔑 Comment réagir professionnellement :
Ne cherchez pas à "moyennez à la baisse" immédiatement : Attendez que le prix trouve une vraie zone de consolidation.
Observez le retest : Un ancien support brisé devient fréquemment une nouvelle résistance. C'est l'endroit idéal pour réévaluer ou réduire son exposition.
Privilégiez les ordres Limit : Évitez les ordres Market au milieu de la volatilité pour ne pas subir de glissement de prix (slippage).
La patience reste l'indicateur technique le plus rentable.
#TechnicalAnalysis #ChartPatterns #SpotTrading #Binance #CryptoStrategy @BNB
41

·
--
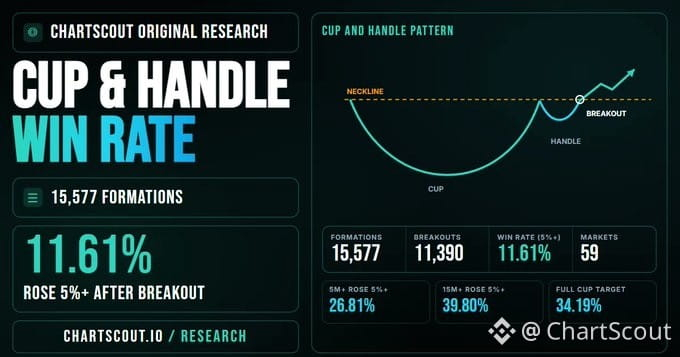
Do Cup & Handle breakouts really work in crypto?
We analyzed 15,577 formations across 59 Binance markets to measure what happened after the breakout not what the textbook says should happen.
The results vary sharply by timeframe.
Read the full study, methodology, results, and limitations:
https://chartscout.io/cup-and-handle-win-rate-crypto-study
#cryptotrading #TechnicalAnalysis #chartpatterns
Do Cup & Handle breakouts really work in crypto?
We analyzed 15,577 formations across 59 Binance markets to measure what happened after the breakout not what the textbook says should happen.
The results vary sharply by timeframe.
Read the full study, methodology, results, and limitations:
https://chartscout.io/cup-and-handle-win-rate-crypto-study
#cryptotrading #TechnicalAnalysis #chartpatterns
We analyzed 15,577 formations across 59 Binance markets to measure what happened after the breakout not what the textbook says should happen.
The results vary sharply by timeframe.
Read the full study, methodology, results, and limitations:
https://chartscout.io/cup-and-handle-win-rate-crypto-study
#cryptotrading #TechnicalAnalysis #chartpatterns
1
2
9.1k

·
--
တက်ရိပ်ရှိသည်
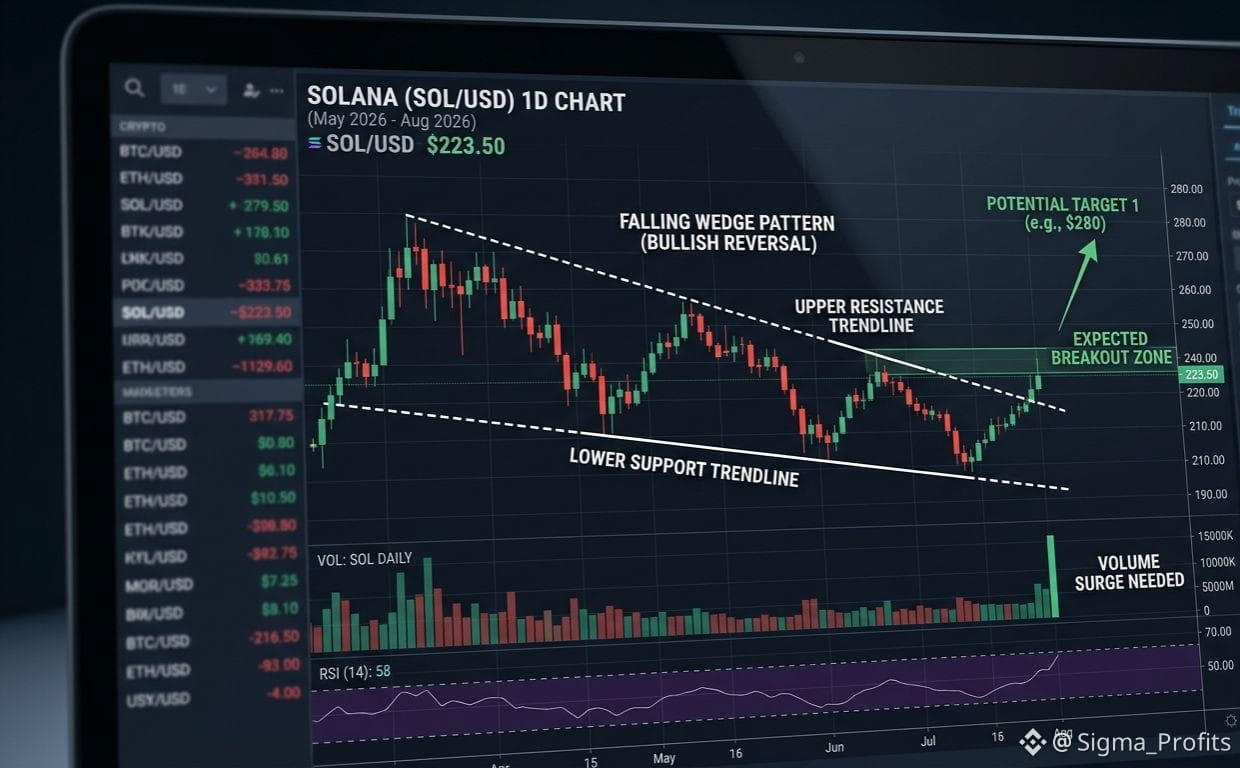
📈 Technical Breakdown: Bullish Falling Wedge on $SOL ⚡
Solana ($SOL) is currently forming a textbook Falling Wedge pattern on the higher timeframes — a classic technical structure that signals potential trend reversal and bullish momentum!
🔍 Key Technical Observations:
• Pattern Structure: Price is making lower highs and lower lows within converging trendlines, indicating selling pressure is exhausting.
• Volume Profile: Trading volume has been steadily declining during the contraction, suggesting a volatility squeeze is near.
• Key Resistance: Watch for a decisive break above the upper trendline, ideally confirmed by a surge in volume.
🎯 How Traders Approach This Pattern:
1️⃣ Breakout Entry: Wait for a daily candle close above resistance.
2️⃣ Retest Entry: Look for a pullback to the broken trendline (turning old resistance into new support).
3️⃣ Target Projection: Measure the widest distance of the wedge and project it upward from the breakout point.
What’s your strategy on $SOL right now? Are you holding or waiting for the breakout? Let’s discuss below! 👇
#Solana #SOL #TechnicalAnalysis #CryptoTrading #ChartPatterns #BinanceSquare
#SolanaUSTD
📈 Technical Breakdown: Bullish Falling Wedge on $SOL ⚡
Solana ($SOL) is currently forming a textbook Falling Wedge pattern on the higher timeframes — a classic technical structure that signals potential trend reversal and bullish momentum!
🔍 Key Technical Observations:
• Pattern Structure: Price is making lower highs and lower lows within converging trendlines, indicating selling pressure is exhausting.
• Volume Profile: Trading volume has been steadily declining during the contraction, suggesting a volatility squeeze is near.
• Key Resistance: Watch for a decisive break above the upper trendline, ideally confirmed by a surge in volume.
🎯 How Traders Approach This Pattern:
1️⃣ Breakout Entry: Wait for a daily candle close above resistance.
2️⃣ Retest Entry: Look for a pullback to the broken trendline (turning old resistance into new support).
3️⃣ Target Projection: Measure the widest distance of the wedge and project it upward from the breakout point.
What’s your strategy on $SOL right now? Are you holding or waiting for the breakout? Let’s discuss below! 👇
#Solana #SOL #TechnicalAnalysis #CryptoTrading #ChartPatterns #BinanceSquare
#SolanaUSTD
Solana ($SOL) is currently forming a textbook Falling Wedge pattern on the higher timeframes — a classic technical structure that signals potential trend reversal and bullish momentum!
🔍 Key Technical Observations:
• Pattern Structure: Price is making lower highs and lower lows within converging trendlines, indicating selling pressure is exhausting.
• Volume Profile: Trading volume has been steadily declining during the contraction, suggesting a volatility squeeze is near.
• Key Resistance: Watch for a decisive break above the upper trendline, ideally confirmed by a surge in volume.
🎯 How Traders Approach This Pattern:
1️⃣ Breakout Entry: Wait for a daily candle close above resistance.
2️⃣ Retest Entry: Look for a pullback to the broken trendline (turning old resistance into new support).
3️⃣ Target Projection: Measure the widest distance of the wedge and project it upward from the breakout point.
What’s your strategy on $SOL right now? Are you holding or waiting for the breakout? Let’s discuss below! 👇
#Solana #SOL #TechnicalAnalysis #CryptoTrading #ChartPatterns #BinanceSquare
#SolanaUSTD
68
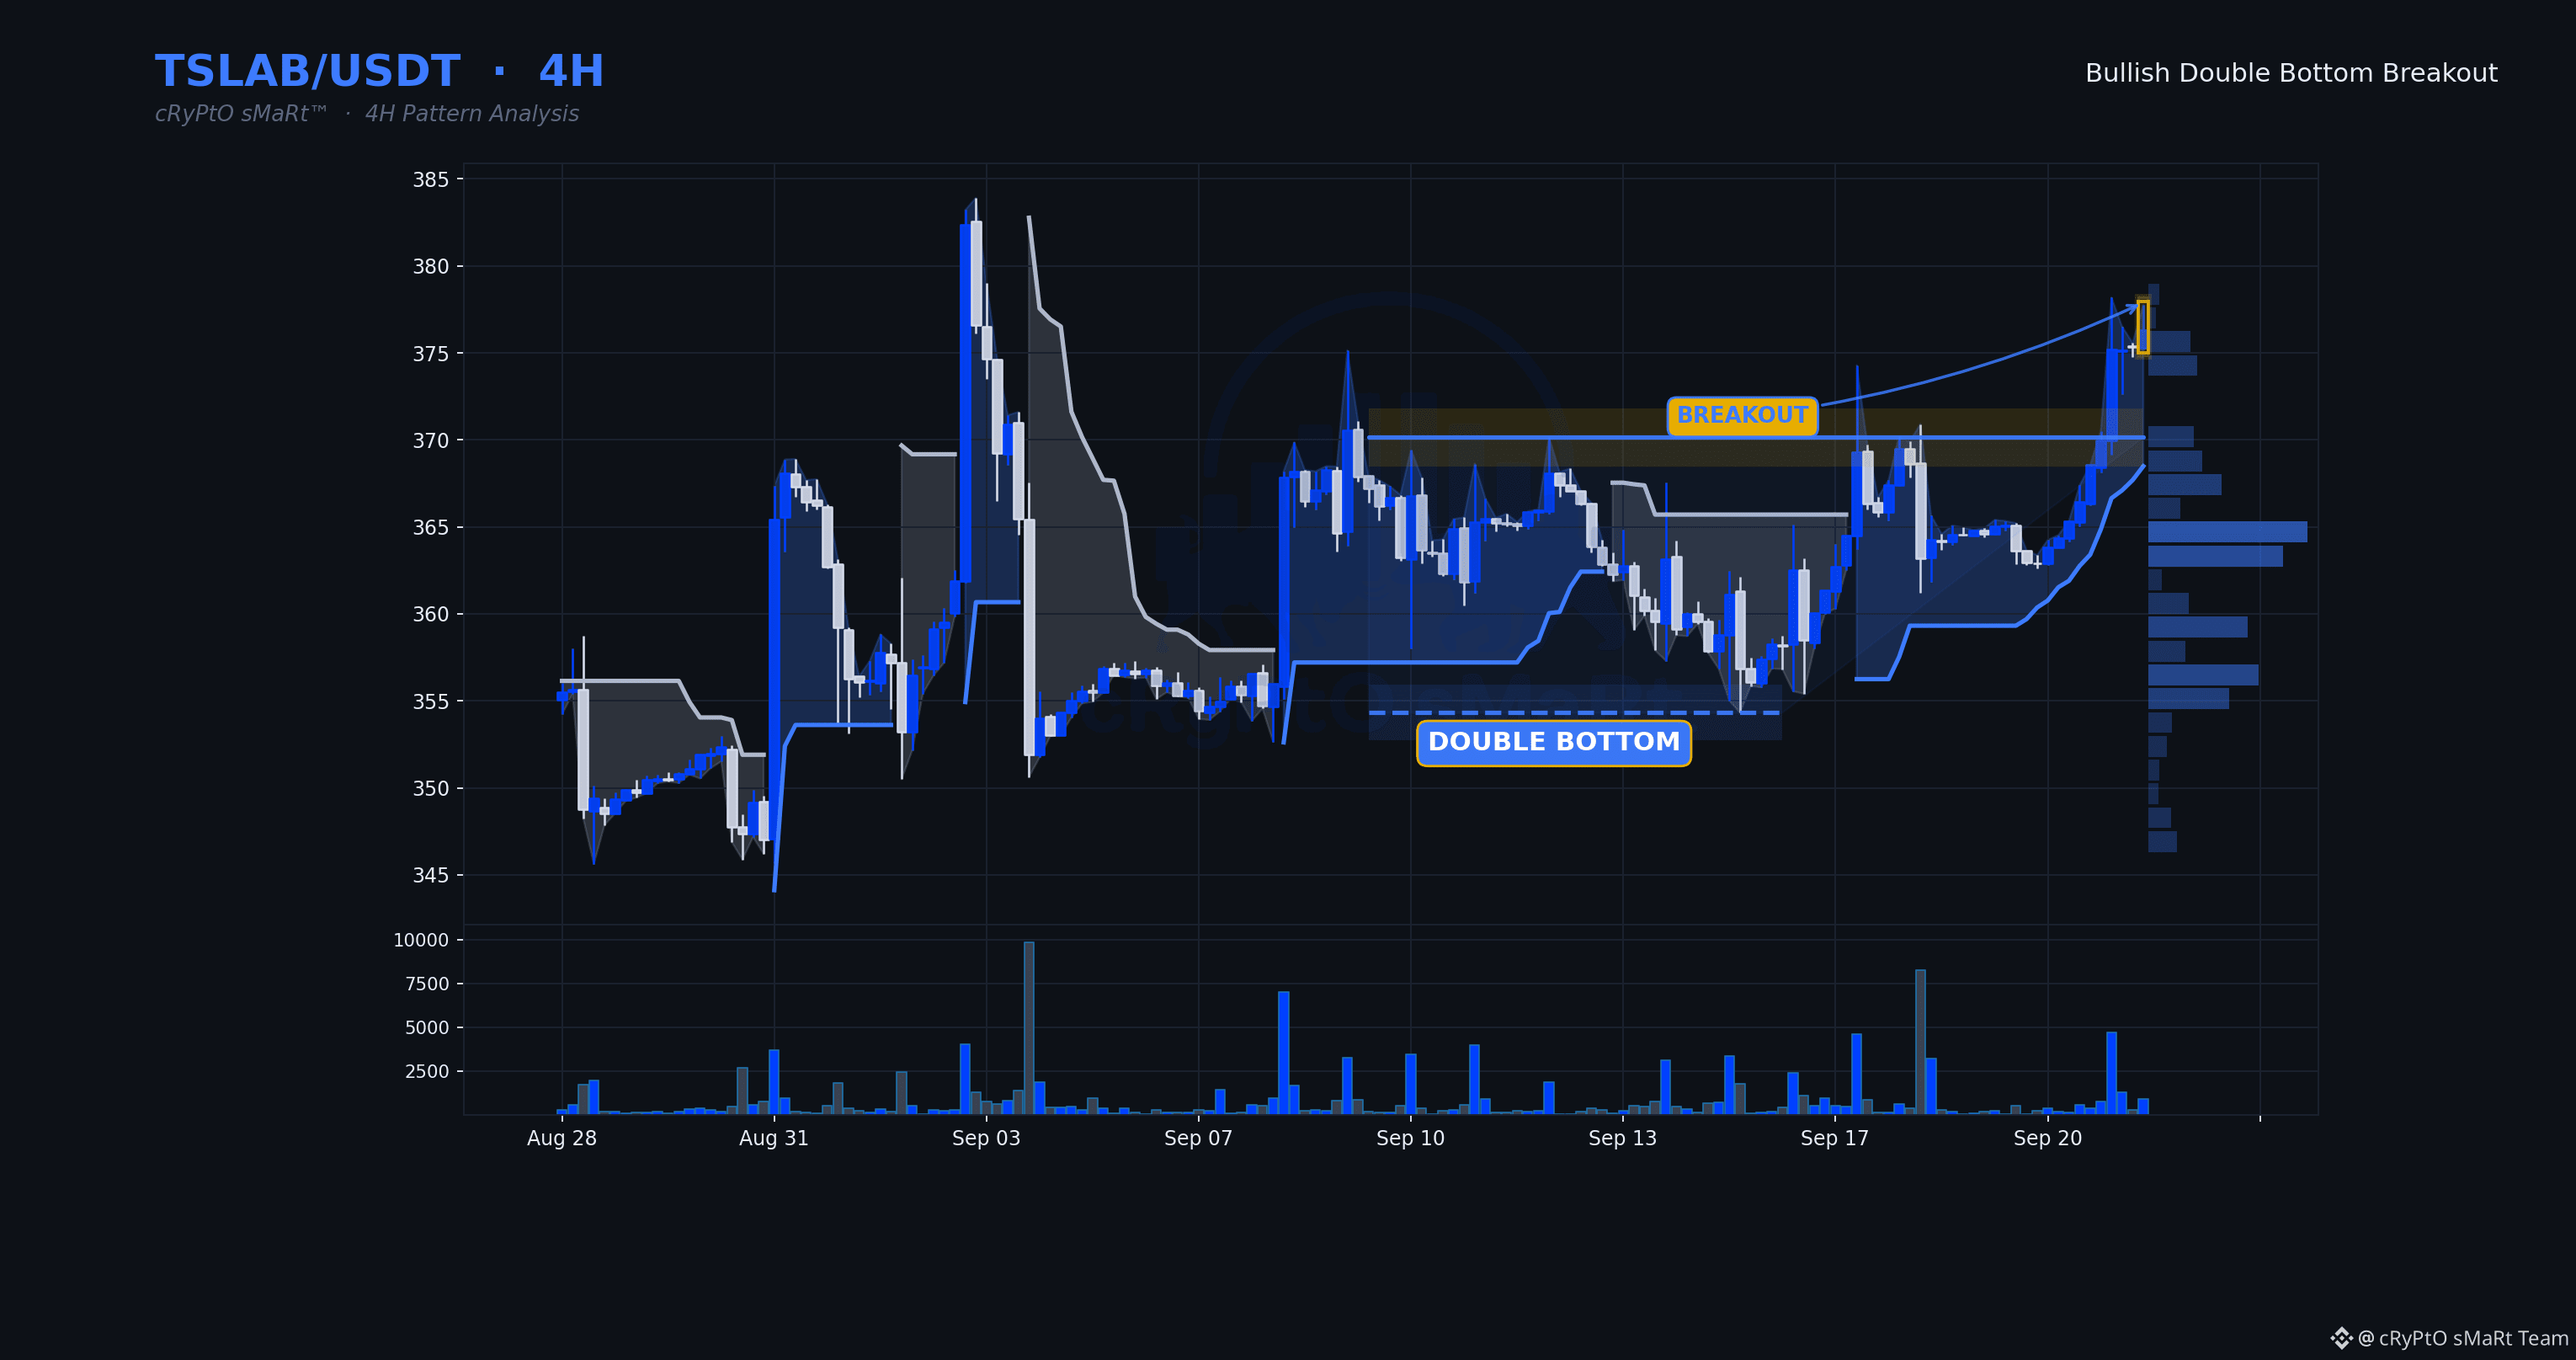
Two failed pushes lower, buyers stepped in both times at the same shelf, and now the breakout comes on volume that actually backs it. That's not a drift higher, that's demand showing up with intent.
🗓 Daily: Bullish — daily Supertrend up, price holding above the 50 EMA
⏱ 4H: Double Bottom · Bullish bias
⏳ 1H: the 1H is holding above the level with its trend up — the lower timeframe confirms the setup.
✅ Daily, 4H and 1H all point bullish.
📋 WHY IT QUALIFIES
✓ Double Bottom structure completed
✓ Decisive breakout — closed 1.7% beyond the line
✓ Volume 1.6× its 20-bar average
✓ RSI 76 — momentum confirms, not yet exhausted
🧭 Bias: Bullish while price holds above $370.1400
⚠️ Invalidation: 4H close back below $370.1400
🔵 Support $354.3200 🟡 Resistance $370.1400
$TSLAB $BTC #ChartPatterns
Education only, not financial advice.
Two failed pushes lower, buyers stepped in both times at the same shelf, and now the breakout comes on volume that actually backs it. That's not a drift higher, that's demand showing up with intent.
🗓 Daily: Bullish — daily Supertrend up, price holding above the 50 EMA
⏱ 4H: Double Bottom · Bullish bias
⏳ 1H: the 1H is holding above the level with its trend up — the lower timeframe confirms the setup.
✅ Daily, 4H and 1H all point bullish.
📋 WHY IT QUALIFIES
✓ Double Bottom structure completed
✓ Decisive breakout — closed 1.7% beyond the line
✓ Volume 1.6× its 20-bar average
✓ RSI 76 — momentum confirms, not yet exhausted
🧭 Bias: Bullish while price holds above $370.1400
⚠️ Invalidation: 4H close back below $370.1400
🔵 Support $354.3200 🟡 Resistance $370.1400
$TSLAB $BTC #ChartPatterns
Education only, not financial advice.
🗓 Daily: Bullish — daily Supertrend up, price holding above the 50 EMA
⏱ 4H: Double Bottom · Bullish bias
⏳ 1H: the 1H is holding above the level with its trend up — the lower timeframe confirms the setup.
✅ Daily, 4H and 1H all point bullish.
📋 WHY IT QUALIFIES
✓ Double Bottom structure completed
✓ Decisive breakout — closed 1.7% beyond the line
✓ Volume 1.6× its 20-bar average
✓ RSI 76 — momentum confirms, not yet exhausted
🧭 Bias: Bullish while price holds above $370.1400
⚠️ Invalidation: 4H close back below $370.1400
🔵 Support $354.3200 🟡 Resistance $370.1400
$TSLAB $BTC #ChartPatterns
Education only, not financial advice.
75
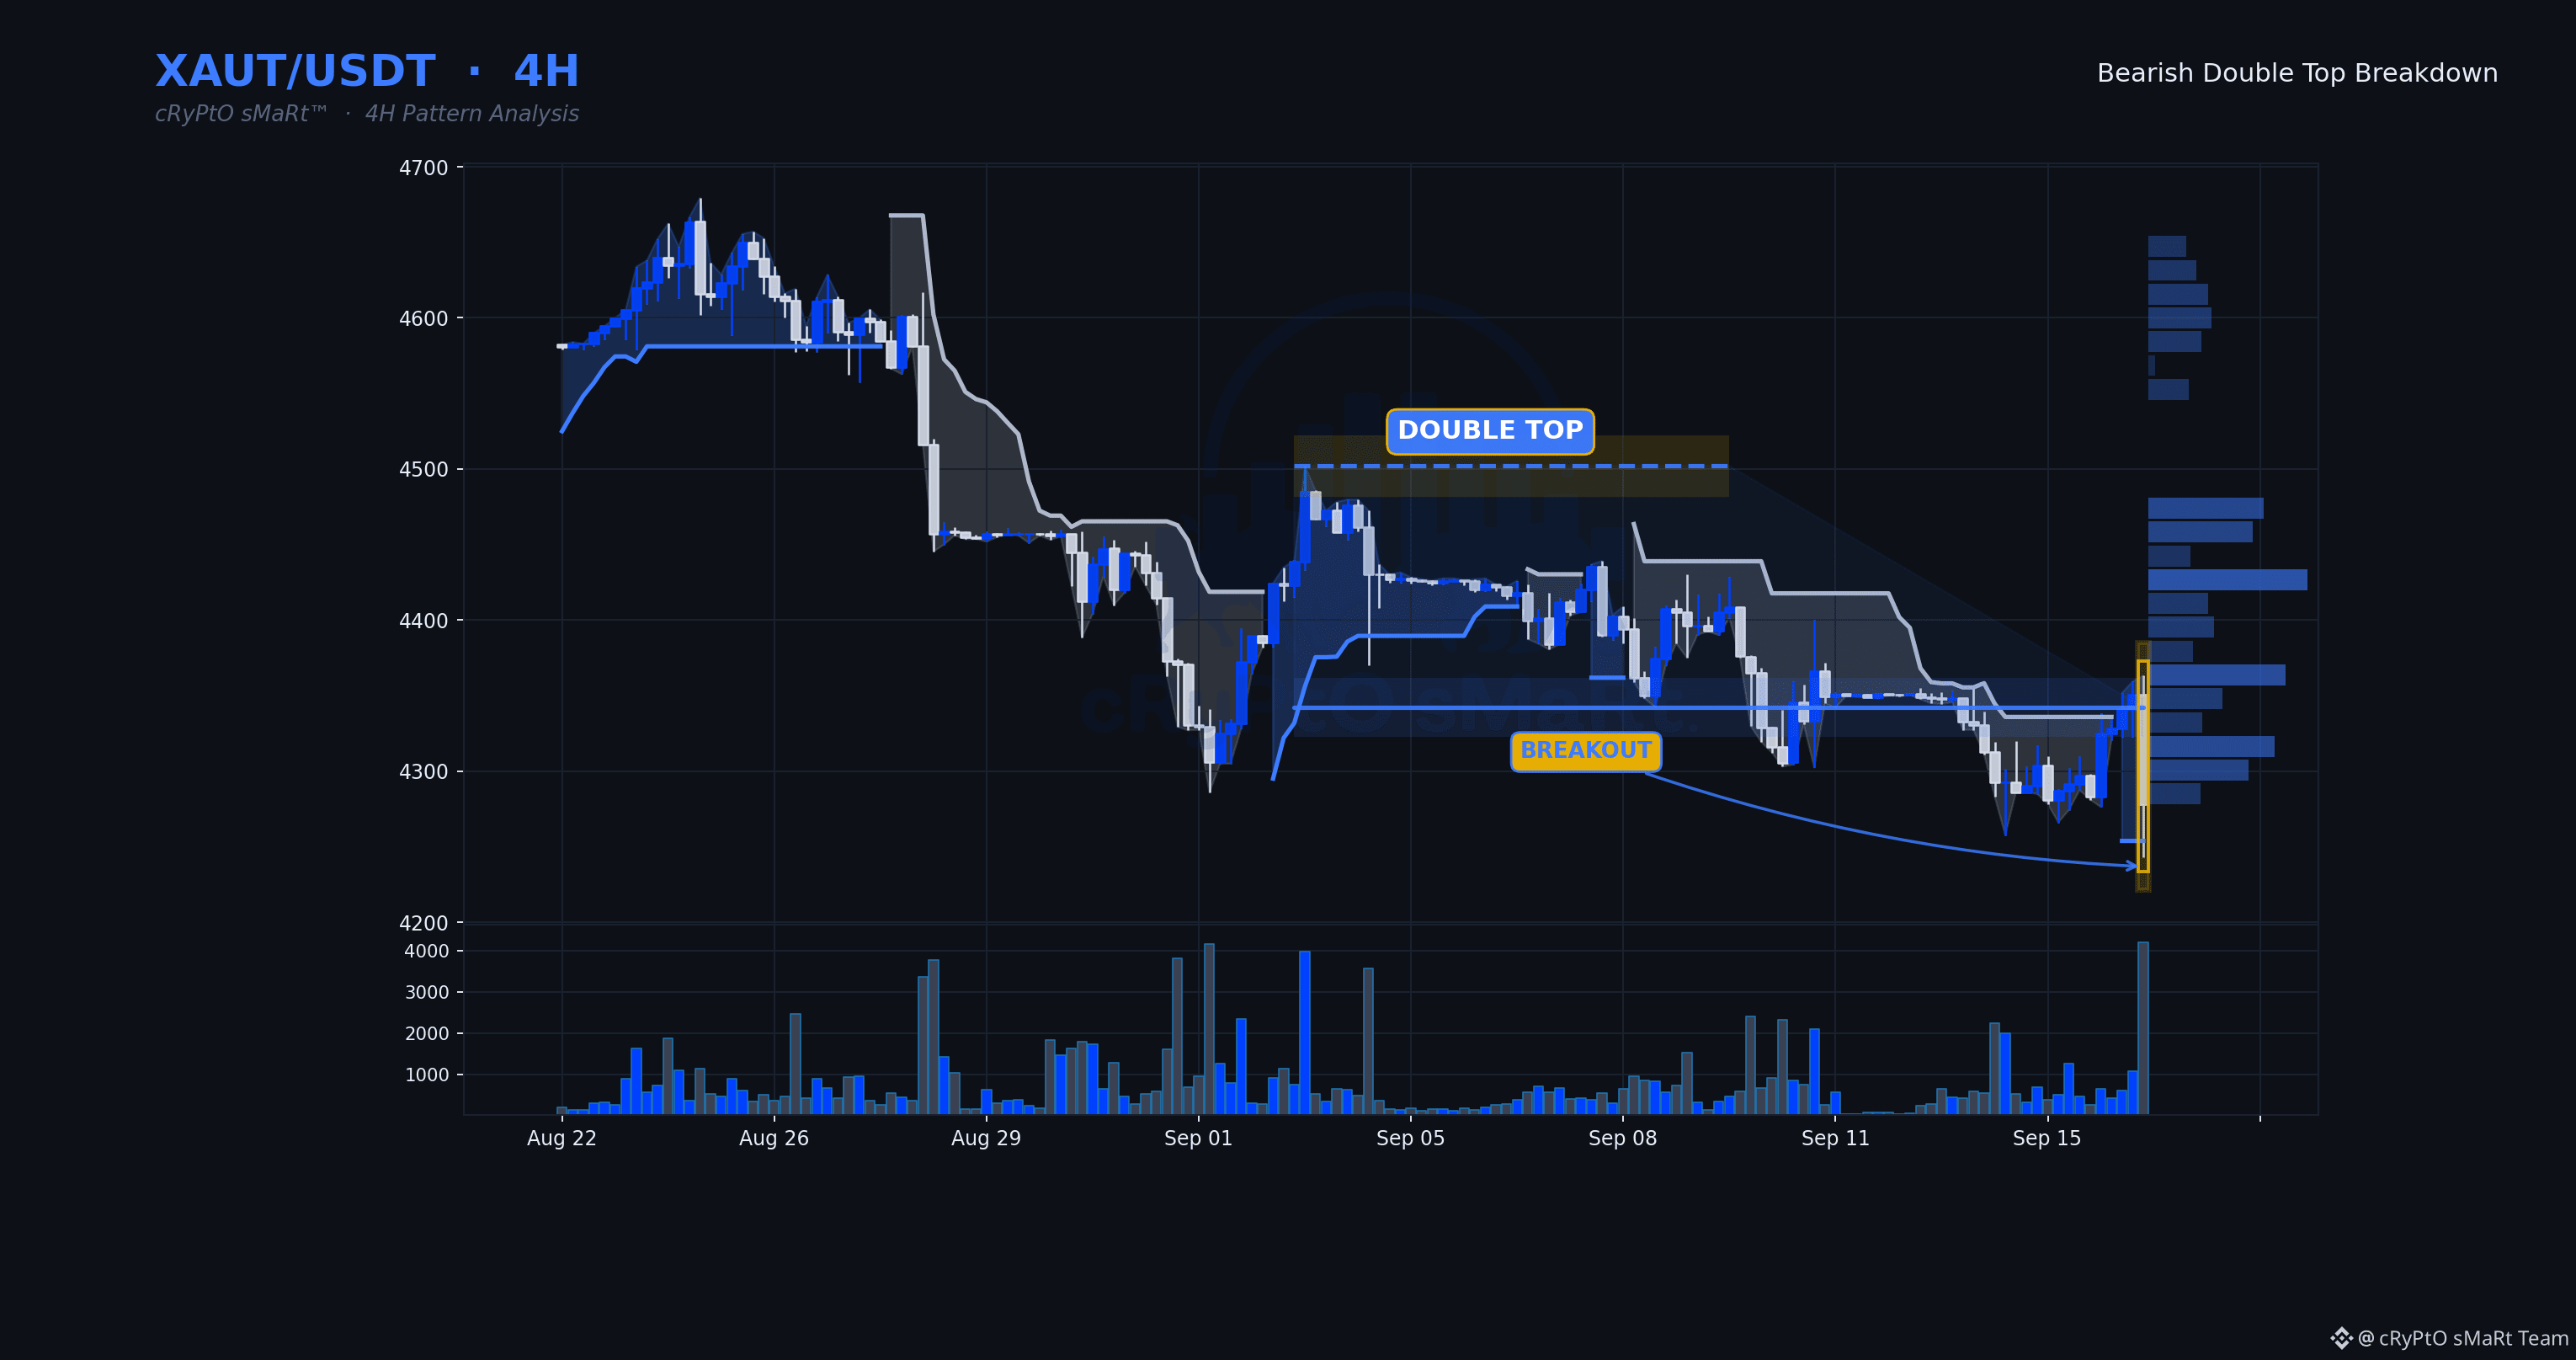
Sellers just took control of a level that buyers had defended twice — that's not a random poke, that's structure failing on real participation.
🗓 Daily: Bearish — daily Supertrend down, price under the 50 EMA
⏱ 4H: Double Top · Bearish bias
⏳ 1H: the 1H is trading below the level with its trend down — the lower timeframe confirms the setup.
✅ Daily, 4H and 1H all point bearish.
📋 WHY IT QUALIFIES
✓ Double Top structure completed
✓ Decisive breakdown — closed 1.5% beyond the line
✓ Volume 4.6× its 20-bar average
✓ RSI 39 — momentum confirms, not yet exhausted
🧭 Bias: Bearish while price holds below $4,342.31
⚠️ Invalidation: 4H close back above $4,342.31
🔵 Support $4,342.31 🟡 Resistance $4,502.00
$XAUT $BTC #ChartPatterns
Education only, not financial advice.
Sellers just took control of a level that buyers had defended twice — that's not a random poke, that's structure failing on real participation.
🗓 Daily: Bearish — daily Supertrend down, price under the 50 EMA
⏱ 4H: Double Top · Bearish bias
⏳ 1H: the 1H is trading below the level with its trend down — the lower timeframe confirms the setup.
✅ Daily, 4H and 1H all point bearish.
📋 WHY IT QUALIFIES
✓ Double Top structure completed
✓ Decisive breakdown — closed 1.5% beyond the line
✓ Volume 4.6× its 20-bar average
✓ RSI 39 — momentum confirms, not yet exhausted
🧭 Bias: Bearish while price holds below $4,342.31
⚠️ Invalidation: 4H close back above $4,342.31
🔵 Support $4,342.31 🟡 Resistance $4,502.00
$XAUT $BTC #ChartPatterns
Education only, not financial advice.
🗓 Daily: Bearish — daily Supertrend down, price under the 50 EMA
⏱ 4H: Double Top · Bearish bias
⏳ 1H: the 1H is trading below the level with its trend down — the lower timeframe confirms the setup.
✅ Daily, 4H and 1H all point bearish.
📋 WHY IT QUALIFIES
✓ Double Top structure completed
✓ Decisive breakdown — closed 1.5% beyond the line
✓ Volume 4.6× its 20-bar average
✓ RSI 39 — momentum confirms, not yet exhausted
🧭 Bias: Bearish while price holds below $4,342.31
⚠️ Invalidation: 4H close back above $4,342.31
🔵 Support $4,342.31 🟡 Resistance $4,502.00
$XAUT $BTC #ChartPatterns
Education only, not financial advice.
123
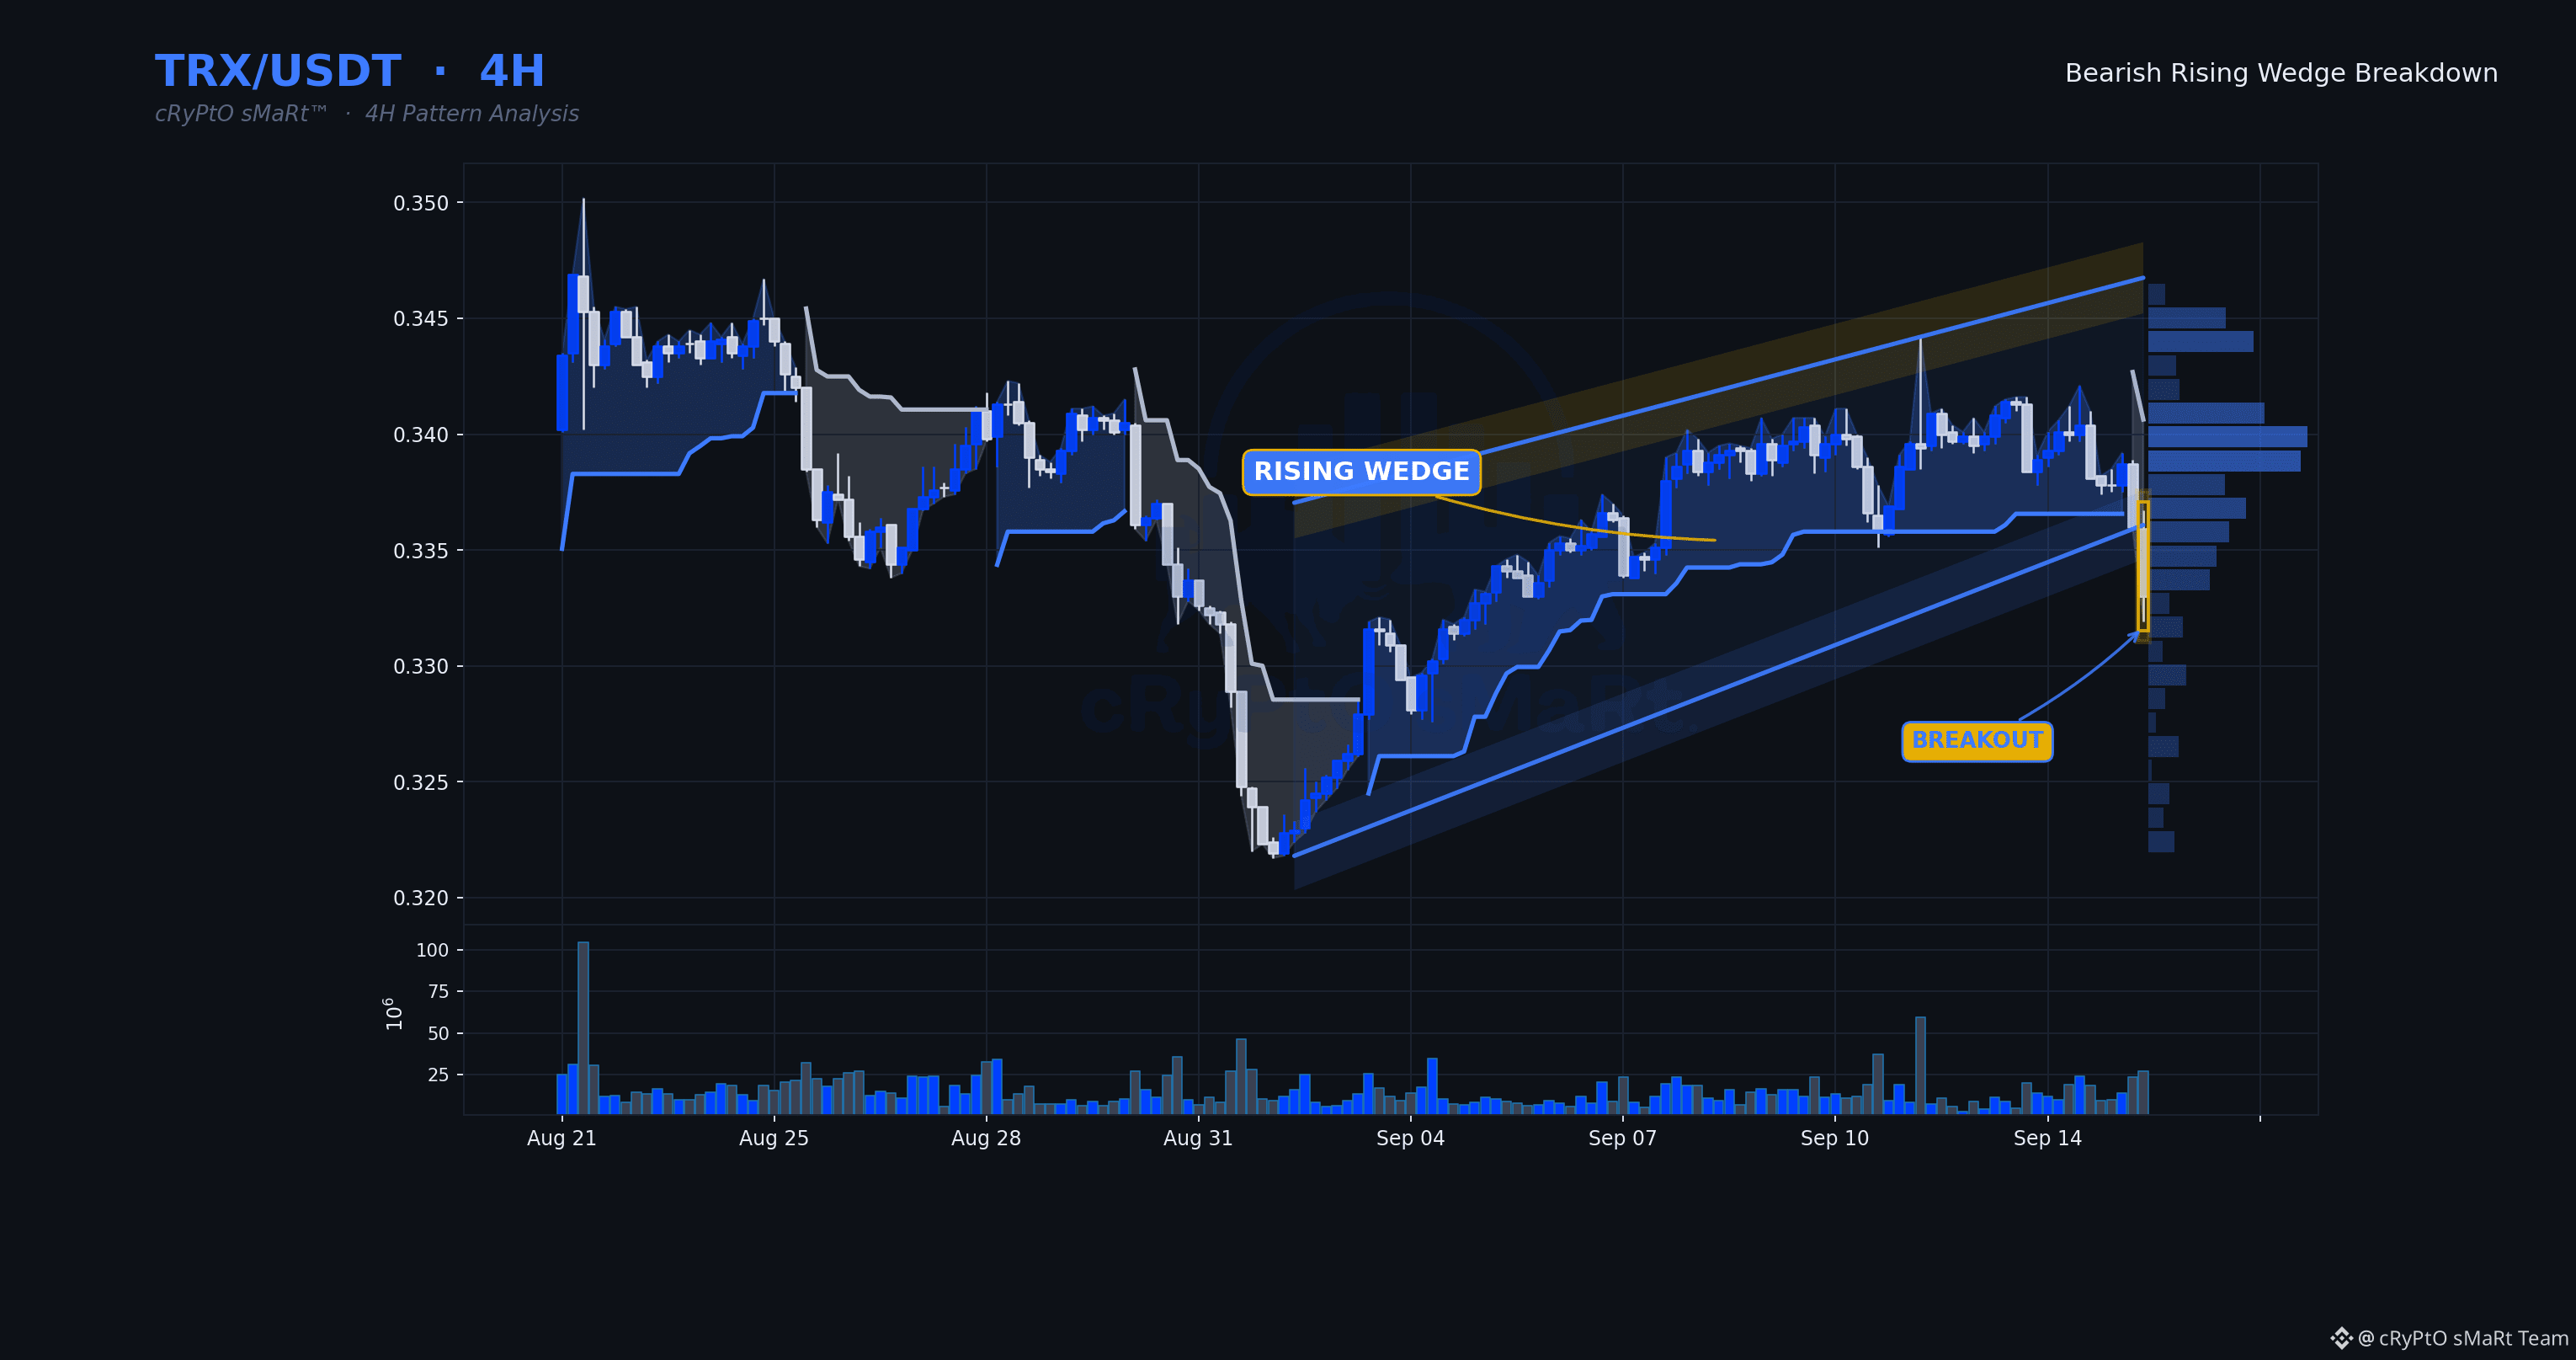
TRX just cracked the floor of a rising wedge, and it didn't tiptoe out — this was a decisive break on volume well above average, the kind of participation that separates a real structural shift from a liquidity poke.
🗓 Daily: Neutral — daily is mixed — Supertrend and EMAs not aligned
⏱ 4H: Rising Wedge · Bearish bias
⏳ 1H: the 1H is trading below the level with its trend down — the lower timeframe confirms the setup.
📋 WHY IT QUALIFIES
✓ Rising Wedge structure completed
✓ Decisive breakdown — closed 0.9% beyond the line
✓ Volume 2.1× its 20-bar average
✓ RSI 30 — momentum confirms, not yet exhausted
🧭 Bias: Bearish while price holds below $0.33608
⚠️ Invalidation: 4H close back above $0.33608
🔵 Support $0.33608 🟡 Resistance $0.34675
$TRX $BTC #ChartPatterns
Education only, not financial advice.
TRX just cracked the floor of a rising wedge, and it didn't tiptoe out — this was a decisive break on volume well above average, the kind of participation that separates a real structural shift from a liquidity poke.
🗓 Daily: Neutral — daily is mixed — Supertrend and EMAs not aligned
⏱ 4H: Rising Wedge · Bearish bias
⏳ 1H: the 1H is trading below the level with its trend down — the lower timeframe confirms the setup.
📋 WHY IT QUALIFIES
✓ Rising Wedge structure completed
✓ Decisive breakdown — closed 0.9% beyond the line
✓ Volume 2.1× its 20-bar average
✓ RSI 30 — momentum confirms, not yet exhausted
🧭 Bias: Bearish while price holds below $0.33608
⚠️ Invalidation: 4H close back above $0.33608
🔵 Support $0.33608 🟡 Resistance $0.34675
$TRX $BTC #ChartPatterns
Education only, not financial advice.
🗓 Daily: Neutral — daily is mixed — Supertrend and EMAs not aligned
⏱ 4H: Rising Wedge · Bearish bias
⏳ 1H: the 1H is trading below the level with its trend down — the lower timeframe confirms the setup.
📋 WHY IT QUALIFIES
✓ Rising Wedge structure completed
✓ Decisive breakdown — closed 0.9% beyond the line
✓ Volume 2.1× its 20-bar average
✓ RSI 30 — momentum confirms, not yet exhausted
🧭 Bias: Bearish while price holds below $0.33608
⚠️ Invalidation: 4H close back above $0.33608
🔵 Support $0.33608 🟡 Resistance $0.34675
$TRX $BTC #ChartPatterns
Education only, not financial advice.
22
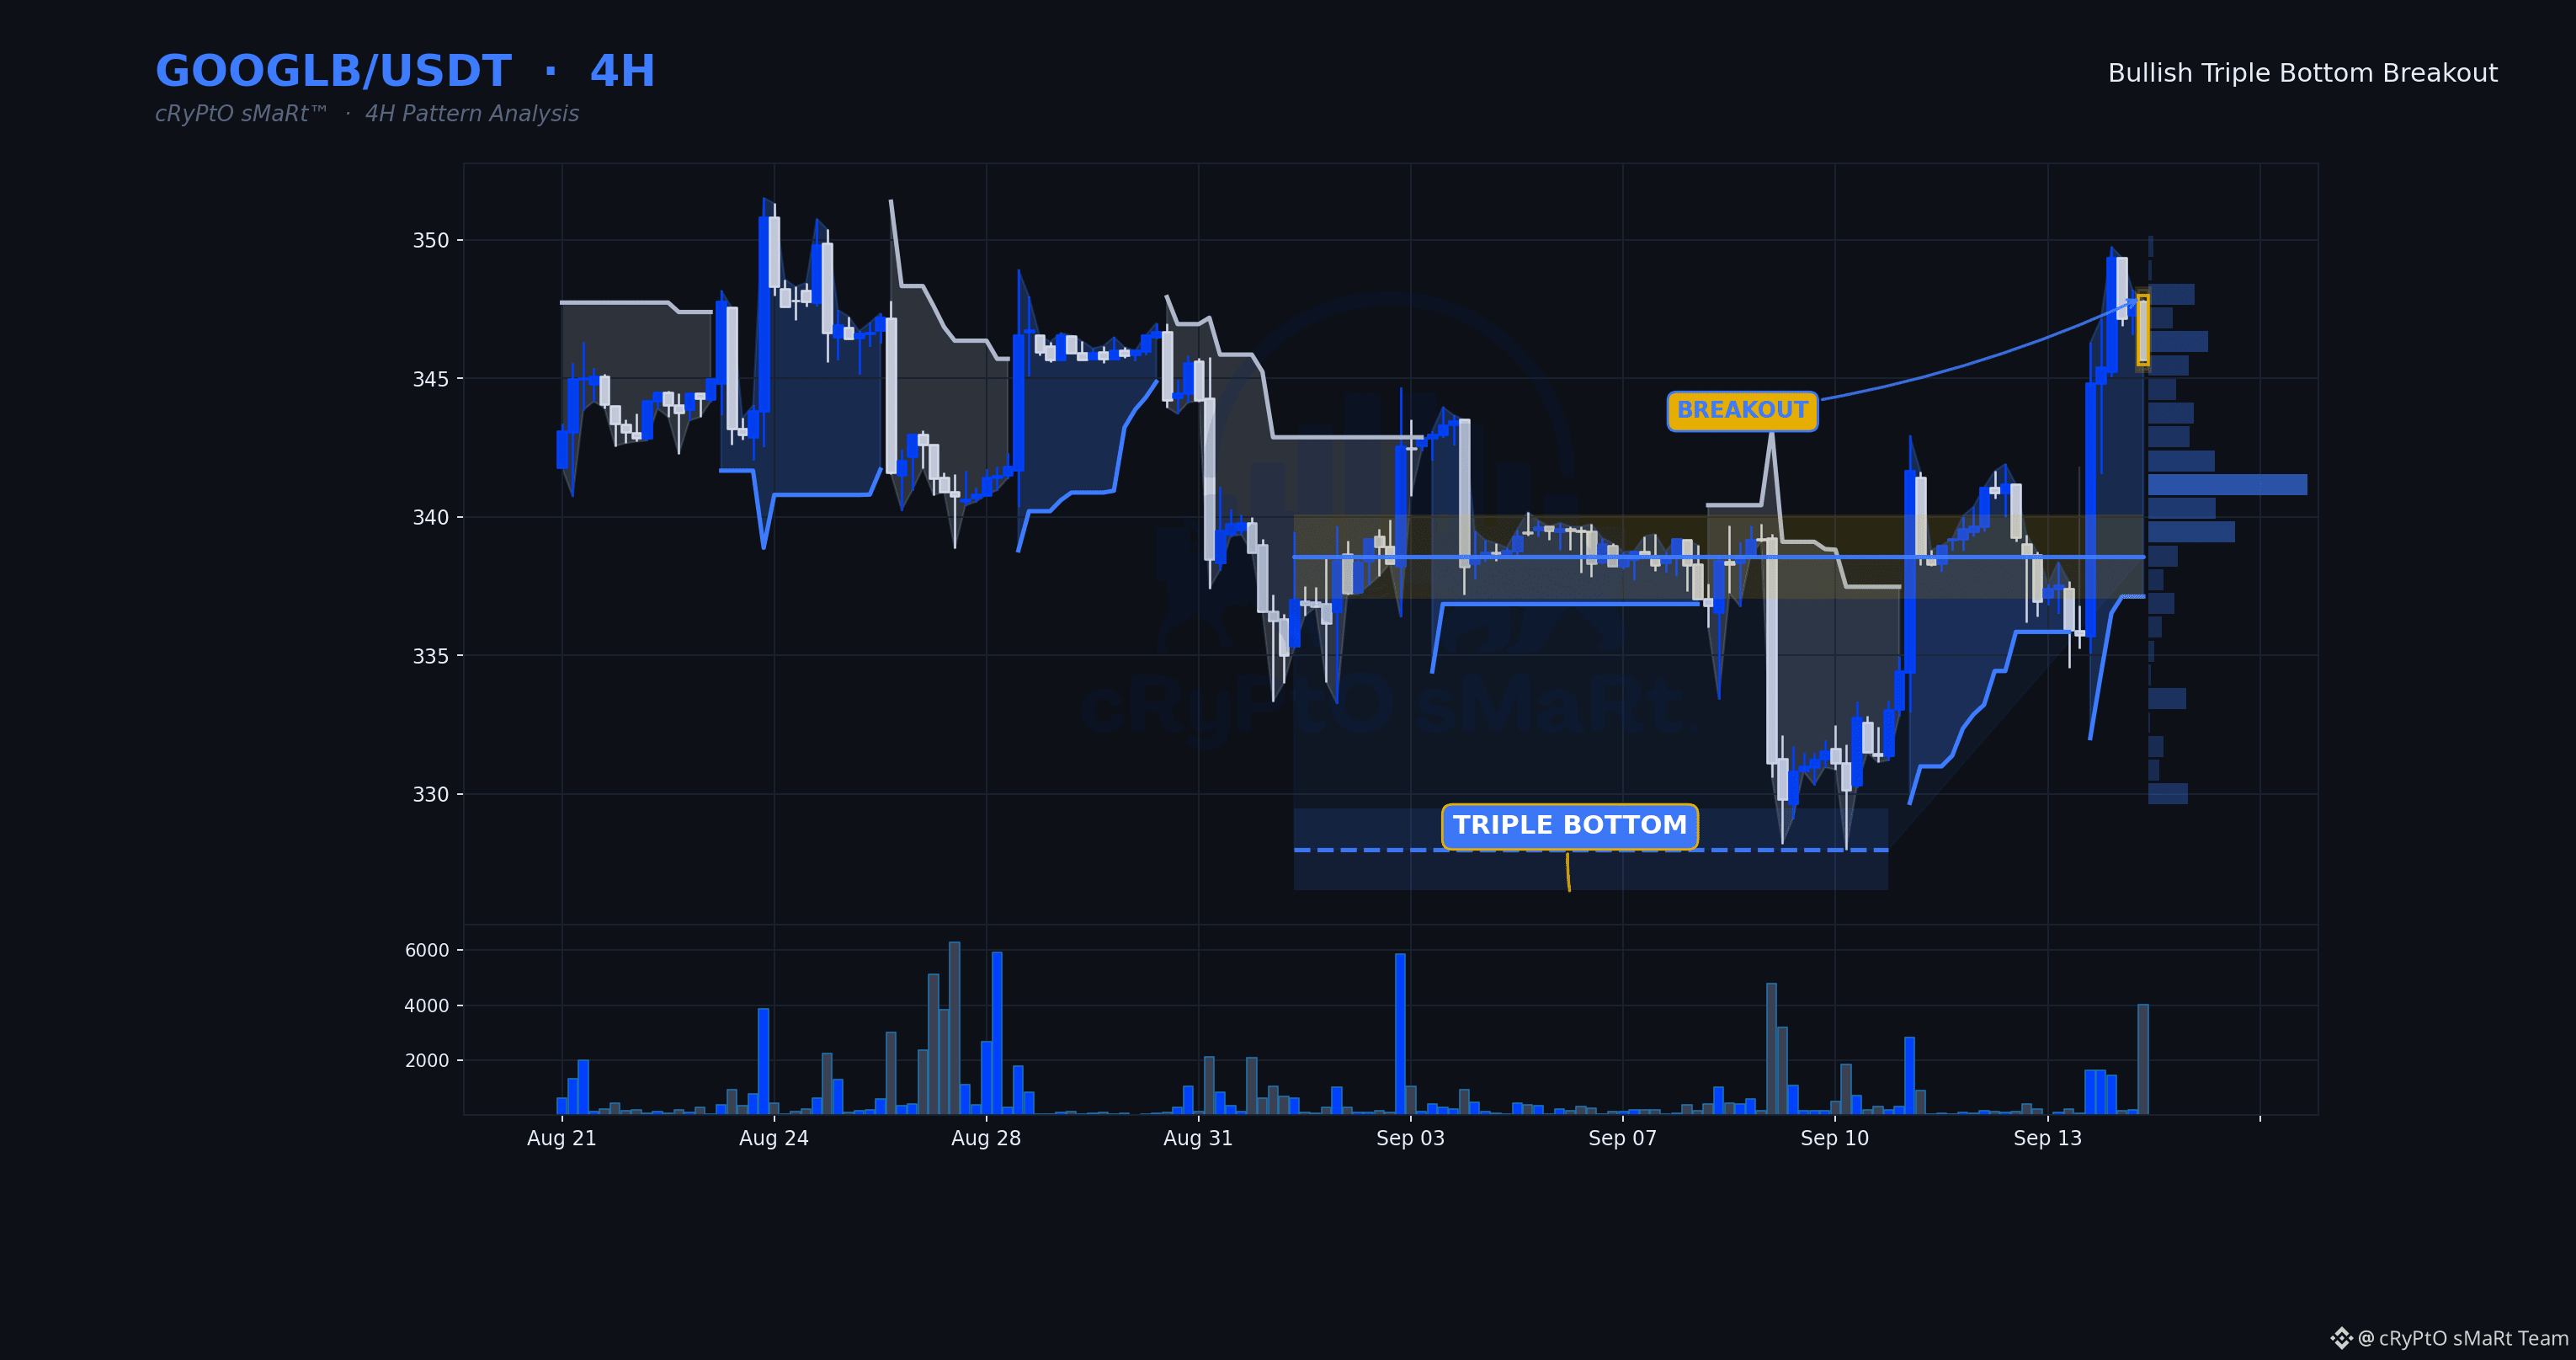
Buyers just took a level that had rejected three separate tests and cleared it with real force, not a half-hearted poke. The volume behind this breakout is well above average, which tells you this wasn't thin-book drift, it was conviction stepping in exactly where sellers had previously won.
🗓 Daily: Neutral — daily is mixed — Supertrend and EMAs not aligned
⏱ 4H: Triple Bottom · Bullish bias
⏳ 1H: the 1H is holding above the level with its trend up — the lower timeframe confirms the setup.
📋 WHY IT QUALIFIES
✓ Triple Bottom structure completed
✓ Decisive breakout — closed 2.1% beyond the line
✓ Volume 7.3× its 20-bar average
✓ RSI 61 — momentum confirms, not yet exhausted
🧭 Bias: Bullish while price holds above $338.5750
⚠️ Invalidation: 4H close back below $338.5750
🔵 Support $328.0000 🟡 Resistance $338.5750
$GOOGLB $BTC #ChartPatterns
Education only, not financial advice.
Buyers just took a level that had rejected three separate tests and cleared it with real force, not a half-hearted poke. The volume behind this breakout is well above average, which tells you this wasn't thin-book drift, it was conviction stepping in exactly where sellers had previously won.
🗓 Daily: Neutral — daily is mixed — Supertrend and EMAs not aligned
⏱ 4H: Triple Bottom · Bullish bias
⏳ 1H: the 1H is holding above the level with its trend up — the lower timeframe confirms the setup.
📋 WHY IT QUALIFIES
✓ Triple Bottom structure completed
✓ Decisive breakout — closed 2.1% beyond the line
✓ Volume 7.3× its 20-bar average
✓ RSI 61 — momentum confirms, not yet exhausted
🧭 Bias: Bullish while price holds above $338.5750
⚠️ Invalidation: 4H close back below $338.5750
🔵 Support $328.0000 🟡 Resistance $338.5750
$GOOGLB $BTC #ChartPatterns
Education only, not financial advice.
🗓 Daily: Neutral — daily is mixed — Supertrend and EMAs not aligned
⏱ 4H: Triple Bottom · Bullish bias
⏳ 1H: the 1H is holding above the level with its trend up — the lower timeframe confirms the setup.
📋 WHY IT QUALIFIES
✓ Triple Bottom structure completed
✓ Decisive breakout — closed 2.1% beyond the line
✓ Volume 7.3× its 20-bar average
✓ RSI 61 — momentum confirms, not yet exhausted
🧭 Bias: Bullish while price holds above $338.5750
⚠️ Invalidation: 4H close back below $338.5750
🔵 Support $328.0000 🟡 Resistance $338.5750
$GOOGLB $BTC #ChartPatterns
Education only, not financial advice.
75
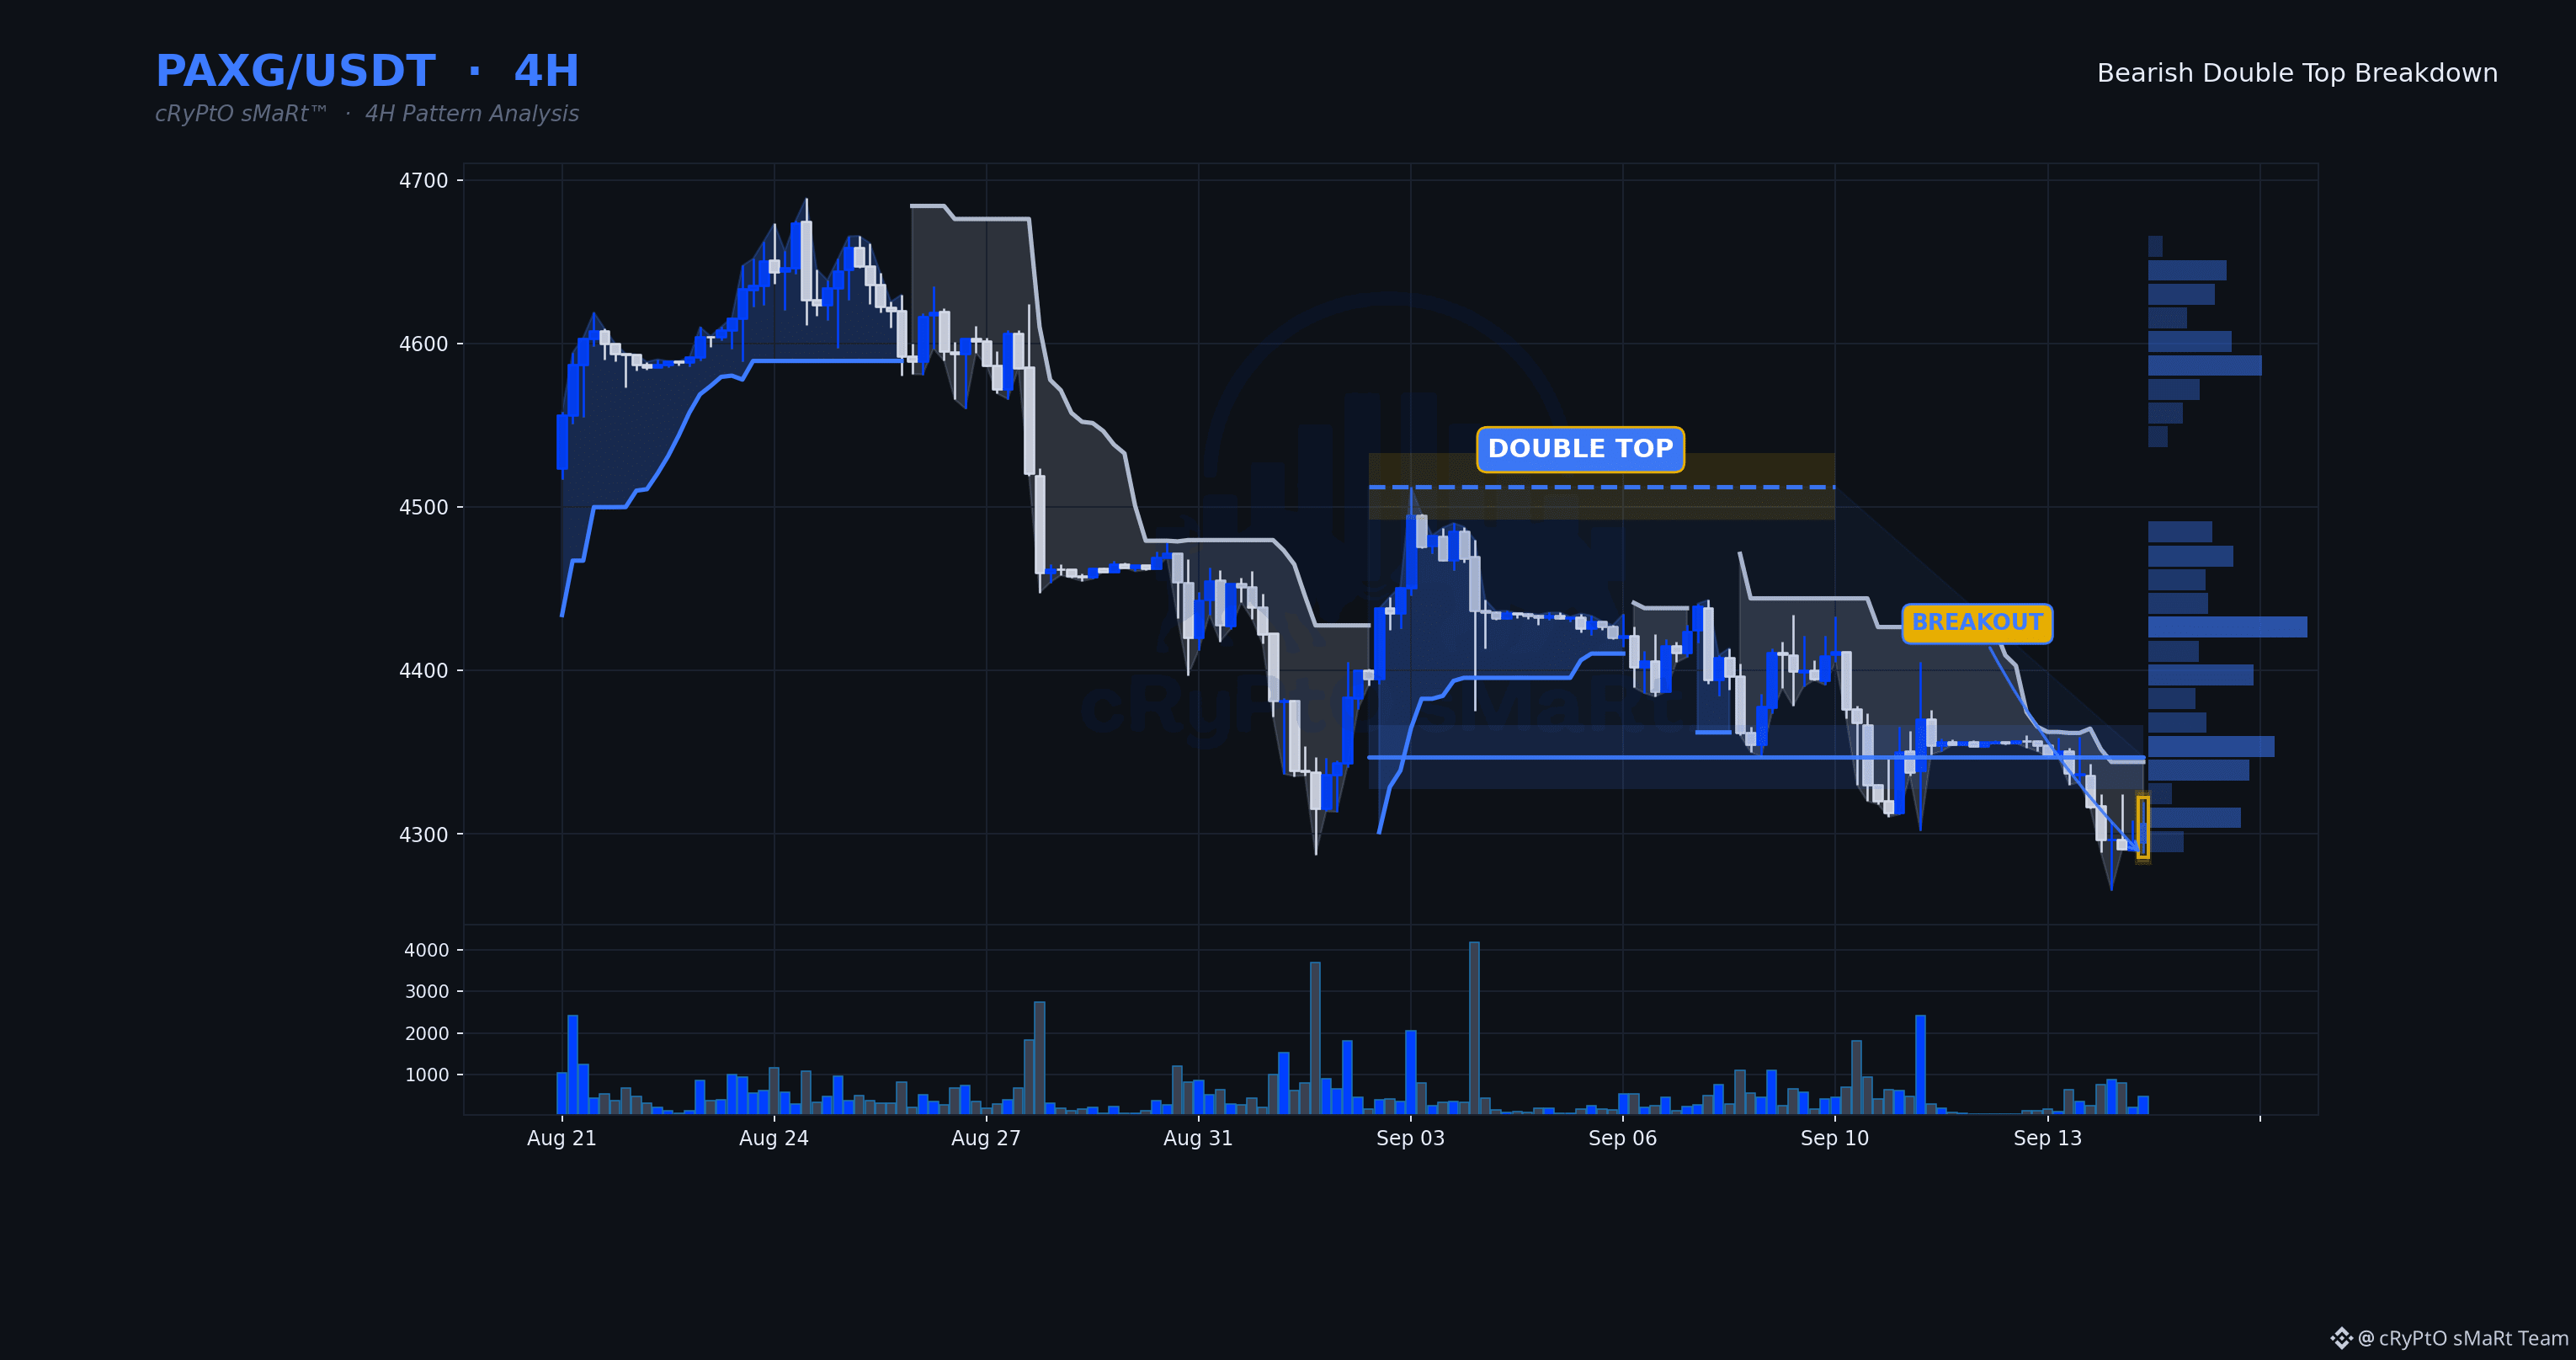
Sellers just took the neckline out cleanly, and the volume behind it says this wasn't a stop-run — real supply showed up at the top of that range and pressed it through. Momentum still has room to build, which means the market isn't stretched yet on this leg down.
🗓 Daily: Bearish — price below the daily Supertrend with a falling 50/200 EMA stack
⏱ 4H: Double Top · Bearish bias
⏳ 1H: the 1H is trading below the level with its trend down — the lower timeframe confirms the setup.
✅ Daily, 4H and 1H all point bearish.
📋 WHY IT QUALIFIES
✓ Double Top structure completed
✓ Decisive breakdown — closed 0.9% beyond the line
✓ Volume 1.7× its 20-bar average
✓ RSI 35 — momentum confirms, not yet exhausted
🧭 Bias: Bearish while price holds below $4,347.11
⚠️ Invalidation: 4H close back above $4,347.11
🔵 Support $4,347.11 🟡 Resistance $4,512.33
$PAXG $BTC #ChartPatterns
Education only, not financial advice.
Sellers just took the neckline out cleanly, and the volume behind it says this wasn't a stop-run — real supply showed up at the top of that range and pressed it through. Momentum still has room to build, which means the market isn't stretched yet on this leg down.
🗓 Daily: Bearish — price below the daily Supertrend with a falling 50/200 EMA stack
⏱ 4H: Double Top · Bearish bias
⏳ 1H: the 1H is trading below the level with its trend down — the lower timeframe confirms the setup.
✅ Daily, 4H and 1H all point bearish.
📋 WHY IT QUALIFIES
✓ Double Top structure completed
✓ Decisive breakdown — closed 0.9% beyond the line
✓ Volume 1.7× its 20-bar average
✓ RSI 35 — momentum confirms, not yet exhausted
🧭 Bias: Bearish while price holds below $4,347.11
⚠️ Invalidation: 4H close back above $4,347.11
🔵 Support $4,347.11 🟡 Resistance $4,512.33
$PAXG $BTC #ChartPatterns
Education only, not financial advice.
🗓 Daily: Bearish — price below the daily Supertrend with a falling 50/200 EMA stack
⏱ 4H: Double Top · Bearish bias
⏳ 1H: the 1H is trading below the level with its trend down — the lower timeframe confirms the setup.
✅ Daily, 4H and 1H all point bearish.
📋 WHY IT QUALIFIES
✓ Double Top structure completed
✓ Decisive breakdown — closed 0.9% beyond the line
✓ Volume 1.7× its 20-bar average
✓ RSI 35 — momentum confirms, not yet exhausted
🧭 Bias: Bearish while price holds below $4,347.11
⚠️ Invalidation: 4H close back above $4,347.11
🔵 Support $4,347.11 🟡 Resistance $4,512.33
$PAXG $BTC #ChartPatterns
Education only, not financial advice.
115

·
--
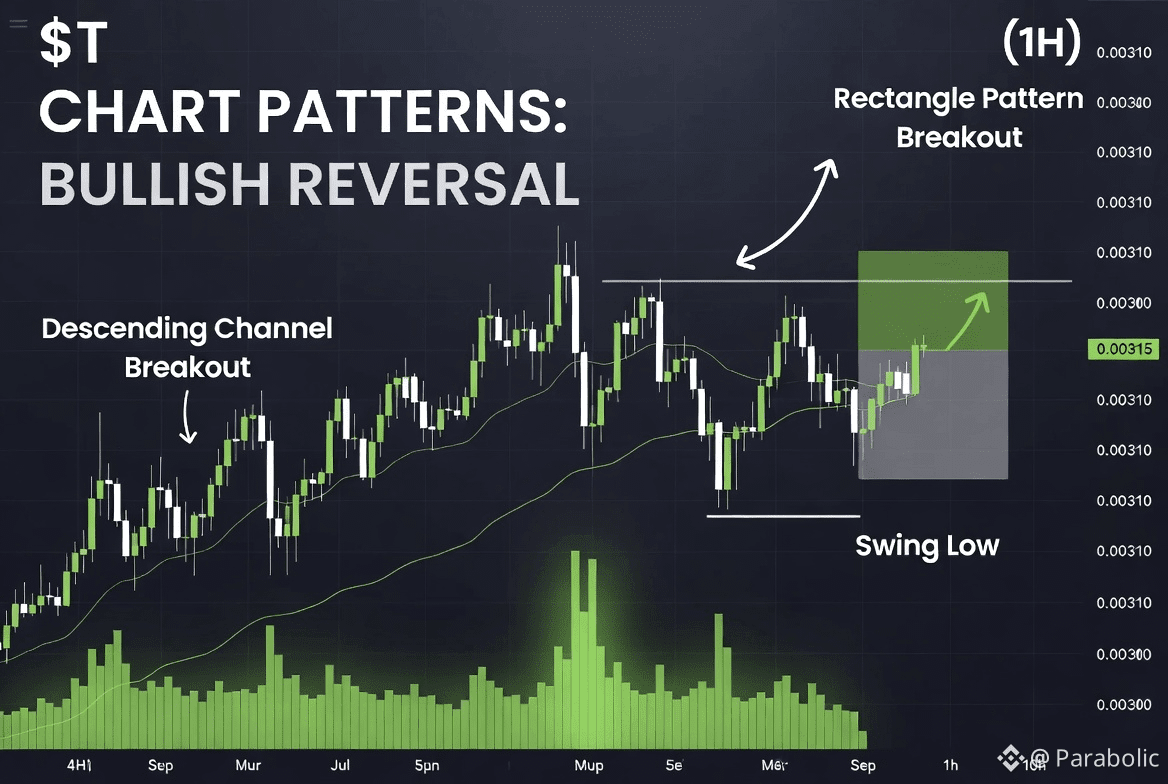
On the 4H timeframe, $T has broken out of a prolonged downtrend that bottomed near 0.00315. The latest 4H candle is a strong bullish breaker that has cleared previous resistance and the declining moving averages, forming a classic trend-reversal breakout. On the 1H chart, price has simultaneously broken out of a multi-week rectangular consolidation pattern. These dual-timeframe breakouts often produce measured moves equal to the height of the prior range or channel. X sentiment is strongly bullish, with multiple traders posting long setups targeting higher prices amid the ongoing pump. Trading Setup (Long – Pattern Breakout):
Entry: 0.00470 (confirmed close above resistance)
Take Profit 1: 0.00520
Take Profit 2: 0.00580
Take Profit 3: 0.00650
Stop Loss: 0.00430 (below 4H structure low)
#ChartPatterns #BreakoutTrading
trade here $T
{spot}(TUSDT)
On the 4H timeframe, $T has broken out of a prolonged downtrend that bottomed near 0.00315. The latest 4H candle is a strong bullish breaker that has cleared previous resistance and the declining moving averages, forming a classic trend-reversal breakout. On the 1H chart, price has simultaneously broken out of a multi-week rectangular consolidation pattern. These dual-timeframe breakouts often produce measured moves equal to the height of the prior range or channel. X sentiment is strongly bullish, with multiple traders posting long setups targeting higher prices amid the ongoing pump. Trading Setup (Long – Pattern Breakout):
Entry: 0.00470 (confirmed close above resistance)
Take Profit 1: 0.00520
Take Profit 2: 0.00580
Take Profit 3: 0.00650
Stop Loss: 0.00430 (below 4H structure low)
#ChartPatterns #BreakoutTrading
trade here $T
Entry: 0.00470 (confirmed close above resistance)
Take Profit 1: 0.00520
Take Profit 2: 0.00580
Take Profit 3: 0.00650
Stop Loss: 0.00430 (below 4H structure low)
#ChartPatterns #BreakoutTrading
trade here $T
163

·
--
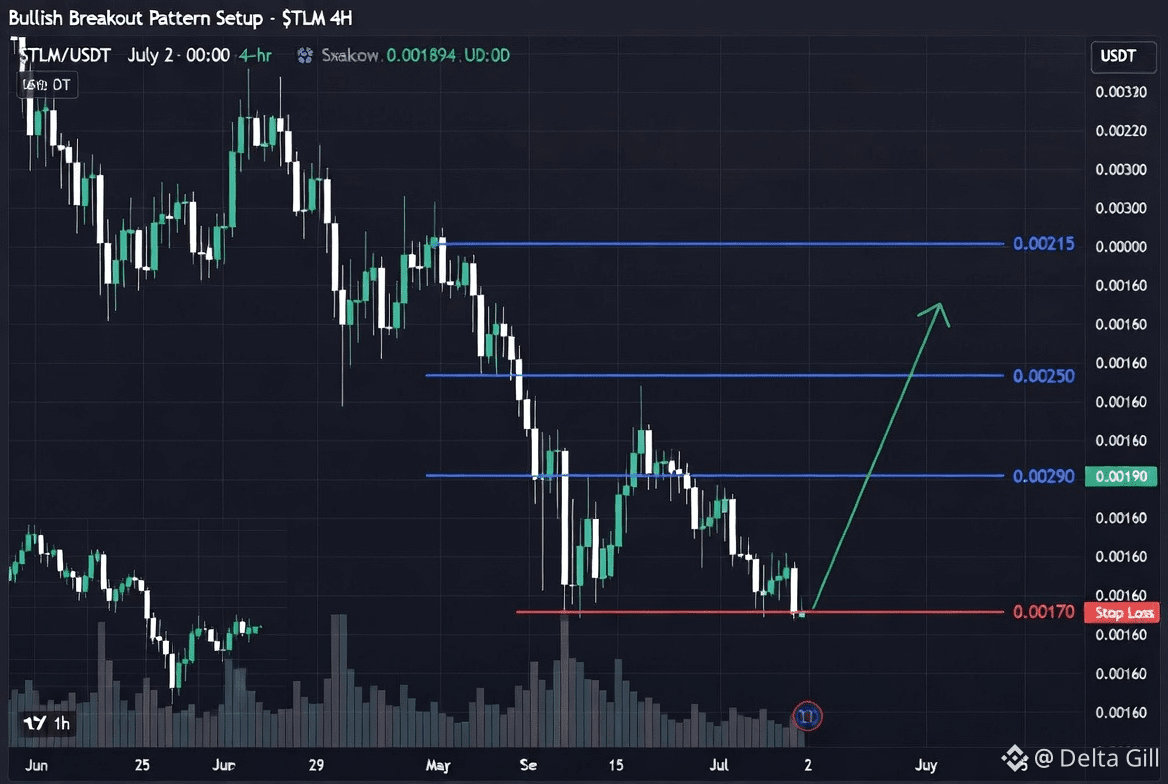
On the 4H chart, $TLM has broken out of a prolonged descending channel with a decisive bullish candle and heavy volume. The 1H timeframe shows a clear impulsive breakout structure after consolidation near the lows. This pattern resembles a falling wedge or descending channel breakout — classic bullish reversal signals. Combined with the latest data showing extreme volume spike and renewed trader interest in Alien Worlds, the breakout has strong conviction.Bullish Trading Setup Entry: 0.00190 (break and close above recent high or retest of breakout level)
Take Profit 1: 0.00215
Take Profit 2: 0.00250
Take Profit 3: 0.00300
Stop Loss: 0.00170 (below the breakout candle low)
Measured move targets suggest significant upside potential. #TLM #ChartPatterns
On the 4H chart, $TLM has broken out of a prolonged descending channel with a decisive bullish candle and heavy volume. The 1H timeframe shows a clear impulsive breakout structure after consolidation near the lows. This pattern resembles a falling wedge or descending channel breakout — classic bullish reversal signals. Combined with the latest data showing extreme volume spike and renewed trader interest in Alien Worlds, the breakout has strong conviction.Bullish Trading Setup Entry: 0.00190 (break and close above recent high or retest of breakout level)
Take Profit 1: 0.00215
Take Profit 2: 0.00250
Take Profit 3: 0.00300
Stop Loss: 0.00170 (below the breakout candle low)
Measured move targets suggest significant upside potential. #TLM #ChartPatterns
Take Profit 1: 0.00215
Take Profit 2: 0.00250
Take Profit 3: 0.00300
Stop Loss: 0.00170 (below the breakout candle low)
Measured move targets suggest significant upside potential. #TLM #ChartPatterns
175

🚨 $MAGMA IS ABOUT TO ERUPT! MASSIVE SQUEEZE IN PROGRESS!
🚨If you are trading MAGMA/USDT, you need to be watching this 15-minute chart right now. After a phenomenal vertical rally, the price has entered a massive volatility squeeze, and the pressure is reaching a boiling point!
🌋📊 The Technical Setup:
The Squeeze:
We are looking at a textbook consolidation pattern. The bulls have built an unbreakable horizontal floor of support, while descending resistance has kept the price tightly compressed over the last several hours.The Breakout Attempt: Right now, the price is sitting at $0.54888 and aggressively pushing against the upper boundary of this triangle!Momentum:
$MAGMA just reclaimed the short-term 5 EMA (the green line), showing that buyers are waking up and applying serious pressure right at the exact moment it matters most.💡 The Play:The apex is getting incredibly tight, and volume is thinning out—this is the classic "calm before the storm." We are waiting for that single explosive 15m candle close above the descending trendline. Once that lid blows off, expect a violent expansion back toward the local highs!Set your alerts and keep your eyes glued to the chart. This coil is about to spring! 🚀📈
$MAGMA
{future}(MAGMAUSDT)
#MAGMAUSDT #cryptosignals #chartpatterns #BreakoutTrading
🚨 $MAGMA IS ABOUT TO ERUPT! MASSIVE SQUEEZE IN PROGRESS!
🚨If you are trading MAGMA/USDT, you need to be watching this 15-minute chart right now. After a phenomenal vertical rally, the price has entered a massive volatility squeeze, and the pressure is reaching a boiling point!
🌋📊 The Technical Setup:
The Squeeze:
We are looking at a textbook consolidation pattern. The bulls have built an unbreakable horizontal floor of support, while descending resistance has kept the price tightly compressed over the last several hours.The Breakout Attempt: Right now, the price is sitting at $0.54888 and aggressively pushing against the upper boundary of this triangle!Momentum:
$MAGMA just reclaimed the short-term 5 EMA (the green line), showing that buyers are waking up and applying serious pressure right at the exact moment it matters most.💡 The Play:The apex is getting incredibly tight, and volume is thinning out—this is the classic "calm before the storm." We are waiting for that single explosive 15m candle close above the descending trendline. Once that lid blows off, expect a violent expansion back toward the local highs!Set your alerts and keep your eyes glued to the chart. This coil is about to spring! 🚀📈
$MAGMA
#MAGMAUSDT #cryptosignals #chartpatterns #BreakoutTrading
🚨If you are trading MAGMA/USDT, you need to be watching this 15-minute chart right now. After a phenomenal vertical rally, the price has entered a massive volatility squeeze, and the pressure is reaching a boiling point!
🌋📊 The Technical Setup:
The Squeeze:
We are looking at a textbook consolidation pattern. The bulls have built an unbreakable horizontal floor of support, while descending resistance has kept the price tightly compressed over the last several hours.The Breakout Attempt: Right now, the price is sitting at $0.54888 and aggressively pushing against the upper boundary of this triangle!Momentum:
$MAGMA just reclaimed the short-term 5 EMA (the green line), showing that buyers are waking up and applying serious pressure right at the exact moment it matters most.💡 The Play:The apex is getting incredibly tight, and volume is thinning out—this is the classic "calm before the storm." We are waiting for that single explosive 15m candle close above the descending trendline. Once that lid blows off, expect a violent expansion back toward the local highs!Set your alerts and keep your eyes glued to the chart. This coil is about to spring! 🚀📈
$MAGMA
#MAGMAUSDT #cryptosignals #chartpatterns #BreakoutTrading
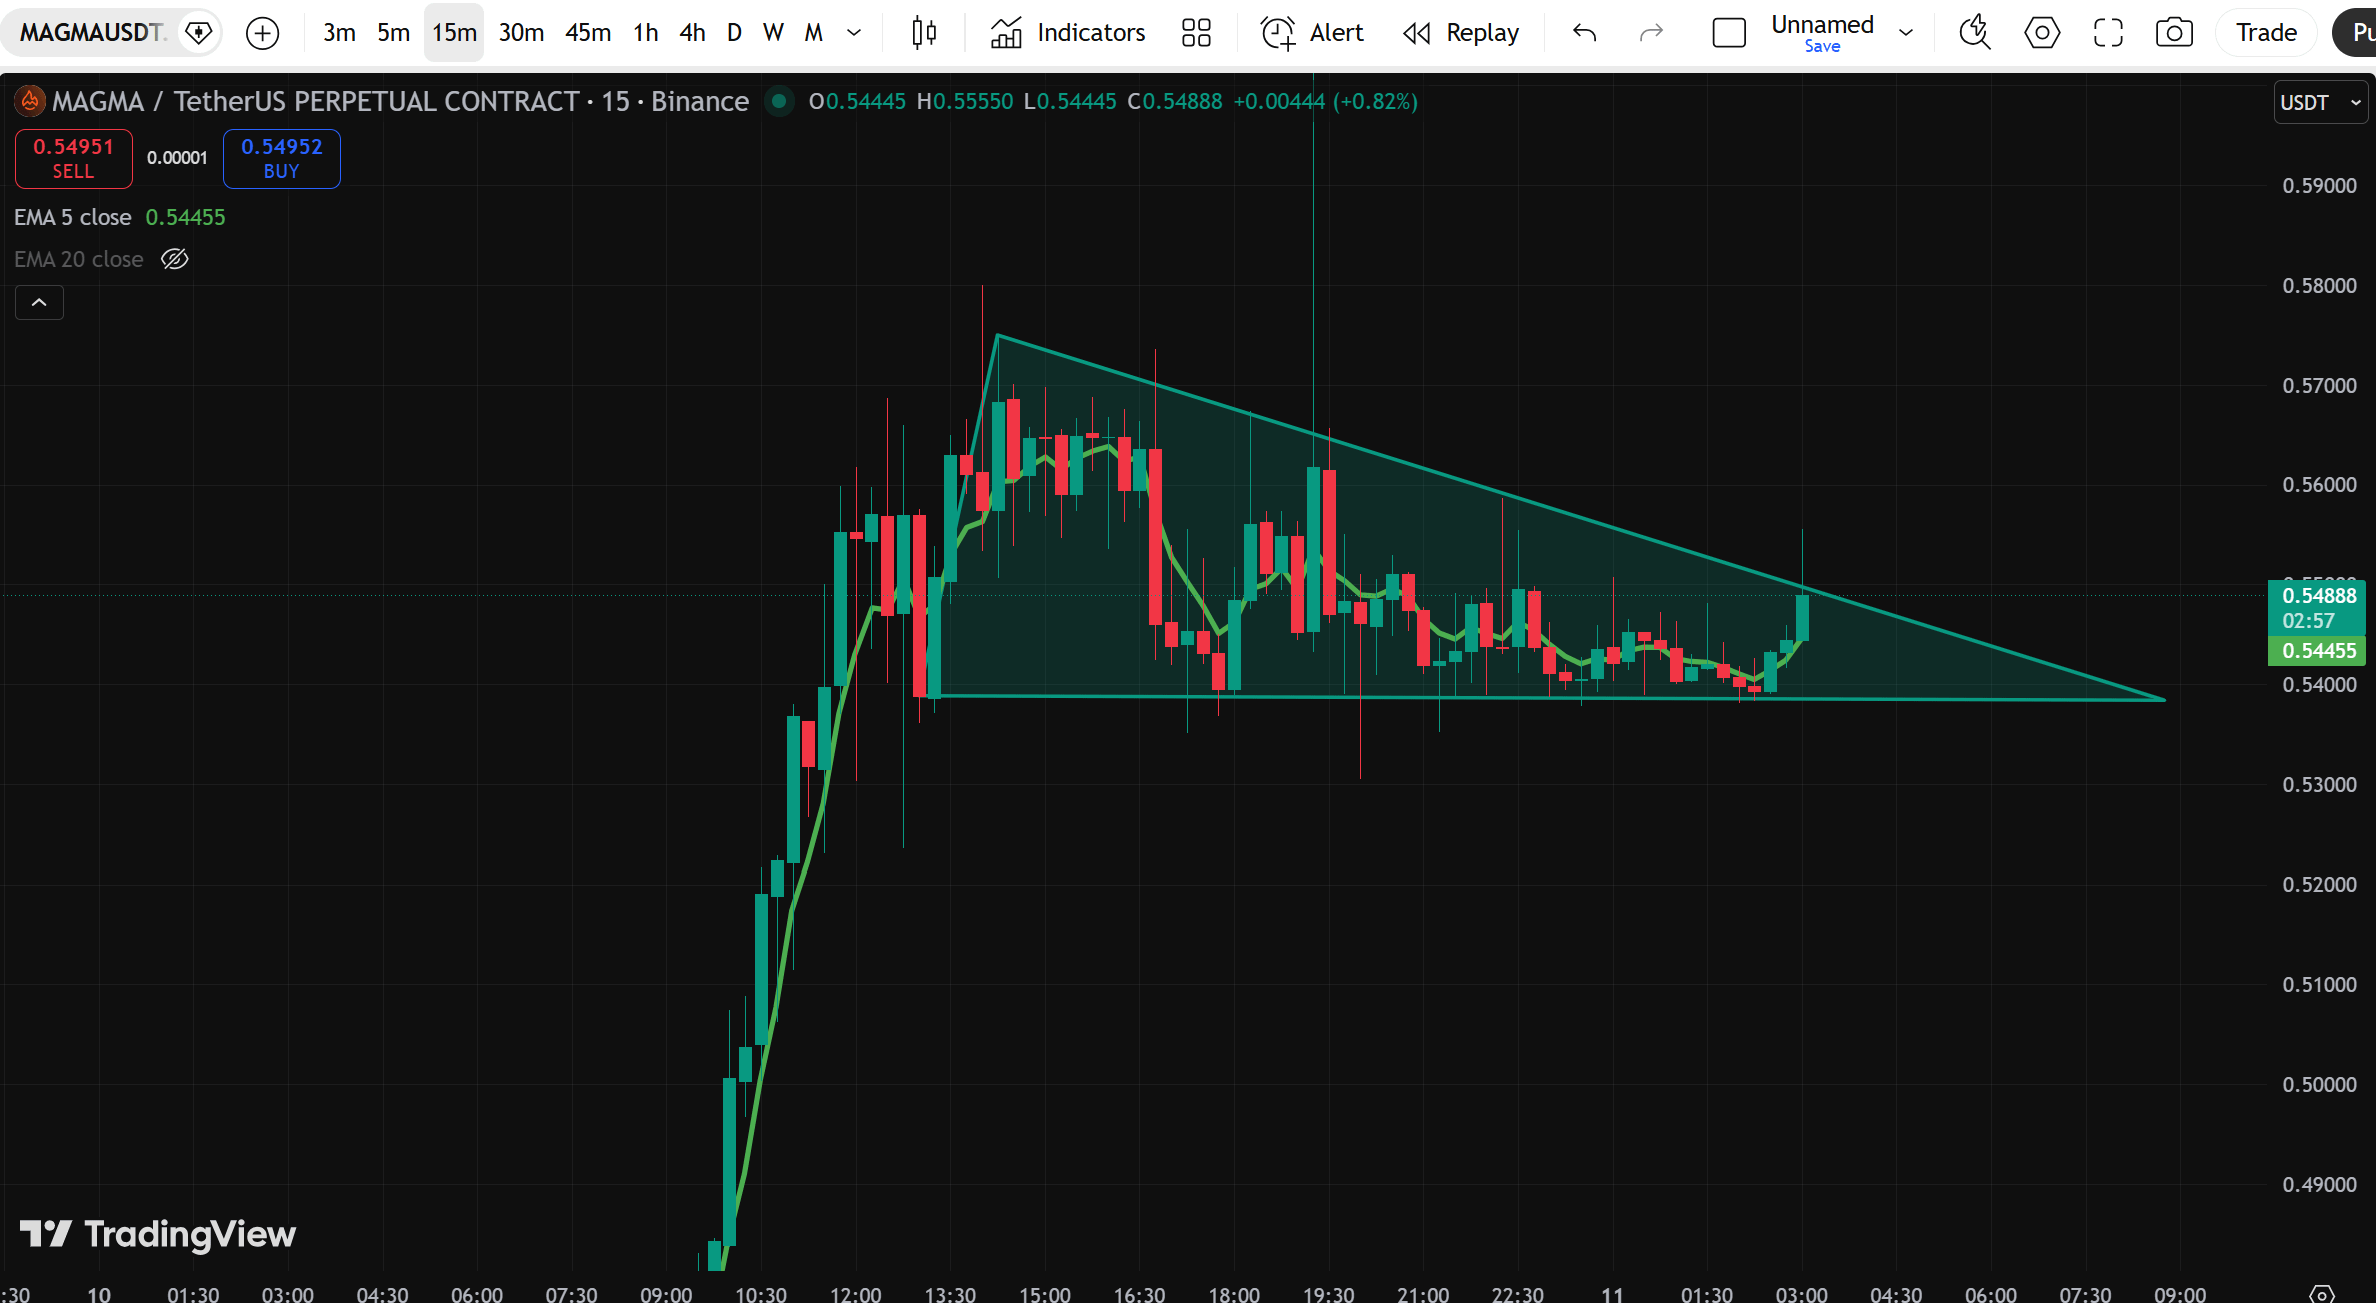
96
Log in to explore more content
Join global crypto users on Binance Square
⚡️ Get latest and useful information about crypto.
💬 Trusted by the world’s largest crypto exchange.
👍 Discover real insights from verified creators.
အီးမေးလ် / ဖုန်းနံပါတ်
ရေပန်းစားနေသော ခေါင်းစဉ်များ
1
#BinanceLaunchesBinanceIntelligence
125,013 views
1,277 Discussing
2
#StriveBuys2000BTCFor$169M
4,698 views
57 Discussing
3
#EvernorthXRPTreasuryCompletesSPACMerger
81,165 views
841 Discussing
4
#ADAGains10%Above$0.27
41,633 views
236 Discussing
5
#ETHUp70%InQ3ButLiquidityFalls
279,674 views
1,894 Discussing
6
#EthStakingExitQueueHits2026High
105,313 views
1,266 Discussing
7
#FedOctoberHoldOdds82.3%
112,323 views
1,231 Discussing
8
#Nikkei225Jumps2.5%ToThreeMonthHigh
109,061 views
1,412 Discussing
9
#CircleMints$2.75BUSDCOnSolanaIn7Days
2,887 views
60 Discussing
10
#DriftHackVictimsBeginClaims
224,100 views
2,090 Discussing