
#bitcoin
bitcoin
ကြည့်ရှုမှု 347.1M ကြိမ်
841,437 ဦး ဆွေးနွေးနေသည်
ရေပန်းစားသော
နောက်ဆုံး

ဘာသာပြန်ဆိုချက် ကြည့်မည်
🧠 Why Does Bitcoin Price Move So Fast?
Bitcoin ဈေးနှုန်းက ဘာကြောင့် အချိန်တိုအတွင်း အတက်အကျ အရမ်းမြန်တာလဲ? 🚀
အဓိက အကြောင်းရင်း ၄ ခုရှိပါတယ်။
1️⃣ Market Demand – Bitcoin ကို ဝယ်လိုသူများလာရင် ဈေးတက်နိုင်ပါတယ်။
2️⃣ Selling Pressure – ရောင်းချသူများလာရင် ဈေးကျနိုင်ပါတယ်။
3️⃣ Market News – သတင်းကောင်း၊ သတင်းဆိုးတွေက ရင်းနှီးမြှုပ်နှံသူတွေရဲ့ ဆုံးဖြတ်ချက်ကို ပြောင်းလဲစေနိုင်ပါတယ်။
4️⃣ Whale Activity – ပမာဏများစွာ ကိုင်ဆောင်ထားသူတွေရဲ့ အရောင်းအဝယ်တွေက Market ကို သက်ရောက်နိုင်ပါတယ်။
💡 Remember: Don't follow the market blindly. Learn to understand the market before making a decision.
💬 မေးခွန်းလေးတစ်ခု။
Bitcoin ဈေးကျလာတဲ့အခါ သင်ဘယ်လိုလုပ်မလဲ?
A. Buy More 📈
B. Wait and Watch 👀
C. Sell to Reduce Risk 🛡️
သင့်အမြင်ကို Comment မှာ မျှဝေခဲ့ပါ။
$BTC $ETH
#Bitcoin #Bitco #BTC #BinanceSquare
⚠️ Disclaimer: Educational content only. Not financial advice. Always DYOR.
🧠 Why Does Bitcoin Price Move So Fast?
Bitcoin ဈေးနှုန်းက ဘာကြောင့် အချိန်တိုအတွင်း အတက်အကျ အရမ်းမြန်တာလဲ? 🚀
အဓိက အကြောင်းရင်း ၄ ခုရှိပါတယ်။
1️⃣ Market Demand – Bitcoin ကို ဝယ်လိုသူများလာရင် ဈေးတက်နိုင်ပါတယ်။
2️⃣ Selling Pressure – ရောင်းချသူများလာရင် ဈေးကျနိုင်ပါတယ်။
3️⃣ Market News – သတင်းကောင်း၊ သတင်းဆိုးတွေက ရင်းနှီးမြှုပ်နှံသူတွေရဲ့ ဆုံးဖြတ်ချက်ကို ပြောင်းလဲစေနိုင်ပါတယ်။
4️⃣ Whale Activity – ပမာဏများစွာ ကိုင်ဆောင်ထားသူတွေရဲ့ အရောင်းအဝယ်တွေက Market ကို သက်ရောက်နိုင်ပါတယ်။
💡 Remember: Don't follow the market blindly. Learn to understand the market before making a decision.
💬 မေးခွန်းလေးတစ်ခု။
Bitcoin ဈေးကျလာတဲ့အခါ သင်ဘယ်လိုလုပ်မလဲ?
A. Buy More 📈
B. Wait and Watch 👀
C. Sell to Reduce Risk 🛡️
သင့်အမြင်ကို Comment မှာ မျှဝေခဲ့ပါ။
$BTC $ETH
#Bitcoin #Bitco #BTC #BinanceSquare
⚠️ Disclaimer: Educational content only. Not financial advice. Always DYOR.
Bitcoin ဈေးနှုန်းက ဘာကြောင့် အချိန်တိုအတွင်း အတက်အကျ အရမ်းမြန်တာလဲ? 🚀
အဓိက အကြောင်းရင်း ၄ ခုရှိပါတယ်။
1️⃣ Market Demand – Bitcoin ကို ဝယ်လိုသူများလာရင် ဈေးတက်နိုင်ပါတယ်။
2️⃣ Selling Pressure – ရောင်းချသူများလာရင် ဈေးကျနိုင်ပါတယ်။
3️⃣ Market News – သတင်းကောင်း၊ သတင်းဆိုးတွေက ရင်းနှီးမြှုပ်နှံသူတွေရဲ့ ဆုံးဖြတ်ချက်ကို ပြောင်းလဲစေနိုင်ပါတယ်။
4️⃣ Whale Activity – ပမာဏများစွာ ကိုင်ဆောင်ထားသူတွေရဲ့ အရောင်းအဝယ်တွေက Market ကို သက်ရောက်နိုင်ပါတယ်။
💡 Remember: Don't follow the market blindly. Learn to understand the market before making a decision.
💬 မေးခွန်းလေးတစ်ခု။
Bitcoin ဈေးကျလာတဲ့အခါ သင်ဘယ်လိုလုပ်မလဲ?
A. Buy More 📈
B. Wait and Watch 👀
C. Sell to Reduce Risk 🛡️
သင့်အမြင်ကို Comment မှာ မျှဝေခဲ့ပါ။
$BTC $ETH
#Bitcoin #Bitco #BTC #BinanceSquare
⚠️ Disclaimer: Educational content only. Not financial advice. Always DYOR.
87

·
--
စိစစ်အတည်ပြုထားသည်
🚨 ဘစ်ကွိုင်း $69K ဝန်းကျင်မှာ ရှိနေ — နောက်ထပ် ကျဆင်းဦးမလား? 📈
ဘစ်ကွိုင်းဟာ အကြီးအကျယ် ဈေးပြင်ဆင်ကျဆင်းမှု ကြုံတွေ့ခဲ့ပြီး $80K ဝန်းကျင်ကနေ $69K ဘက်ကို ရွေ့လျားလာခဲ့ပါတယ်။ အခုအခါမှာတော့ ဈေးကွက်က အောက်ဆုံးအမှတ်ကို ရှာတွေ့နိုင်မလား၊ ဒါမှမဟုတ် ဆက်ကျဆင်းမလားဆိုတာကို ကုန်သည်တွေ စောင့်ကြည့်နေကြပါတယ်။
📊 အမေရိကန် PPI — အောက်တိုဘာလ အချက်အလက်များ:
• လစဉ် PPI: မျှော်မှန်းထားသည့် (+0.4%) နှင့် နှိုင်းယှဉ်လျှင် (+0.3%)
• နှစ်စဉ် PPI: (+6.5%) ဖြစ်ပြီး စက်တင်ဘာလက (6.3%) ထက် မြင့်တက်လာ
🔍 စောင့်ကြည့်ရမည့် BTC ဈေးနှုန်းအဆင့်များ:
🔴 ဈေးကျနိုင်သည့် အခြေအနေ: အရောင်းဖိအား ဆက်ရှိနေပါက $67K အထိ ကျဆင်းနိုင်ပါတယ်။
🟢 ပြန်လည်နာလန်ထူနိုင်သည့် အခြေအနေ: BTC က ထောက်ခံမှုအဆင့်ကို ထိန်းထားနိုင်ပြီး $70K ကို ပြန်လည်ကျော်တက်ပါက $72K–$73K အထိ ရွေ့လျားဖို့ ကြိုးစားနိုင်ပါတယ်။
🚀 ရေရှည်ခန့်မှန်းချက်: ဈေးကွက်ခန့်မှန်းချက်အချို့မှာ $130K အထိ မြင့်တက်နိုင်တယ်လို့ မျှော်မှန်းထားပေမယ့်၊ အဲဒီခန့်မှန်းချက်က မသေချာမှုများစွာရှိပြီး ပိုမိုကျယ်ပြန့်တဲ့ ဈေးကွက်ပြန်လည်နာလန်ထူမှုအပေါ် မူတည်ပါတယ်။
⚠️ လစဉ် PPI အေးသွားတာက ဘစ်ကွိုင်းဈေးတက်မယ်လို့ အာမမခံပါဘူး။ ဈေးနှုန်းလှုပ်ရှားမှုကနေ အတည်ပြုချက်ရဖို့ ဈေးကွက်က လိုအပ်နေဆဲပါ။
$BTC - $AKE - $SHELL
{future}(BTCUSDT)
{future}(AKEUSDT)
{future}(SHELLUSDT)
#Bitcoin #CryptoMarket
#USPPIMissMayEaseBTCPressure
"$67K က ဘစ်ကွိုင်းရဲ့ အောက်ဆုံးဈေး ဖြစ်မယ်လို့ ထင်ပါသလား၊ ဒါမှမဟုတ် ပြန်မတက်ခင် ဒီထက်နိမ့်တဲ့ဈေးတွေကို မြင်ရနိုင်ပါသလား"!?👀
🚨 ဘစ်ကွိုင်း $69K ဝန်းကျင်မှာ ရှိနေ — နောက်ထပ် ကျဆင်းဦးမလား? 📈
ဘစ်ကွိုင်းဟာ အကြီးအကျယ် ဈေးပြင်ဆင်ကျဆင်းမှု ကြုံတွေ့ခဲ့ပြီး $80K ဝန်းကျင်ကနေ $69K ဘက်ကို ရွေ့လျားလာခဲ့ပါတယ်။ အခုအခါမှာတော့ ဈေးကွက်က အောက်ဆုံးအမှတ်ကို ရှာတွေ့နိုင်မလား၊ ဒါမှမဟုတ် ဆက်ကျဆင်းမလားဆိုတာကို ကုန်သည်တွေ စောင့်ကြည့်နေကြပါတယ်။
📊 အမေရိကန် PPI — အောက်တိုဘာလ အချက်အလက်များ:
• လစဉ် PPI: မျှော်မှန်းထားသည့် (+0.4%) နှင့် နှိုင်းယှဉ်လျှင် (+0.3%)
• နှစ်စဉ် PPI: (+6.5%) ဖြစ်ပြီး စက်တင်ဘာလက (6.3%) ထက် မြင့်တက်လာ
🔍 စောင့်ကြည့်ရမည့် BTC ဈေးနှုန်းအဆင့်များ:
🔴 ဈေးကျနိုင်သည့် အခြေအနေ: အရောင်းဖိအား ဆက်ရှိနေပါက $67K အထိ ကျဆင်းနိုင်ပါတယ်။
🟢 ပြန်လည်နာလန်ထူနိုင်သည့် အခြေအနေ: BTC က ထောက်ခံမှုအဆင့်ကို ထိန်းထားနိုင်ပြီး $70K ကို ပြန်လည်ကျော်တက်ပါက $72K–$73K အထိ ရွေ့လျားဖို့ ကြိုးစားနိုင်ပါတယ်။
🚀 ရေရှည်ခန့်မှန်းချက်: ဈေးကွက်ခန့်မှန်းချက်အချို့မှာ $130K အထိ မြင့်တက်နိုင်တယ်လို့ မျှော်မှန်းထားပေမယ့်၊ အဲဒီခန့်မှန်းချက်က မသေချာမှုများစွာရှိပြီး ပိုမိုကျယ်ပြန့်တဲ့ ဈေးကွက်ပြန်လည်နာလန်ထူမှုအပေါ် မူတည်ပါတယ်။
⚠️ လစဉ် PPI အေးသွားတာက ဘစ်ကွိုင်းဈေးတက်မယ်လို့ အာမမခံပါဘူး။ ဈေးနှုန်းလှုပ်ရှားမှုကနေ အတည်ပြုချက်ရဖို့ ဈေးကွက်က လိုအပ်နေဆဲပါ။
$BTC - $AKE - $SHELL
#Bitcoin #CryptoMarket
#USPPIMissMayEaseBTCPressure
"$67K က ဘစ်ကွိုင်းရဲ့ အောက်ဆုံးဈေး ဖြစ်မယ်လို့ ထင်ပါသလား၊ ဒါမှမဟုတ် ပြန်မတက်ခင် ဒီထက်နိမ့်တဲ့ဈေးတွေကို မြင်ရနိုင်ပါသလား"!?👀
ဘစ်ကွိုင်းဟာ အကြီးအကျယ် ဈေးပြင်ဆင်ကျဆင်းမှု ကြုံတွေ့ခဲ့ပြီး $80K ဝန်းကျင်ကနေ $69K ဘက်ကို ရွေ့လျားလာခဲ့ပါတယ်။ အခုအခါမှာတော့ ဈေးကွက်က အောက်ဆုံးအမှတ်ကို ရှာတွေ့နိုင်မလား၊ ဒါမှမဟုတ် ဆက်ကျဆင်းမလားဆိုတာကို ကုန်သည်တွေ စောင့်ကြည့်နေကြပါတယ်။
📊 အမေရိကန် PPI — အောက်တိုဘာလ အချက်အလက်များ:
• လစဉ် PPI: မျှော်မှန်းထားသည့် (+0.4%) နှင့် နှိုင်းယှဉ်လျှင် (+0.3%)
• နှစ်စဉ် PPI: (+6.5%) ဖြစ်ပြီး စက်တင်ဘာလက (6.3%) ထက် မြင့်တက်လာ
🔍 စောင့်ကြည့်ရမည့် BTC ဈေးနှုန်းအဆင့်များ:
🔴 ဈေးကျနိုင်သည့် အခြေအနေ: အရောင်းဖိအား ဆက်ရှိနေပါက $67K အထိ ကျဆင်းနိုင်ပါတယ်။
🟢 ပြန်လည်နာလန်ထူနိုင်သည့် အခြေအနေ: BTC က ထောက်ခံမှုအဆင့်ကို ထိန်းထားနိုင်ပြီး $70K ကို ပြန်လည်ကျော်တက်ပါက $72K–$73K အထိ ရွေ့လျားဖို့ ကြိုးစားနိုင်ပါတယ်။
🚀 ရေရှည်ခန့်မှန်းချက်: ဈေးကွက်ခန့်မှန်းချက်အချို့မှာ $130K အထိ မြင့်တက်နိုင်တယ်လို့ မျှော်မှန်းထားပေမယ့်၊ အဲဒီခန့်မှန်းချက်က မသေချာမှုများစွာရှိပြီး ပိုမိုကျယ်ပြန့်တဲ့ ဈေးကွက်ပြန်လည်နာလန်ထူမှုအပေါ် မူတည်ပါတယ်။
⚠️ လစဉ် PPI အေးသွားတာက ဘစ်ကွိုင်းဈေးတက်မယ်လို့ အာမမခံပါဘူး။ ဈေးနှုန်းလှုပ်ရှားမှုကနေ အတည်ပြုချက်ရဖို့ ဈေးကွက်က လိုအပ်နေဆဲပါ။
$BTC - $AKE - $SHELL
#Bitcoin #CryptoMarket
#USPPIMissMayEaseBTCPressure
"$67K က ဘစ်ကွိုင်းရဲ့ အောက်ဆုံးဈေး ဖြစ်မယ်လို့ ထင်ပါသလား၊ ဒါမှမဟုတ် ပြန်မတက်ခင် ဒီထက်နိမ့်တဲ့ဈေးတွေကို မြင်ရနိုင်ပါသလား"!?👀
🟢 Yes, BTC — $67K Bottom 🚀
🔴 No, BTC — More Downside 📉
11 နာရီ ကျန်သေးသည်
4
2
1.1k

·
--
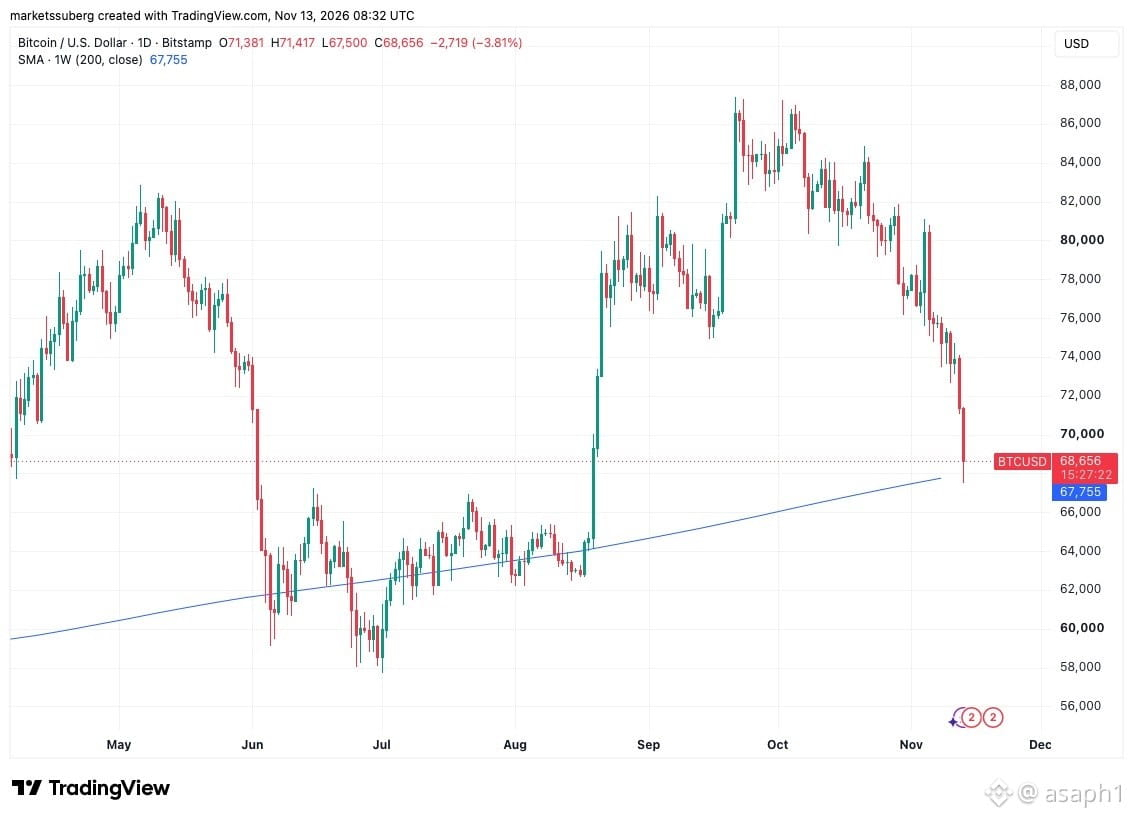
🚨 $BTC ရက်သတ္တပတ် ၂၀၀ ပျမ်းမျှနှုန်းကြောင့် ထိတ်လန့်မှု
Bitcoin ဟာ ဝက်ဝံဈေးကွက်စက်ဝန်းတိုင်းရဲ့ အနိမ့်ဆုံးဈေးကို သတ်မှတ်ပေးခဲ့တဲ့ မျဉ်းဖြစ်တဲ့ ရက်သတ္တပတ် ၂၀၀ ပျမ်းမျှနှုန်းကို ဩဂုတ် ၁၉ ရက်နောက်ပိုင်း ပထမဆုံးအကြိမ် ကျော်လွန်ကျဆင်းသွားပါပြီ။ ကျွန်တော့်အမြင်အရတော့ ဒါဟာ နောက်ထပ်ဈေးပြင်ဆင်မှုတစ်ခု မဟုတ်တော့ပါဘူး။ အတက်ဈေးကွက်စက်ဝန်း ဆက်လက်ရှင်သန်နေသေးရဲ့လားလို့ ဈေးကွက်က မေးခွန်းထုတ်နေတဲ့ အခြေအနေပါ။
ဘယ်သူမှ သတိမထားမိနေတဲ့ အသေးစိတ်အချက်ကို ကြည့်ပါ–
→ BTC ဟာ $67,500 အထိ ကျဆင်းခဲ့ပြီး ရက်သတ္တပတ် ၂၀၀ ပျမ်းမျှနှုန်း ($68,000 ဝန်းကျင်) အောက်ကို ရောက်ခဲ့ပါတယ်။ ၁၁ ပတ်အတွင်း ပထမဆုံးအကြိမ် အဲဒီအဆင့်ကို စမ်းသပ်တာပါ။
→ ရက်သတ္တပတ်အလိုက် MACD ဟာ အနီရောင်ပြောင်းသွားပါတယ်။ ၂၀၁၂ ခုနှစ်ကစပြီး ဒီလိုဖြစ်ခဲ့တဲ့ ၂၄ ကြိမ်အနက် ၁၃ ကြိမ်မှာ Bitcoin ဟာ အနည်းဆုံး နောက်ထပ် ၁၆% ကျဆင်းခဲ့ပြီး၊ အဲဒီလိုဆိုရင် $60,000 အောက် ရောက်သွားနိုင်ပါတယ်။
→ ရက်သတ္တပတ်အလိုက် RSI က 41.5 အောက်ကျသွားရင် သံသရာရဲ့ အနိမ့်ဆုံးဈေးဟာ $57,700 ဖြစ်မယ်လို့ လေ့လာဆန်းစစ်သူ Keith Alan က ခန့်မှန်းထားပါတယ်။ နေ့စဉ် RSI ကတော့ အရောင်းလွန်အခြေအနေမှာ 28.4 ရှိနေပါပြီ။
ဒီသီတင်းပတ်ကုန်မှာ Bitcoin က $68,000 ကို ကာကွယ်နိုင်မယ်လို့ ထင်ပါသလား၊ ဒါမှမဟုတ် $57,700 ကို တန်းကျသွားမလား။ 👇
$BTC
#Bitcoin #Media200Semanas #ဈေးကွက်အနီရောင်
🚨 $BTC ရက်သတ္တပတ် ၂၀၀ ပျမ်းမျှနှုန်းကြောင့် ထိတ်လန့်မှု
Bitcoin ဟာ ဝက်ဝံဈေးကွက်စက်ဝန်းတိုင်းရဲ့ အနိမ့်ဆုံးဈေးကို သတ်မှတ်ပေးခဲ့တဲ့ မျဉ်းဖြစ်တဲ့ ရက်သတ္တပတ် ၂၀၀ ပျမ်းမျှနှုန်းကို ဩဂုတ် ၁၉ ရက်နောက်ပိုင်း ပထမဆုံးအကြိမ် ကျော်လွန်ကျဆင်းသွားပါပြီ။ ကျွန်တော့်အမြင်အရတော့ ဒါဟာ နောက်ထပ်ဈေးပြင်ဆင်မှုတစ်ခု မဟုတ်တော့ပါဘူး။ အတက်ဈေးကွက်စက်ဝန်း ဆက်လက်ရှင်သန်နေသေးရဲ့လားလို့ ဈေးကွက်က မေးခွန်းထုတ်နေတဲ့ အခြေအနေပါ။
ဘယ်သူမှ သတိမထားမိနေတဲ့ အသေးစိတ်အချက်ကို ကြည့်ပါ–
→ BTC ဟာ $67,500 အထိ ကျဆင်းခဲ့ပြီး ရက်သတ္တပတ် ၂၀၀ ပျမ်းမျှနှုန်း ($68,000 ဝန်းကျင်) အောက်ကို ရောက်ခဲ့ပါတယ်။ ၁၁ ပတ်အတွင်း ပထမဆုံးအကြိမ် အဲဒီအဆင့်ကို စမ်းသပ်တာပါ။
→ ရက်သတ္တပတ်အလိုက် MACD ဟာ အနီရောင်ပြောင်းသွားပါတယ်။ ၂၀၁၂ ခုနှစ်ကစပြီး ဒီလိုဖြစ်ခဲ့တဲ့ ၂၄ ကြိမ်အနက် ၁၃ ကြိမ်မှာ Bitcoin ဟာ အနည်းဆုံး နောက်ထပ် ၁၆% ကျဆင်းခဲ့ပြီး၊ အဲဒီလိုဆိုရင် $60,000 အောက် ရောက်သွားနိုင်ပါတယ်။
→ ရက်သတ္တပတ်အလိုက် RSI က 41.5 အောက်ကျသွားရင် သံသရာရဲ့ အနိမ့်ဆုံးဈေးဟာ $57,700 ဖြစ်မယ်လို့ လေ့လာဆန်းစစ်သူ Keith Alan က ခန့်မှန်းထားပါတယ်။ နေ့စဉ် RSI ကတော့ အရောင်းလွန်အခြေအနေမှာ 28.4 ရှိနေပါပြီ။
ဒီသီတင်းပတ်ကုန်မှာ Bitcoin က $68,000 ကို ကာကွယ်နိုင်မယ်လို့ ထင်ပါသလား၊ ဒါမှမဟုတ် $57,700 ကို တန်းကျသွားမလား။ 👇
$BTC
#Bitcoin #Media200Semanas #ဈေးကွက်အနီရောင်
Bitcoin ဟာ ဝက်ဝံဈေးကွက်စက်ဝန်းတိုင်းရဲ့ အနိမ့်ဆုံးဈေးကို သတ်မှတ်ပေးခဲ့တဲ့ မျဉ်းဖြစ်တဲ့ ရက်သတ္တပတ် ၂၀၀ ပျမ်းမျှနှုန်းကို ဩဂုတ် ၁၉ ရက်နောက်ပိုင်း ပထမဆုံးအကြိမ် ကျော်လွန်ကျဆင်းသွားပါပြီ။ ကျွန်တော့်အမြင်အရတော့ ဒါဟာ နောက်ထပ်ဈေးပြင်ဆင်မှုတစ်ခု မဟုတ်တော့ပါဘူး။ အတက်ဈေးကွက်စက်ဝန်း ဆက်လက်ရှင်သန်နေသေးရဲ့လားလို့ ဈေးကွက်က မေးခွန်းထုတ်နေတဲ့ အခြေအနေပါ။
ဘယ်သူမှ သတိမထားမိနေတဲ့ အသေးစိတ်အချက်ကို ကြည့်ပါ–
→ BTC ဟာ $67,500 အထိ ကျဆင်းခဲ့ပြီး ရက်သတ္တပတ် ၂၀၀ ပျမ်းမျှနှုန်း ($68,000 ဝန်းကျင်) အောက်ကို ရောက်ခဲ့ပါတယ်။ ၁၁ ပတ်အတွင်း ပထမဆုံးအကြိမ် အဲဒီအဆင့်ကို စမ်းသပ်တာပါ။
→ ရက်သတ္တပတ်အလိုက် MACD ဟာ အနီရောင်ပြောင်းသွားပါတယ်။ ၂၀၁၂ ခုနှစ်ကစပြီး ဒီလိုဖြစ်ခဲ့တဲ့ ၂၄ ကြိမ်အနက် ၁၃ ကြိမ်မှာ Bitcoin ဟာ အနည်းဆုံး နောက်ထပ် ၁၆% ကျဆင်းခဲ့ပြီး၊ အဲဒီလိုဆိုရင် $60,000 အောက် ရောက်သွားနိုင်ပါတယ်။
→ ရက်သတ္တပတ်အလိုက် RSI က 41.5 အောက်ကျသွားရင် သံသရာရဲ့ အနိမ့်ဆုံးဈေးဟာ $57,700 ဖြစ်မယ်လို့ လေ့လာဆန်းစစ်သူ Keith Alan က ခန့်မှန်းထားပါတယ်။ နေ့စဉ် RSI ကတော့ အရောင်းလွန်အခြေအနေမှာ 28.4 ရှိနေပါပြီ။
ဒီသီတင်းပတ်ကုန်မှာ Bitcoin က $68,000 ကို ကာကွယ်နိုင်မယ်လို့ ထင်ပါသလား၊ ဒါမှမဟုတ် $57,700 ကို တန်းကျသွားမလား။ 👇
$BTC
#Bitcoin #Media200Semanas #ဈေးကွက်အနီရောင်
1.2k
·
--
🚨 $BTC အထိတ်တလန့်! မနက်အစောပိုင်းတွင် BITCOIN ဈေးနှုန်း $67,000 အောက်ကျဆင်း
Bitcoin သည် နောက်ထပ်ဈေးနှုန်းအထောက်အပံ့တစ်ခုကို ချိုးဖျက်ပြီး တစ်နေ့တာကို ပိတ်သိမ်းခဲ့သည်။ Coinbase တွင် $66,789 အထိထိခဲ့ပြီး သုံးလကျော်အတွင်း အနိမ့်ဆုံးဖြစ်ကာ စျေးကွက်တစ်ခုလုံးကို ကြောက်ရွံ့မှုလွှမ်းမိုးသွားခဲ့သည်။ ကျွန်တော့်အမြင်အရတော့ ဒါဟာ စနစ်တကျဈေးပြင်ဆင်မှုတစ်ခု မဟုတ်တော့ပါဘူး။ Fed၊ ETF တွေနဲ့ လက်ကျန်ငွေထက်ပို၍ ရင်းနှီးမြှုပ်နှံထားမှုတွေက တစ်ဖက်တည်းကို တွန်းပို့နေတဲ့ ကွင်းဆက်တုံ့ပြန်မှုနဲ့ ထွက်ပြေးမှုတစ်ခုပါပဲ။
ဘယ်သူမှ သတိမထားမိနေတဲ့ အသေးစိတ်ကို ကြည့်ကြပါစို့-
→ အကြောက်တရားနှင့် လောဘညွှန်းကိန်းဟာ ၁၃ အထိကျဆင်းခဲ့ပြီး လွန်ကဲတဲ့ကြောက်ရွံ့မှုကို ပြသခဲ့ပါတယ်။ ဒါဟာ လေးလကျော်အတွင်း အနိမ့်ဆုံးဖတ်ရှုချက်ပါ။
→ ၂၄ နာရီအတွင်း ရင်းနှီးမြှုပ်နှံမှုဒေါ်လာ 1,260 သန်းဖိုး ဖျက်သိမ်းခံခဲ့ရပြီး ၈၆% က ဈေးတက်မယ်လို့ လောင်းထားတဲ့ ရင်းနှီးမြှုပ်နှံမှုတွေဖြစ်ပါတယ်။ ကုန်သည် 173,014 ဦးလည်း စျေးကွက်ထဲကနေ ထွက်ခဲ့ရပါတယ်။
→ Bitcoin ETF တွေမှာ ငွေထွက်မှုဟာ ခြောက်ရက်ဆက်တိုက် ဖြစ်ပေါ်နေပြီး နိုဝင်ဘာ ၁၂ ရက်တစ်ရက်တည်းမှာ ဒေါ်လာ 284 သန်း ထုတ်ယူခဲ့ကြပါတယ်။ တစ်ချိန်တည်းမှာပဲ စျေးကွက်က ဒီဇင်ဘာလမှာ Fed က အတိုးနှုန်းမြှင့်တင်နိုင်ခြေ ၈၉% ရှိတယ်လို့ ခန့်မှန်းထားပါတယ်။
ဒီသီတင်းပတ်ကုန်မှာ $67,000 ကို ပြန်ရောက်မယ်လို့ ထင်ကြပါသလား၊ ဒါမှမဟုတ် Bitcoin က $60,000 အထိ ဆင်းသွားမလား? 👇
$BTC $ETH
#Bitcoin #MiedoExtremo #ဖျက်သိမ်းမှုများ
🚨 $BTC အထိတ်တလန့်! မနက်အစောပိုင်းတွင် BITCOIN ဈေးနှုန်း $67,000 အောက်ကျဆင်း
Bitcoin သည် နောက်ထပ်ဈေးနှုန်းအထောက်အပံ့တစ်ခုကို ချိုးဖျက်ပြီး တစ်နေ့တာကို ပိတ်သိမ်းခဲ့သည်။ Coinbase တွင် $66,789 အထိထိခဲ့ပြီး သုံးလကျော်အတွင်း အနိမ့်ဆုံးဖြစ်ကာ စျေးကွက်တစ်ခုလုံးကို ကြောက်ရွံ့မှုလွှမ်းမိုးသွားခဲ့သည်။ ကျွန်တော့်အမြင်အရတော့ ဒါဟာ စနစ်တကျဈေးပြင်ဆင်မှုတစ်ခု မဟုတ်တော့ပါဘူး။ Fed၊ ETF တွေနဲ့ လက်ကျန်ငွေထက်ပို၍ ရင်းနှီးမြှုပ်နှံထားမှုတွေက တစ်ဖက်တည်းကို တွန်းပို့နေတဲ့ ကွင်းဆက်တုံ့ပြန်မှုနဲ့ ထွက်ပြေးမှုတစ်ခုပါပဲ။
ဘယ်သူမှ သတိမထားမိနေတဲ့ အသေးစိတ်ကို ကြည့်ကြပါစို့-
→ အကြောက်တရားနှင့် လောဘညွှန်းကိန်းဟာ ၁၃ အထိကျဆင်းခဲ့ပြီး လွန်ကဲတဲ့ကြောက်ရွံ့မှုကို ပြသခဲ့ပါတယ်။ ဒါဟာ လေးလကျော်အတွင်း အနိမ့်ဆုံးဖတ်ရှုချက်ပါ။
→ ၂၄ နာရီအတွင်း ရင်းနှီးမြှုပ်နှံမှုဒေါ်လာ 1,260 သန်းဖိုး ဖျက်သိမ်းခံခဲ့ရပြီး ၈၆% က ဈေးတက်မယ်လို့ လောင်းထားတဲ့ ရင်းနှီးမြှုပ်နှံမှုတွေဖြစ်ပါတယ်။ ကုန်သည် 173,014 ဦးလည်း စျေးကွက်ထဲကနေ ထွက်ခဲ့ရပါတယ်။
→ Bitcoin ETF တွေမှာ ငွေထွက်မှုဟာ ခြောက်ရက်ဆက်တိုက် ဖြစ်ပေါ်နေပြီး နိုဝင်ဘာ ၁၂ ရက်တစ်ရက်တည်းမှာ ဒေါ်လာ 284 သန်း ထုတ်ယူခဲ့ကြပါတယ်။ တစ်ချိန်တည်းမှာပဲ စျေးကွက်က ဒီဇင်ဘာလမှာ Fed က အတိုးနှုန်းမြှင့်တင်နိုင်ခြေ ၈၉% ရှိတယ်လို့ ခန့်မှန်းထားပါတယ်။
ဒီသီတင်းပတ်ကုန်မှာ $67,000 ကို ပြန်ရောက်မယ်လို့ ထင်ကြပါသလား၊ ဒါမှမဟုတ် Bitcoin က $60,000 အထိ ဆင်းသွားမလား? 👇
$BTC $ETH
#Bitcoin #MiedoExtremo #ဖျက်သိမ်းမှုများ
Bitcoin သည် နောက်ထပ်ဈေးနှုန်းအထောက်အပံ့တစ်ခုကို ချိုးဖျက်ပြီး တစ်နေ့တာကို ပိတ်သိမ်းခဲ့သည်။ Coinbase တွင် $66,789 အထိထိခဲ့ပြီး သုံးလကျော်အတွင်း အနိမ့်ဆုံးဖြစ်ကာ စျေးကွက်တစ်ခုလုံးကို ကြောက်ရွံ့မှုလွှမ်းမိုးသွားခဲ့သည်။ ကျွန်တော့်အမြင်အရတော့ ဒါဟာ စနစ်တကျဈေးပြင်ဆင်မှုတစ်ခု မဟုတ်တော့ပါဘူး။ Fed၊ ETF တွေနဲ့ လက်ကျန်ငွေထက်ပို၍ ရင်းနှီးမြှုပ်နှံထားမှုတွေက တစ်ဖက်တည်းကို တွန်းပို့နေတဲ့ ကွင်းဆက်တုံ့ပြန်မှုနဲ့ ထွက်ပြေးမှုတစ်ခုပါပဲ။
ဘယ်သူမှ သတိမထားမိနေတဲ့ အသေးစိတ်ကို ကြည့်ကြပါစို့-
→ အကြောက်တရားနှင့် လောဘညွှန်းကိန်းဟာ ၁၃ အထိကျဆင်းခဲ့ပြီး လွန်ကဲတဲ့ကြောက်ရွံ့မှုကို ပြသခဲ့ပါတယ်။ ဒါဟာ လေးလကျော်အတွင်း အနိမ့်ဆုံးဖတ်ရှုချက်ပါ။
→ ၂၄ နာရီအတွင်း ရင်းနှီးမြှုပ်နှံမှုဒေါ်လာ 1,260 သန်းဖိုး ဖျက်သိမ်းခံခဲ့ရပြီး ၈၆% က ဈေးတက်မယ်လို့ လောင်းထားတဲ့ ရင်းနှီးမြှုပ်နှံမှုတွေဖြစ်ပါတယ်။ ကုန်သည် 173,014 ဦးလည်း စျေးကွက်ထဲကနေ ထွက်ခဲ့ရပါတယ်။
→ Bitcoin ETF တွေမှာ ငွေထွက်မှုဟာ ခြောက်ရက်ဆက်တိုက် ဖြစ်ပေါ်နေပြီး နိုဝင်ဘာ ၁၂ ရက်တစ်ရက်တည်းမှာ ဒေါ်လာ 284 သန်း ထုတ်ယူခဲ့ကြပါတယ်။ တစ်ချိန်တည်းမှာပဲ စျေးကွက်က ဒီဇင်ဘာလမှာ Fed က အတိုးနှုန်းမြှင့်တင်နိုင်ခြေ ၈၉% ရှိတယ်လို့ ခန့်မှန်းထားပါတယ်။
ဒီသီတင်းပတ်ကုန်မှာ $67,000 ကို ပြန်ရောက်မယ်လို့ ထင်ကြပါသလား၊ ဒါမှမဟုတ် Bitcoin က $60,000 အထိ ဆင်းသွားမလား? 👇
$BTC $ETH
#Bitcoin #MiedoExtremo #ဖျက်သိမ်းမှုများ
1
4
4.5k

·
--
ကျရိပ်ရှိသည်
🚨 BTC ရဲ့ နောက်တစ်လှုပ်ရှားမှုက နှစ်ဖက်လုံးကို ထောင်ချောက်ဆင်နိုင်တယ်! ဒေါ်လာ ၆၅K ကို ရောက်ဦးမှာလား? 👀
Bitcoin ရဲ့ မကြာသေးခင်က ရောင်းချမှုတွေကြောင့် စိတ်ဝင်စားစရာကောင်းတဲ့ ဈေးကွက်ဖွဲ့စည်းပုံတစ်ခု ဖြစ်ပေါ်လာပါတယ်။ ဒါပေမဲ့ ကုန်သည်အများစု သတိမထားမိနိုင်တာတစ်ခု ရှိပါတယ်—
ဈေးနှုန်း ခဏပြန်တက်လာတာက ဝက်ဝံဈေးကွက်ဘက်က ထိန်းချုပ်မှု ဆုံးရှုံးသွားပြီလို့ မဆိုလိုပါဘူး။
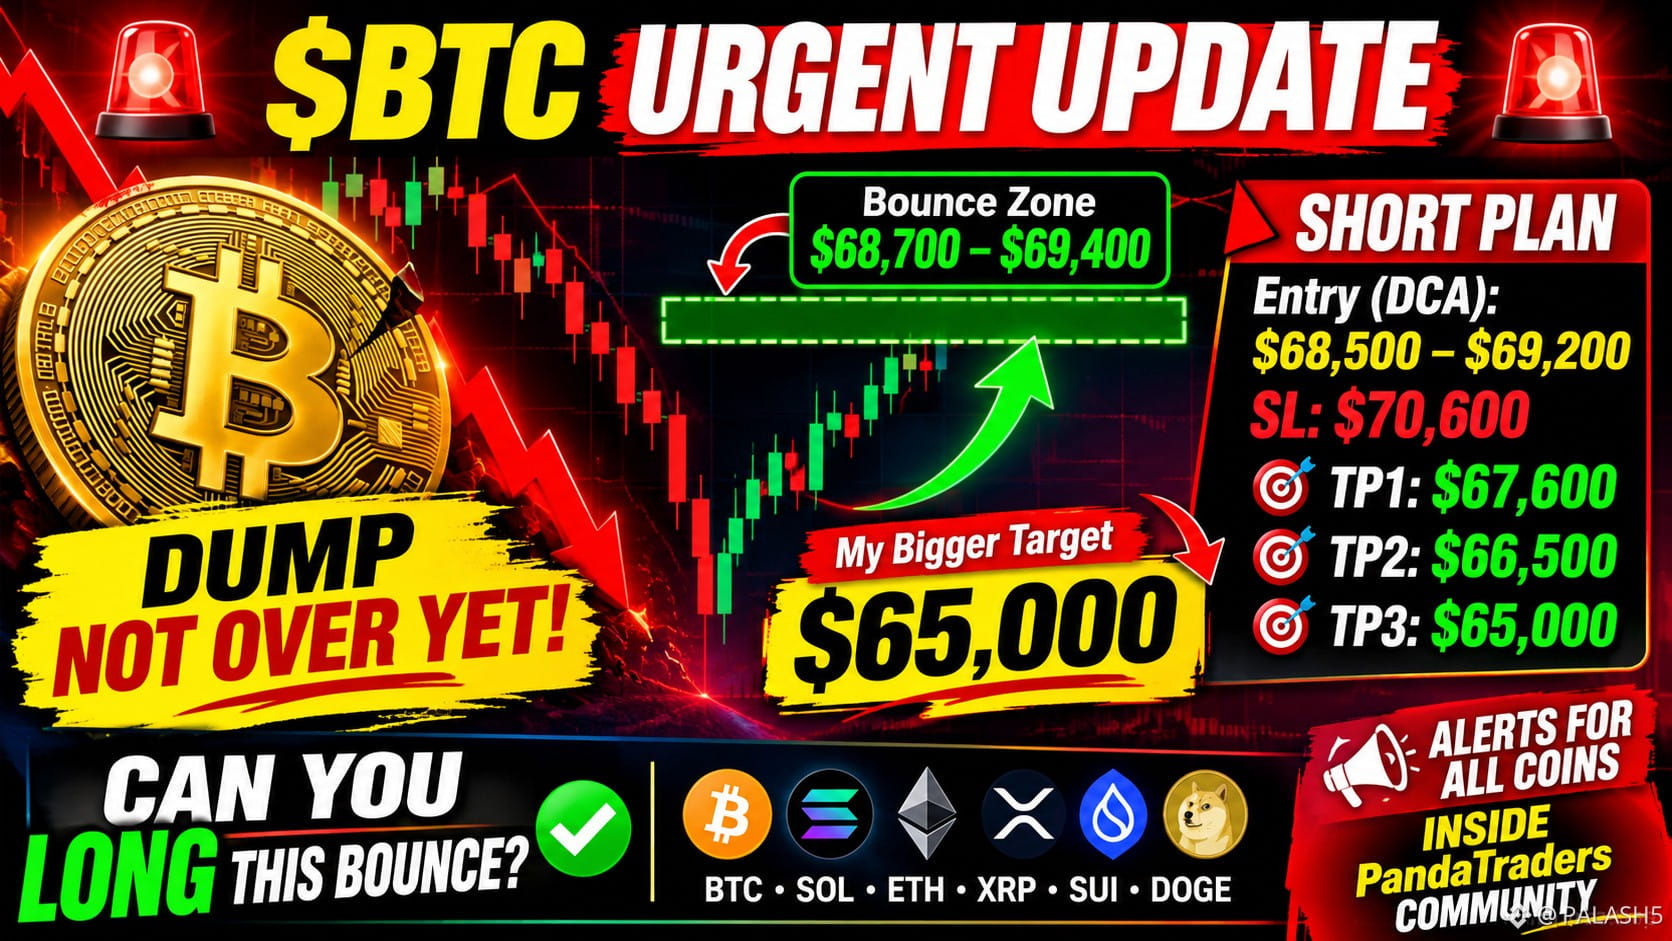
ဒီလောက် ပြင်းထန်တဲ့ အကျဘက်လှုပ်ရှားမှုနောက်မှာ ရေတိုဝယ်လက်တွေ ဝင်လာပြီး BTC ကို $68,700–$69,400 အထိ တွန်းတင်နိုင်ပါတယ်။ ဒါပေမဲ့ အဲဒီဈေးတန်းဟာ အရေးကြီးတဲ့ ဆုံးဖြတ်ချက်ချရမယ့် နေရာ ဖြစ်လာနိုင်ပါတယ်။
🔥 ဈေးကွက်အပေါ် ကျွန်တော့်အမြင်:
အကြီးမားဆုံး အခွင့်အရေးက လက်ရှိဈေးကျမှုနောက် လိုက်ဝယ်တာ မဟုတ်လောက်ပါဘူး။ BTC ပြန်တက်လာတာကို စောင့်ကြည့်ပြီး၊ နောက်ကျမှ ဝယ်သူတွေ ဝင်လာတဲ့အခါ ဝက်ဝံဘက်က ဈေးနှိမ်ချမှုကို ပြသတဲ့ လက္ခဏာတွေ ပေါ်လာမလား စောင့်တာ ဖြစ်နိုင်ပါတယ်။
📊 BTC အတိုရောင်းရန် စောင့်ကြည့်စာရင်း
ဝင်ရောက်ရန် ဈေးတန်း: $68,500–$69,200
အရှုံးဖြတ်ဈေး: $70,600
အမြတ်ယူအဆင့် ၁: $67,600
အမြတ်ယူအဆင့် ၂: $66,500
အမြတ်ယူအဆင့် ၃: $65,000
ဝက်ဝံဘက် အရှိန်ဆက်ရှိနေပြီး ဈေးကွက်က ဒီအစီအစဉ်ကို အတည်ပြုပေးမယ်ဆိုရင် ကျွန်တော့်ရဲ့ အဓိကအာရုံစိုက်ရာက ဒေါ်လာ ၆၅K ပဲ ဖြစ်ပါတယ်။
ပိုကြီးမားတဲ့ ဆွေးနွေးချက်:
ဒီပြန်တက်မှုဟာ နောက်ထပ်တစ်ကြိမ် ဈေးကျမတိုင်မီ ငွေဖြစ်လွယ်မှု ဖန်တီးဖို့ ဈေးကွက်က လုပ်ဆောင်တဲ့ နည်းလမ်းတစ်ခု ဖြစ်နိုင်မလား?
ဒါမှမဟုတ် အတိုရောင်းသူတွေကို အံ့အားသင့်စေနိုင်တဲ့ တကယ့်လမ်းကြောင်းပြောင်းပြန်မှုတစ်ခုဆီ နီးကပ်လာနေတာလား?
အလားတူ အခွင့်အရေးတွေ ရှိမရှိ SOL, ETH, XRP, SUI နဲ့ DOGE ကိုလည်း စောင့်ကြည့်နေပါတယ်။
🐼 ဈေးကွက်အပ်ဒိတ်တွေနဲ့ ကွိုင်သတိပေးချက်တွေကို PandaTraders အသိုင်းအဝိုင်းထဲမှာ မျှဝေပေးသွားပါမယ်။
👇 ဆွေးနွေးကြရအောင်:
BTC က $69K ကို ရောက်လာရင် သင်က—
ဝက်ဝံဘက်က ဈေးပြန်နှိမ်တဲ့ လက္ခဏာပြပြီးနောက် အတိုရောင်းဖို့ ရှာမလား?
ဈေးပြန်တက်ချိန်မှာ အမြန်အမြတ်ရဖို့ အရှည်ဝယ်မလား?
အတည်ပြုချက်ရတဲ့အထိ ဘေးမှာပဲ စောင့်နေမလား?
အောက်မှာ သင့်အကြောင်းပြချက်ကို မျှဝေပါ။ ဈေးတက်မလား၊ ကျမလား ခန့်မှန်းရုံတင်မဟုတ်ဘဲ ဈေးကွက်ဖွဲ့စည်းပုံအကြောင်း ဆွေးနွေးကြရအောင်!
#Bitcoin #BTC #CryptoTrading
$BTC
{future}(BTCUSDT)
🚨 BTC ရဲ့ နောက်တစ်လှုပ်ရှားမှုက နှစ်ဖက်လုံးကို ထောင်ချောက်ဆင်နိုင်တယ်! ဒေါ်လာ ၆၅K ကို ရောက်ဦးမှာလား? 👀
Bitcoin ရဲ့ မကြာသေးခင်က ရောင်းချမှုတွေကြောင့် စိတ်ဝင်စားစရာကောင်းတဲ့ ဈေးကွက်ဖွဲ့စည်းပုံတစ်ခု ဖြစ်ပေါ်လာပါတယ်။ ဒါပေမဲ့ ကုန်သည်အများစု သတိမထားမိနိုင်တာတစ်ခု ရှိပါတယ်—
ဈေးနှုန်း ခဏပြန်တက်လာတာက ဝက်ဝံဈေးကွက်ဘက်က ထိန်းချုပ်မှု ဆုံးရှုံးသွားပြီလို့ မဆိုလိုပါဘူး။
ဒီလောက် ပြင်းထန်တဲ့ အကျဘက်လှုပ်ရှားမှုနောက်မှာ ရေတိုဝယ်လက်တွေ ဝင်လာပြီး BTC ကို $68,700–$69,400 အထိ တွန်းတင်နိုင်ပါတယ်။ ဒါပေမဲ့ အဲဒီဈေးတန်းဟာ အရေးကြီးတဲ့ ဆုံးဖြတ်ချက်ချရမယ့် နေရာ ဖြစ်လာနိုင်ပါတယ်။
🔥 ဈေးကွက်အပေါ် ကျွန်တော့်အမြင်:
အကြီးမားဆုံး အခွင့်အရေးက လက်ရှိဈေးကျမှုနောက် လိုက်ဝယ်တာ မဟုတ်လောက်ပါဘူး။ BTC ပြန်တက်လာတာကို စောင့်ကြည့်ပြီး၊ နောက်ကျမှ ဝယ်သူတွေ ဝင်လာတဲ့အခါ ဝက်ဝံဘက်က ဈေးနှိမ်ချမှုကို ပြသတဲ့ လက္ခဏာတွေ ပေါ်လာမလား စောင့်တာ ဖြစ်နိုင်ပါတယ်။
📊 BTC အတိုရောင်းရန် စောင့်ကြည့်စာရင်း
ဝင်ရောက်ရန် ဈေးတန်း: $68,500–$69,200
အရှုံးဖြတ်ဈေး: $70,600
အမြတ်ယူအဆင့် ၁: $67,600
အမြတ်ယူအဆင့် ၂: $66,500
အမြတ်ယူအဆင့် ၃: $65,000
ဝက်ဝံဘက် အရှိန်ဆက်ရှိနေပြီး ဈေးကွက်က ဒီအစီအစဉ်ကို အတည်ပြုပေးမယ်ဆိုရင် ကျွန်တော့်ရဲ့ အဓိကအာရုံစိုက်ရာက ဒေါ်လာ ၆၅K ပဲ ဖြစ်ပါတယ်။
ပိုကြီးမားတဲ့ ဆွေးနွေးချက်:
ဒီပြန်တက်မှုဟာ နောက်ထပ်တစ်ကြိမ် ဈေးကျမတိုင်မီ ငွေဖြစ်လွယ်မှု ဖန်တီးဖို့ ဈေးကွက်က လုပ်ဆောင်တဲ့ နည်းလမ်းတစ်ခု ဖြစ်နိုင်မလား?
ဒါမှမဟုတ် အတိုရောင်းသူတွေကို အံ့အားသင့်စေနိုင်တဲ့ တကယ့်လမ်းကြောင်းပြောင်းပြန်မှုတစ်ခုဆီ နီးကပ်လာနေတာလား?
အလားတူ အခွင့်အရေးတွေ ရှိမရှိ SOL, ETH, XRP, SUI နဲ့ DOGE ကိုလည်း စောင့်ကြည့်နေပါတယ်။
🐼 ဈေးကွက်အပ်ဒိတ်တွေနဲ့ ကွိုင်သတိပေးချက်တွေကို PandaTraders အသိုင်းအဝိုင်းထဲမှာ မျှဝေပေးသွားပါမယ်။
👇 ဆွေးနွေးကြရအောင်:
BTC က $69K ကို ရောက်လာရင် သင်က—
ဝက်ဝံဘက်က ဈေးပြန်နှိမ်တဲ့ လက္ခဏာပြပြီးနောက် အတိုရောင်းဖို့ ရှာမလား?
ဈေးပြန်တက်ချိန်မှာ အမြန်အမြတ်ရဖို့ အရှည်ဝယ်မလား?
အတည်ပြုချက်ရတဲ့အထိ ဘေးမှာပဲ စောင့်နေမလား?
အောက်မှာ သင့်အကြောင်းပြချက်ကို မျှဝေပါ။ ဈေးတက်မလား၊ ကျမလား ခန့်မှန်းရုံတင်မဟုတ်ဘဲ ဈေးကွက်ဖွဲ့စည်းပုံအကြောင်း ဆွေးနွေးကြရအောင်!
#Bitcoin #BTC #CryptoTrading
$BTC
Bitcoin ရဲ့ မကြာသေးခင်က ရောင်းချမှုတွေကြောင့် စိတ်ဝင်စားစရာကောင်းတဲ့ ဈေးကွက်ဖွဲ့စည်းပုံတစ်ခု ဖြစ်ပေါ်လာပါတယ်။ ဒါပေမဲ့ ကုန်သည်အများစု သတိမထားမိနိုင်တာတစ်ခု ရှိပါတယ်—
ဈေးနှုန်း ခဏပြန်တက်လာတာက ဝက်ဝံဈေးကွက်ဘက်က ထိန်းချုပ်မှု ဆုံးရှုံးသွားပြီလို့ မဆိုလိုပါဘူး။
ဒီလောက် ပြင်းထန်တဲ့ အကျဘက်လှုပ်ရှားမှုနောက်မှာ ရေတိုဝယ်လက်တွေ ဝင်လာပြီး BTC ကို $68,700–$69,400 အထိ တွန်းတင်နိုင်ပါတယ်။ ဒါပေမဲ့ အဲဒီဈေးတန်းဟာ အရေးကြီးတဲ့ ဆုံးဖြတ်ချက်ချရမယ့် နေရာ ဖြစ်လာနိုင်ပါတယ်။
🔥 ဈေးကွက်အပေါ် ကျွန်တော့်အမြင်:
အကြီးမားဆုံး အခွင့်အရေးက လက်ရှိဈေးကျမှုနောက် လိုက်ဝယ်တာ မဟုတ်လောက်ပါဘူး။ BTC ပြန်တက်လာတာကို စောင့်ကြည့်ပြီး၊ နောက်ကျမှ ဝယ်သူတွေ ဝင်လာတဲ့အခါ ဝက်ဝံဘက်က ဈေးနှိမ်ချမှုကို ပြသတဲ့ လက္ခဏာတွေ ပေါ်လာမလား စောင့်တာ ဖြစ်နိုင်ပါတယ်။
📊 BTC အတိုရောင်းရန် စောင့်ကြည့်စာရင်း
ဝင်ရောက်ရန် ဈေးတန်း: $68,500–$69,200
အရှုံးဖြတ်ဈေး: $70,600
အမြတ်ယူအဆင့် ၁: $67,600
အမြတ်ယူအဆင့် ၂: $66,500
အမြတ်ယူအဆင့် ၃: $65,000
ဝက်ဝံဘက် အရှိန်ဆက်ရှိနေပြီး ဈေးကွက်က ဒီအစီအစဉ်ကို အတည်ပြုပေးမယ်ဆိုရင် ကျွန်တော့်ရဲ့ အဓိကအာရုံစိုက်ရာက ဒေါ်လာ ၆၅K ပဲ ဖြစ်ပါတယ်။
ပိုကြီးမားတဲ့ ဆွေးနွေးချက်:
ဒီပြန်တက်မှုဟာ နောက်ထပ်တစ်ကြိမ် ဈေးကျမတိုင်မီ ငွေဖြစ်လွယ်မှု ဖန်တီးဖို့ ဈေးကွက်က လုပ်ဆောင်တဲ့ နည်းလမ်းတစ်ခု ဖြစ်နိုင်မလား?
ဒါမှမဟုတ် အတိုရောင်းသူတွေကို အံ့အားသင့်စေနိုင်တဲ့ တကယ့်လမ်းကြောင်းပြောင်းပြန်မှုတစ်ခုဆီ နီးကပ်လာနေတာလား?
အလားတူ အခွင့်အရေးတွေ ရှိမရှိ SOL, ETH, XRP, SUI နဲ့ DOGE ကိုလည်း စောင့်ကြည့်နေပါတယ်။
🐼 ဈေးကွက်အပ်ဒိတ်တွေနဲ့ ကွိုင်သတိပေးချက်တွေကို PandaTraders အသိုင်းအဝိုင်းထဲမှာ မျှဝေပေးသွားပါမယ်။
👇 ဆွေးနွေးကြရအောင်:
BTC က $69K ကို ရောက်လာရင် သင်က—
ဝက်ဝံဘက်က ဈေးပြန်နှိမ်တဲ့ လက္ခဏာပြပြီးနောက် အတိုရောင်းဖို့ ရှာမလား?
ဈေးပြန်တက်ချိန်မှာ အမြန်အမြတ်ရဖို့ အရှည်ဝယ်မလား?
အတည်ပြုချက်ရတဲ့အထိ ဘေးမှာပဲ စောင့်နေမလား?
အောက်မှာ သင့်အကြောင်းပြချက်ကို မျှဝေပါ။ ဈေးတက်မလား၊ ကျမလား ခန့်မှန်းရုံတင်မဟုတ်ဘဲ ဈေးကွက်ဖွဲ့စည်းပုံအကြောင်း ဆွေးနွေးကြရအောင်!
#Bitcoin #BTC #CryptoTrading
$BTC
1
623

·
--
Article
ဘာသာပြန်ဆိုချက် ကြည့်မည်
🚨 Guys, the alarm bells are ringing! 🔔$BTC 😱😱😱😱
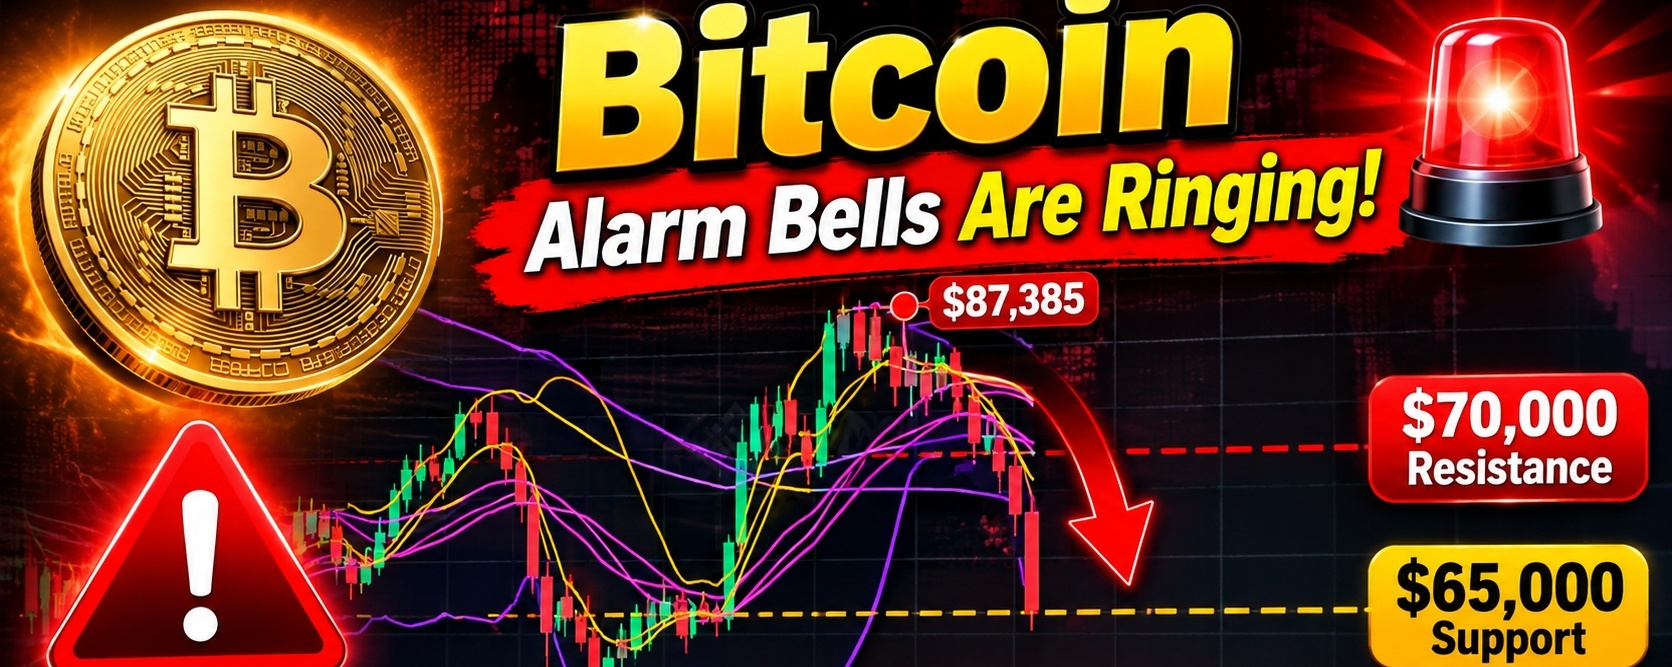
Guys, what is happening with Bitcoin right now deserves our attention. The coin has lost the $70,000 level and has fallen to around $67,000 following a strong selling wave that has lasted for several weeks. Looking at the 3-day chart, we can see that the price has broken below several important moving averages, while the MACD indicator remains in negative territory. In my view, this is not just an ordinary market movement that we can ignore; it is a sign that sellers are still controlling the market.
And this is not just about technical analysis; there are real economic pressures behind this decline. US inflation data for October came in higher than expected, bringing back concerns about interest rate hikes by the Federal Reserve, alongside rising US Treasury yields and a stronger dollar. In addition, spot Bitcoin ETFs have experienced significant outflows, reaching approximately $1.57 billion over five trading sessions, while leveraged long positions have faced a wave of liquidations. All these factors make a recovery more challenging at the moment.
From a technical perspective, I believe the $66,400–$65,000 zone has become one of the most important areas to watch. Losing this range could open the door toward $62,700, and possibly $60,000 if selling pressure continues. On the other hand, if Bitcoin manages to reclaim $70,000, then break above $72,000 and hold above it, we could see a rebound toward $74,000 and then $77,500. Here, we must distinguish between a temporary bounce and a genuine trend reversal.
As for the outlook, the latest CoinShares report places the base-case scenario within a broad range of $60,000 to $90,000, with sideways movement remaining a possibility unless a strong catalyst changes the market's direction. Meanwhile, StoneX analysis highlights $65,000 as an important support level. Personally, I would not rush into buying simply because the price has dropped, and I would not consider every rebound the beginning of a new bull market. I want to see liquidity returning, institutional fund flows improving, and key resistance levels being reclaimed before changing my market outlook.
Here is the question I want to ask you: Do you think Bitcoin is preparing for a strong rebound before the end of November, or are we facing another wave of selling that could take it down to $60,000 or even lower? 📉📈
#Bitcoin #BTC #CryptoMarket
{spot}(BTCUSDT)
🚨 Guys, the alarm bells are ringing! 🔔
$BTC 😱😱😱😱
Guys, what is happening with Bitcoin right now deserves our attention. The coin has lost the $70,000 level and has fallen to around $67,000 following a strong selling wave that has lasted for several weeks. Looking at the 3-day chart, we can see that the price has broken below several important moving averages, while the MACD indicator remains in negative territory. In my view, this is not just an ordinary market movement that we can ignore; it is a sign that sellers are still controlling the market.
And this is not just about technical analysis; there are real economic pressures behind this decline. US inflation data for October came in higher than expected, bringing back concerns about interest rate hikes by the Federal Reserve, alongside rising US Treasury yields and a stronger dollar. In addition, spot Bitcoin ETFs have experienced significant outflows, reaching approximately $1.57 billion over five trading sessions, while leveraged long positions have faced a wave of liquidations. All these factors make a recovery more challenging at the moment.
From a technical perspective, I believe the $66,400–$65,000 zone has become one of the most important areas to watch. Losing this range could open the door toward $62,700, and possibly $60,000 if selling pressure continues. On the other hand, if Bitcoin manages to reclaim $70,000, then break above $72,000 and hold above it, we could see a rebound toward $74,000 and then $77,500. Here, we must distinguish between a temporary bounce and a genuine trend reversal.
As for the outlook, the latest CoinShares report places the base-case scenario within a broad range of $60,000 to $90,000, with sideways movement remaining a possibility unless a strong catalyst changes the market's direction. Meanwhile, StoneX analysis highlights $65,000 as an important support level. Personally, I would not rush into buying simply because the price has dropped, and I would not consider every rebound the beginning of a new bull market. I want to see liquidity returning, institutional fund flows improving, and key resistance levels being reclaimed before changing my market outlook.
Here is the question I want to ask you: Do you think Bitcoin is preparing for a strong rebound before the end of November, or are we facing another wave of selling that could take it down to $60,000 or even lower? 📉📈
#Bitcoin #BTC #CryptoMarket
Guys, what is happening with Bitcoin right now deserves our attention. The coin has lost the $70,000 level and has fallen to around $67,000 following a strong selling wave that has lasted for several weeks. Looking at the 3-day chart, we can see that the price has broken below several important moving averages, while the MACD indicator remains in negative territory. In my view, this is not just an ordinary market movement that we can ignore; it is a sign that sellers are still controlling the market.
And this is not just about technical analysis; there are real economic pressures behind this decline. US inflation data for October came in higher than expected, bringing back concerns about interest rate hikes by the Federal Reserve, alongside rising US Treasury yields and a stronger dollar. In addition, spot Bitcoin ETFs have experienced significant outflows, reaching approximately $1.57 billion over five trading sessions, while leveraged long positions have faced a wave of liquidations. All these factors make a recovery more challenging at the moment.
From a technical perspective, I believe the $66,400–$65,000 zone has become one of the most important areas to watch. Losing this range could open the door toward $62,700, and possibly $60,000 if selling pressure continues. On the other hand, if Bitcoin manages to reclaim $70,000, then break above $72,000 and hold above it, we could see a rebound toward $74,000 and then $77,500. Here, we must distinguish between a temporary bounce and a genuine trend reversal.
As for the outlook, the latest CoinShares report places the base-case scenario within a broad range of $60,000 to $90,000, with sideways movement remaining a possibility unless a strong catalyst changes the market's direction. Meanwhile, StoneX analysis highlights $65,000 as an important support level. Personally, I would not rush into buying simply because the price has dropped, and I would not consider every rebound the beginning of a new bull market. I want to see liquidity returning, institutional fund flows improving, and key resistance levels being reclaimed before changing my market outlook.
Here is the question I want to ask you: Do you think Bitcoin is preparing for a strong rebound before the end of November, or are we facing another wave of selling that could take it down to $60,000 or even lower? 📉📈
#Bitcoin #BTC #CryptoMarket
54

ဘာသာပြန်ဆိုချက် ကြည့်မည်
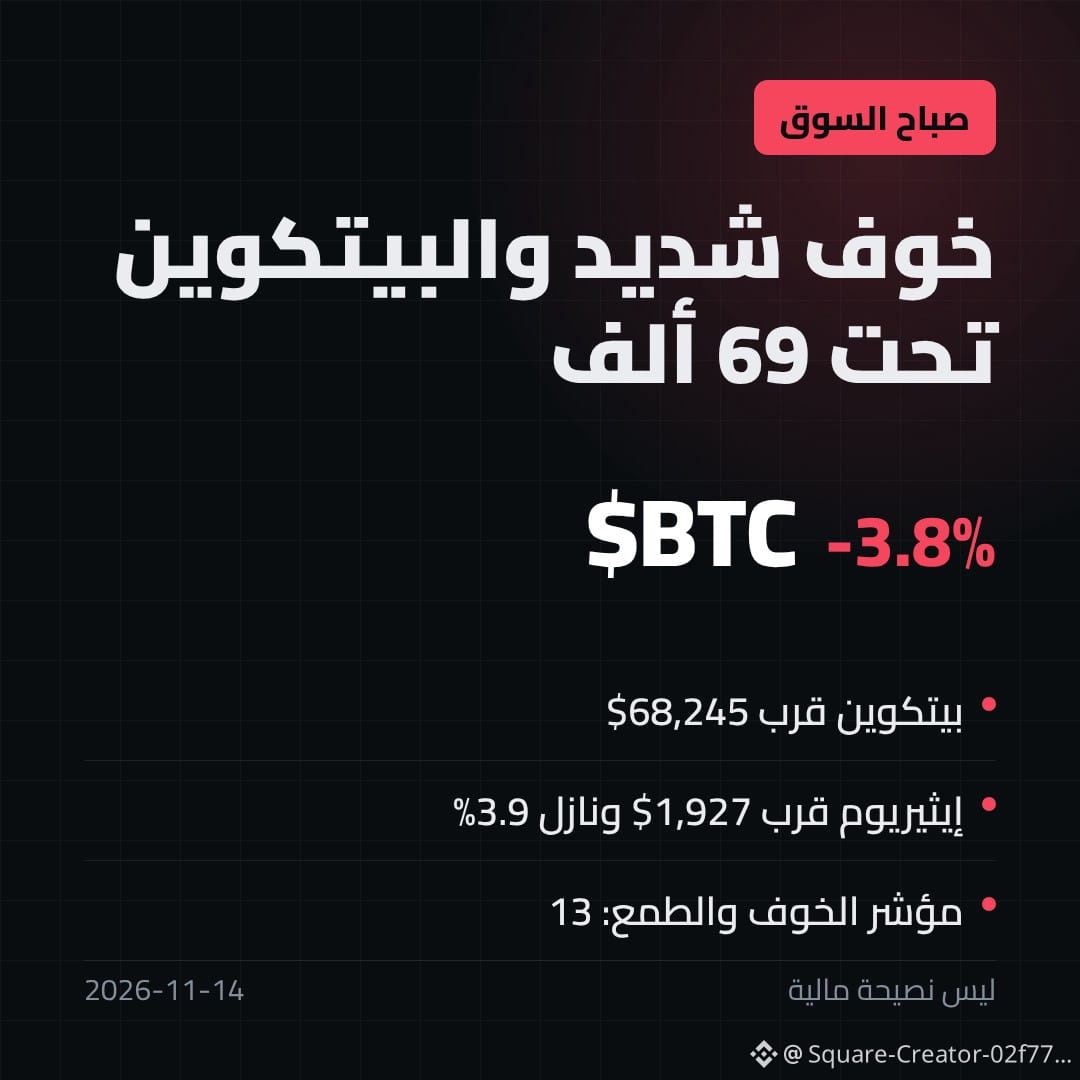
صباح الخير يا جماعة ☕ السوق صاحي بمزاج سيئ اليوم.
حسب بيانات CoinGecko فجر اليوم:
🔻 $BTC حوالي 68,245$ ونازل 3.8% خلال 24 ساعة
🔻 $ETH حوالي 1,927$ ونازل 3.9%
🔻 القيمة السوقية الكلية تقريباً 2.4 تريليون، ونازلة 3.1%
والأهم: مؤشر الخوف والطمع وصل 13، يعني "خوف شديد". قبل شهر كان 53!
شخصياً بهيج أيام أحاول ما أفتح التطبيق كل خمس دقايق 😅 الهدوء أهم شي.
ليس نصيحة مالية.
انتو شلون بديتوا يومكم؟ قلقانين لو متعودين؟
#BinanceSquare #Bitcoin #CryptoMarket
صباح الخير يا جماعة ☕ السوق صاحي بمزاج سيئ اليوم.
حسب بيانات CoinGecko فجر اليوم:
🔻 $BTC حوالي 68,245$ ونازل 3.8% خلال 24 ساعة
🔻 $ETH حوالي 1,927$ ونازل 3.9%
🔻 القيمة السوقية الكلية تقريباً 2.4 تريليون، ونازلة 3.1%
والأهم: مؤشر الخوف والطمع وصل 13، يعني "خوف شديد". قبل شهر كان 53!
شخصياً بهيج أيام أحاول ما أفتح التطبيق كل خمس دقايق 😅 الهدوء أهم شي.
ليس نصيحة مالية.
انتو شلون بديتوا يومكم؟ قلقانين لو متعودين؟
#BinanceSquare #Bitcoin #CryptoMarket
حسب بيانات CoinGecko فجر اليوم:
🔻 $BTC حوالي 68,245$ ونازل 3.8% خلال 24 ساعة
🔻 $ETH حوالي 1,927$ ونازل 3.9%
🔻 القيمة السوقية الكلية تقريباً 2.4 تريليون، ونازلة 3.1%
والأهم: مؤشر الخوف والطمع وصل 13، يعني "خوف شديد". قبل شهر كان 53!
شخصياً بهيج أيام أحاول ما أفتح التطبيق كل خمس دقايق 😅 الهدوء أهم شي.
ليس نصيحة مالية.
انتو شلون بديتوا يومكم؟ قلقانين لو متعودين؟
#BinanceSquare #Bitcoin #CryptoMarket
295

ဘာသာပြန်ဆိုချက် ကြည့်မည်
🚨 Se fueron 14.200 MILLONES de dólares de las stablecoins en un mes… la gasolina para comprar cripto se está acabando 👀
Es la mayor salida desde 2022, y el precio lo está sintiendo.
▪️ Bitcoin (~68.900): tocó ~67.700, su nivel más bajo desde agosto. Las stablecoins son el dinero que espera para comprar; si la gente las cambia por dólares y se va, hay menos compradores. Y los ETF completaron 6 días seguidos de salidas con -284M en el cierre del día de ayer jueves.
▪️ Ethereum (~1.950): sigue debajo de los 2.000 y sus ETF también suman 6 días seguidos de salidas. Ojo: su cofundador ahora defiende a ETH como reserva de valor, no solo como "gasolina" para usar la red, un cambio de discurso pensado a largo plazo.
▪️ AVAX (~8,40): aguanta en verde con todo el mercado en rojo. La Bolsa de Nueva York eligió a Avalanche para registrar y liquidar su plataforma de acciones tokenizadas 24/7, pendiente de aprobación. Mientras defienda los 8,10, la noticia le da soporte.
El miedo está en 20 de 100. La señal de dinero nuevo será cuando las stablecoins vuelvan a crecer.
¿Compras el miedo o esperas a que vuelva la gasolina? 👇
#Bitcoin #ETH #AVAX
🚨 Se fueron 14.200 MILLONES de dólares de las stablecoins en un mes… la gasolina para comprar cripto se está acabando 👀
Es la mayor salida desde 2022, y el precio lo está sintiendo.
▪️ Bitcoin (~68.900): tocó ~67.700, su nivel más bajo desde agosto. Las stablecoins son el dinero que espera para comprar; si la gente las cambia por dólares y se va, hay menos compradores. Y los ETF completaron 6 días seguidos de salidas con -284M en el cierre del día de ayer jueves.
▪️ Ethereum (~1.950): sigue debajo de los 2.000 y sus ETF también suman 6 días seguidos de salidas. Ojo: su cofundador ahora defiende a ETH como reserva de valor, no solo como "gasolina" para usar la red, un cambio de discurso pensado a largo plazo.
▪️ AVAX (~8,40): aguanta en verde con todo el mercado en rojo. La Bolsa de Nueva York eligió a Avalanche para registrar y liquidar su plataforma de acciones tokenizadas 24/7, pendiente de aprobación. Mientras defienda los 8,10, la noticia le da soporte.
El miedo está en 20 de 100. La señal de dinero nuevo será cuando las stablecoins vuelvan a crecer.
¿Compras el miedo o esperas a que vuelva la gasolina? 👇
#Bitcoin #ETH #AVAX
Es la mayor salida desde 2022, y el precio lo está sintiendo.
▪️ Bitcoin (~68.900): tocó ~67.700, su nivel más bajo desde agosto. Las stablecoins son el dinero que espera para comprar; si la gente las cambia por dólares y se va, hay menos compradores. Y los ETF completaron 6 días seguidos de salidas con -284M en el cierre del día de ayer jueves.
▪️ Ethereum (~1.950): sigue debajo de los 2.000 y sus ETF también suman 6 días seguidos de salidas. Ojo: su cofundador ahora defiende a ETH como reserva de valor, no solo como "gasolina" para usar la red, un cambio de discurso pensado a largo plazo.
▪️ AVAX (~8,40): aguanta en verde con todo el mercado en rojo. La Bolsa de Nueva York eligió a Avalanche para registrar y liquidar su plataforma de acciones tokenizadas 24/7, pendiente de aprobación. Mientras defienda los 8,10, la noticia le da soporte.
El miedo está en 20 de 100. La señal de dinero nuevo será cuando las stablecoins vuelvan a crecer.
¿Compras el miedo o esperas a que vuelva la gasolina? 👇
#Bitcoin #ETH #AVAX

464
·
--
ဘာသာပြန်ဆိုချက် ကြည့်မည်
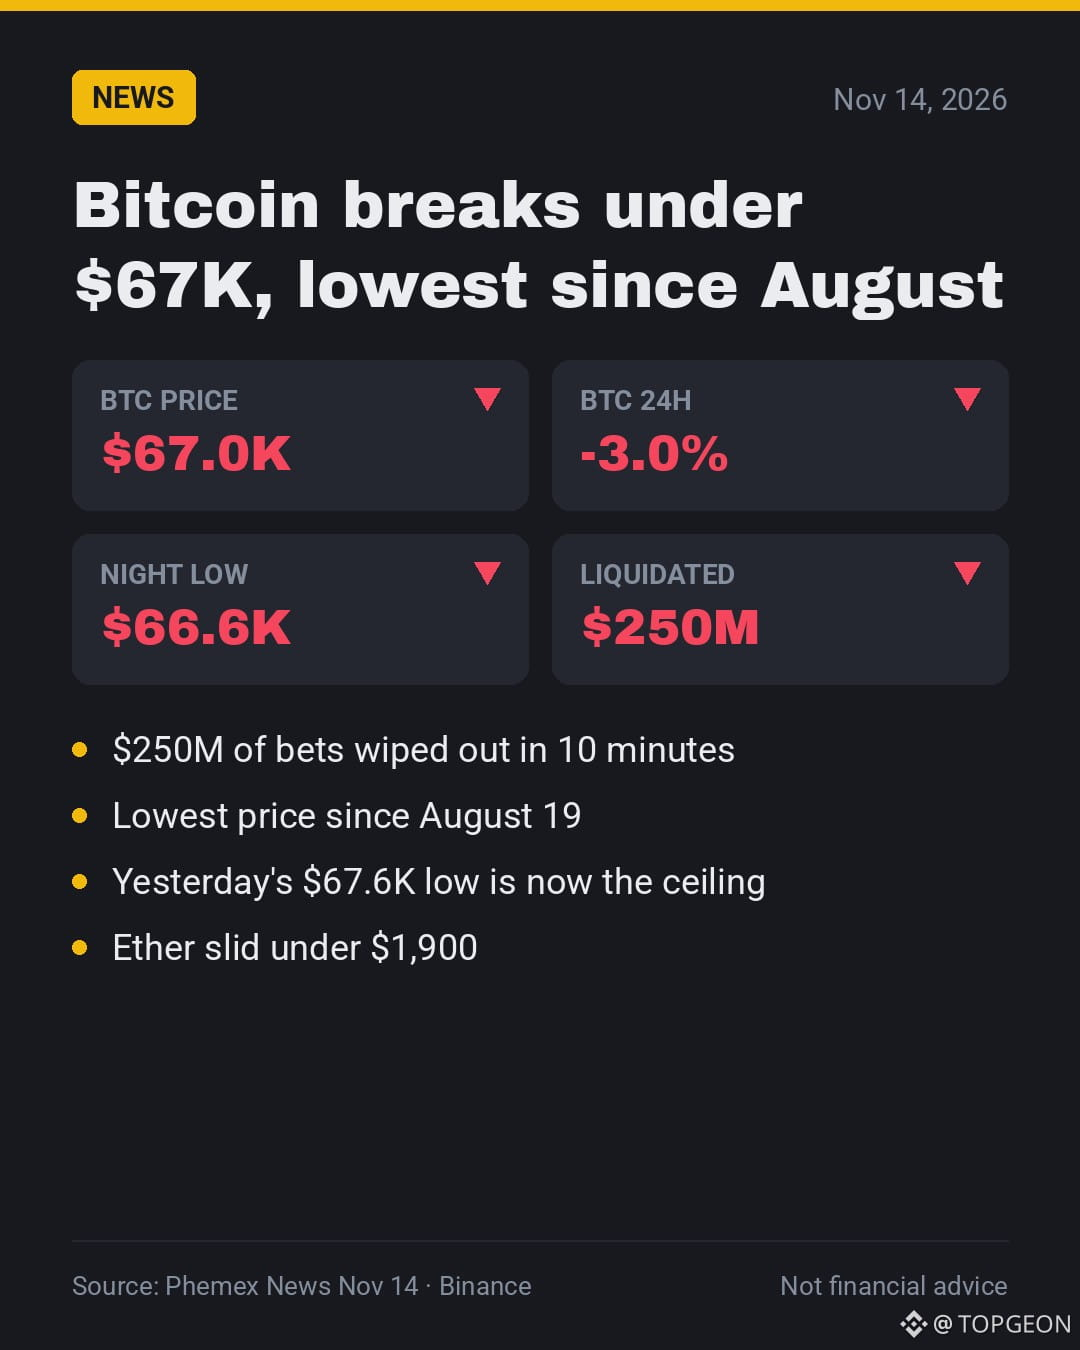
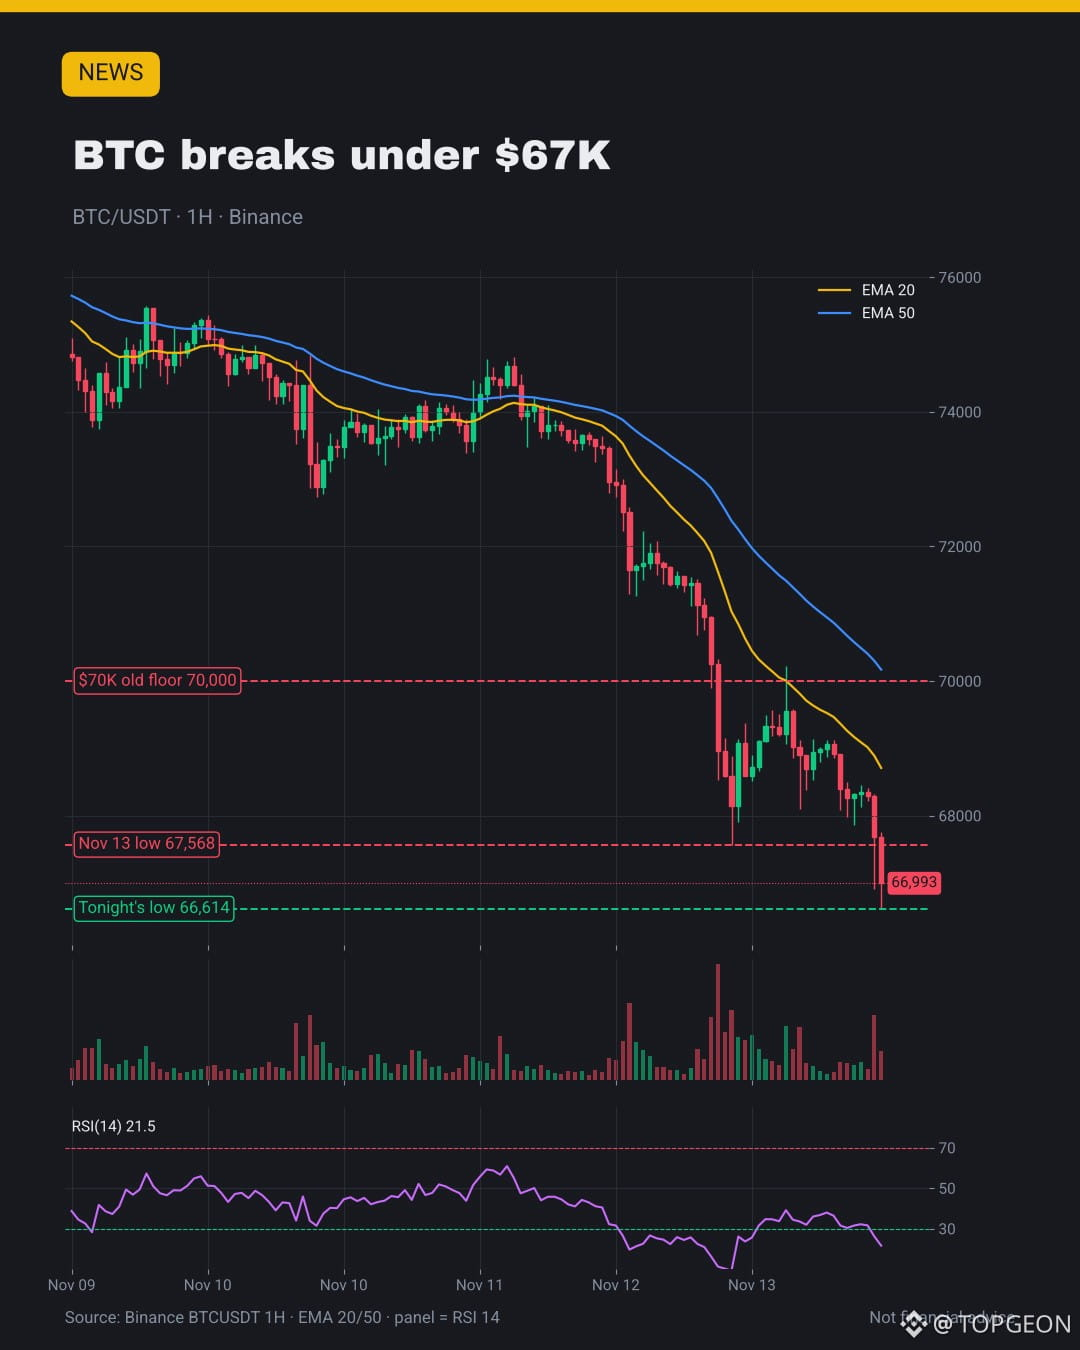
🤔 Is $BTC finally washing out under $67K?
💥 About $250M of bets got wiped in 10 minutes overnight.
📉 That's the lowest price since mid-August.
👀 Yesterday's $67.6K low is now the first ceiling.
🎯 My take: forced selling like this often marks a short-term low, not the final one.
💬 Buying this flush or waiting lower? 👇
#Bitcoin #CryptoMarket
🤔 Is $BTC finally washing out under $67K?
💥 About $250M of bets got wiped in 10 minutes overnight.
📉 That's the lowest price since mid-August.
👀 Yesterday's $67.6K low is now the first ceiling.
🎯 My take: forced selling like this often marks a short-term low, not the final one.
💬 Buying this flush or waiting lower? 👇
#Bitcoin #CryptoMarket
💥 About $250M of bets got wiped in 10 minutes overnight.
📉 That's the lowest price since mid-August.
👀 Yesterday's $67.6K low is now the first ceiling.
🎯 My take: forced selling like this often marks a short-term low, not the final one.
💬 Buying this flush or waiting lower? 👇
#Bitcoin #CryptoMarket
227

·
--
{future}(BTCUSDT)
AI စတော့ရှယ်ယာ မတည်ငြိမ်မှုများနှင့်အတူ Crypto သည် $BTC $70K အောက်သို့ ကျဆင်း
ပြီးခဲ့သည့် ၇ ရက်အတွင်း (နိုဝင်ဘာ ၇–၁၄) AI ရှယ်ယာများအပေါ် စွန့်စားမှုရှောင်ရှားသည့် အပြောင်းအလဲ ကျယ်ပြန့်လာစဉ် BTC သည် ၎င်း၏ $70,000 ထောက်ခံမှုအဆင့်ကို ဆုံးရှုံးခဲ့ပြီး ကမ္ဘာ့ crypto ဈေးကွက်တန်ဖိုးသည် ခန့်မှန်းခြေ $150B–$250B ကျဆင်းခဲ့သည် (ခန့်မှန်းခြေ $2.55T မှ $2.35T–$2.40T အဆင့်သို့ လျှောကျသွားသည်)။
ဇယားဖွဲ့စည်းပုံနှင့် အရေးကြီးအဆင့်များ (BTC 4H / Daily):
• ထောက်ခံမှုအဆင့် ပြောင်းလဲမှု မအောင်မြင်ခြင်း ($70,000): အကြိမ်ကြိမ် စမ်းသပ်ပြီးနောက် $70,000 သည် ရက်သတ္တပတ်များစွာကြာ အဓိကထောက်ခံမှုအဆင့်မှ ချက်ချင်းရင်ဆိုင်ရသည့် ခုခံမှုအဆင့်သို့ ပြောင်းလဲသွားကာ stop-loss များ ဆက်တိုက်ဖြစ်ပေါ်စေပြီး $68,000 အောက်ရှိ ငွေဖြစ်လွယ်မှုအိတ်ကပ်အနီးသို့ ဈေးနှုန်းကို တွန်းပို့ခဲ့သည်။
• ပျက်ပြယ်စေမည့်အဆင့်: ဈေးကျဆင်းမှုကို ပျက်ပြယ်စေရန် ဝယ်လက်များသည် ပမာဏမြင့်မားသည့် နေ့စဉ်ပိတ်ဈေးကို $70,500 အထက် ပြန်ရောက်အောင် လုပ်ဆောင်ရန်လိုသည်။ ထိုသို့မဟုတ်ပါက ဝယ်လိုအားနည်းသော အောက်ပိုင်းဇုန်များ ဆက်လက်သက်ရောက်နေမည်ဖြစ်သည်။
ဤပြန်လည်ကျဆင်းမှု ဖြစ်ပွားရသည့်အကြောင်းရင်းများ (ဈေးကွက်အချင်းချင်း ဒေတာ):
• ဆင်းသက်လာဈေးကွက်တွင် လီဗာရေ့ချ်လျှော့ချခြင်း: Futures ကုန်သည်များသည် အဓိကလှိုင်းကြီးနှစ်ခုအတွင်း အတင်းအကျပ် ဖျက်သိမ်းမှု $2.4B ကျော်ကို ကြုံတွေ့ခဲ့ရသည် (နိုဝင်ဘာ ၉ ရက်တွင် $1.15B နှင့် နိုဝင်ဘာ ၁၂–၁၃ ရက်တွင် $1.3B)။ ယင်းကြောင့် $70K အထက်တွင် တည်ဆောက်ထားသော လီဗာရေ့ချ်လွန်ကဲသည့် long position များကို ဖယ်ရှားခဲ့သည်။
• Spot ETF မှ ငွေထွက်မှုများ: နိုဝင်ဘာလအစောပိုင်းတွင် အမေရိကန် spot Bitcoin ETF များ၏ အသားတင်ငွေထွက်မှုသည် ခန့်မှန်းခြေ $1.88B အထိ ရောက်ရှိခဲ့ပြီး ဈေးကျချိန်တွင် အဖွဲ့အစည်းဆိုင်ရာ spot ဝယ်လိုအား၏ အရေးကြီးသော ရင်းမြစ်တစ်ခုကို ဖယ်ရှားသွားခဲ့သည်။
• ရှယ်ယာဈေးကွက်နှင့် ဆက်စပ်မှု၊ မက်ခရိုစီးပွားရေး ဖိအား: Crypto ကျဆင်းမှုသည် အမေရိကန်ရှယ်ယာဈေးကွက်ရှိ AI ကဏ္ဍ၏ ပြင်းထန်သော မတည်ငြိမ်မှုကို ထင်ဟပ်ခဲ့သည်။ Nvidia ၏ ဦးဆောင်မှုအပြောင်းအလဲနှင့် ဘုတ်အဖွဲ့စုံစမ်းစစ်ဆေးမှုနောက်ပိုင်း နိုဝင်ဘာ ၁၂ ရက်တွင် တစ်နေ့တာအတွင်း ဈေးကွက်တန်ဖိုး $601B အထိ ပျောက်ဆုံးခဲ့သည်။ ထို့အပြင် ငွေကြေးဖောင်းပွမှုဒေတာ ဆက်လက်မြင့်မားနေခြင်းနှင့် အမေရိကန်ဒေါ်လာ ပိုမိုအားကောင်းလာခြင်းတို့က ဖိအားကို ပိုမိုတိုးစေခဲ့သည်။
နောက်ထပ် စောင့်ကြည့်ရမည့်အရာများ:
အမေရိကန် spot ETF ငွေစီးဆင်းမှုများ တည်ငြိမ်လာပြီး BTC သည် နေ့စဉ်ပိတ်ဈေးများတွင် $70,000 ကို ပြန်လည်ရယူနိုင်သည်အထိ ဈေးနှုန်းလှုပ်ရှားမှုသည် မက်ခရိုစီးပွားရေး ငွေဖြစ်လွယ်မှုနှင့် အမေရိကန်နည်းပညာကဏ္ဍအပေါ် သဘောထားတို့အပေါ် အကဲဆတ်နေဦးမည်ဖြစ်သည်။
$BTC အတွက် အောက်ခြေဈေးကို အတည်ပြုရန် မည်သည့်ညွှန်းကိန်းကို ဦးစားပေးစောင့်ကြည့်နေပါသလဲ—spot ETF ငွေဝင်မှု ပြန်လည်ကောင်းမွန်လာခြင်းလား၊ futures funding rate များ ပြန်လည်ချိန်ညှိလာခြင်းလား?👇
crypto သတင်းများအတွက် ကျွန်တော့်ကို follow လုပ်ပါ😉👍
$BTC #Bitcoin #MarketPullback #USPPIMissMayEaseBTCPressure
$AKE
AI စတော့ရှယ်ယာ မတည်ငြိမ်မှုများနှင့်အတူ Crypto သည် $BTC $70K အောက်သို့ ကျဆင်း
ပြီးခဲ့သည့် ၇ ရက်အတွင်း (နိုဝင်ဘာ ၇–၁၄) AI ရှယ်ယာများအပေါ် စွန့်စားမှုရှောင်ရှားသည့် အပြောင်းအလဲ ကျယ်ပြန့်လာစဉ် BTC သည် ၎င်း၏ $70,000 ထောက်ခံမှုအဆင့်ကို ဆုံးရှုံးခဲ့ပြီး ကမ္ဘာ့ crypto ဈေးကွက်တန်ဖိုးသည် ခန့်မှန်းခြေ $150B–$250B ကျဆင်းခဲ့သည် (ခန့်မှန်းခြေ $2.55T မှ $2.35T–$2.40T အဆင့်သို့ လျှောကျသွားသည်)။
ဇယားဖွဲ့စည်းပုံနှင့် အရေးကြီးအဆင့်များ (BTC 4H / Daily):
• ထောက်ခံမှုအဆင့် ပြောင်းလဲမှု မအောင်မြင်ခြင်း ($70,000): အကြိမ်ကြိမ် စမ်းသပ်ပြီးနောက် $70,000 သည် ရက်သတ္တပတ်များစွာကြာ အဓိကထောက်ခံမှုအဆင့်မှ ချက်ချင်းရင်ဆိုင်ရသည့် ခုခံမှုအဆင့်သို့ ပြောင်းလဲသွားကာ stop-loss များ ဆက်တိုက်ဖြစ်ပေါ်စေပြီး $68,000 အောက်ရှိ ငွေဖြစ်လွယ်မှုအိတ်ကပ်အနီးသို့ ဈေးနှုန်းကို တွန်းပို့ခဲ့သည်။
• ပျက်ပြယ်စေမည့်အဆင့်: ဈေးကျဆင်းမှုကို ပျက်ပြယ်စေရန် ဝယ်လက်များသည် ပမာဏမြင့်မားသည့် နေ့စဉ်ပိတ်ဈေးကို $70,500 အထက် ပြန်ရောက်အောင် လုပ်ဆောင်ရန်လိုသည်။ ထိုသို့မဟုတ်ပါက ဝယ်လိုအားနည်းသော အောက်ပိုင်းဇုန်များ ဆက်လက်သက်ရောက်နေမည်ဖြစ်သည်။
ဤပြန်လည်ကျဆင်းမှု ဖြစ်ပွားရသည့်အကြောင်းရင်းများ (ဈေးကွက်အချင်းချင်း ဒေတာ):
• ဆင်းသက်လာဈေးကွက်တွင် လီဗာရေ့ချ်လျှော့ချခြင်း: Futures ကုန်သည်များသည် အဓိကလှိုင်းကြီးနှစ်ခုအတွင်း အတင်းအကျပ် ဖျက်သိမ်းမှု $2.4B ကျော်ကို ကြုံတွေ့ခဲ့ရသည် (နိုဝင်ဘာ ၉ ရက်တွင် $1.15B နှင့် နိုဝင်ဘာ ၁၂–၁၃ ရက်တွင် $1.3B)။ ယင်းကြောင့် $70K အထက်တွင် တည်ဆောက်ထားသော လီဗာရေ့ချ်လွန်ကဲသည့် long position များကို ဖယ်ရှားခဲ့သည်။
• Spot ETF မှ ငွေထွက်မှုများ: နိုဝင်ဘာလအစောပိုင်းတွင် အမေရိကန် spot Bitcoin ETF များ၏ အသားတင်ငွေထွက်မှုသည် ခန့်မှန်းခြေ $1.88B အထိ ရောက်ရှိခဲ့ပြီး ဈေးကျချိန်တွင် အဖွဲ့အစည်းဆိုင်ရာ spot ဝယ်လိုအား၏ အရေးကြီးသော ရင်းမြစ်တစ်ခုကို ဖယ်ရှားသွားခဲ့သည်။
• ရှယ်ယာဈေးကွက်နှင့် ဆက်စပ်မှု၊ မက်ခရိုစီးပွားရေး ဖိအား: Crypto ကျဆင်းမှုသည် အမေရိကန်ရှယ်ယာဈေးကွက်ရှိ AI ကဏ္ဍ၏ ပြင်းထန်သော မတည်ငြိမ်မှုကို ထင်ဟပ်ခဲ့သည်။ Nvidia ၏ ဦးဆောင်မှုအပြောင်းအလဲနှင့် ဘုတ်အဖွဲ့စုံစမ်းစစ်ဆေးမှုနောက်ပိုင်း နိုဝင်ဘာ ၁၂ ရက်တွင် တစ်နေ့တာအတွင်း ဈေးကွက်တန်ဖိုး $601B အထိ ပျောက်ဆုံးခဲ့သည်။ ထို့အပြင် ငွေကြေးဖောင်းပွမှုဒေတာ ဆက်လက်မြင့်မားနေခြင်းနှင့် အမေရိကန်ဒေါ်လာ ပိုမိုအားကောင်းလာခြင်းတို့က ဖိအားကို ပိုမိုတိုးစေခဲ့သည်။
နောက်ထပ် စောင့်ကြည့်ရမည့်အရာများ:
အမေရိကန် spot ETF ငွေစီးဆင်းမှုများ တည်ငြိမ်လာပြီး BTC သည် နေ့စဉ်ပိတ်ဈေးများတွင် $70,000 ကို ပြန်လည်ရယူနိုင်သည်အထိ ဈေးနှုန်းလှုပ်ရှားမှုသည် မက်ခရိုစီးပွားရေး ငွေဖြစ်လွယ်မှုနှင့် အမေရိကန်နည်းပညာကဏ္ဍအပေါ် သဘောထားတို့အပေါ် အကဲဆတ်နေဦးမည်ဖြစ်သည်။
$BTC အတွက် အောက်ခြေဈေးကို အတည်ပြုရန် မည်သည့်ညွှန်းကိန်းကို ဦးစားပေးစောင့်ကြည့်နေပါသလဲ—spot ETF ငွေဝင်မှု ပြန်လည်ကောင်းမွန်လာခြင်းလား၊ futures funding rate များ ပြန်လည်ချိန်ညှိလာခြင်းလား?👇
crypto သတင်းများအတွက် ကျွန်တော့်ကို follow လုပ်ပါ😉👍
$BTC #Bitcoin #MarketPullback #USPPIMissMayEaseBTCPressure
$AKE
ပြီးခဲ့သည့် ၇ ရက်အတွင်း (နိုဝင်ဘာ ၇–၁၄) AI ရှယ်ယာများအပေါ် စွန့်စားမှုရှောင်ရှားသည့် အပြောင်းအလဲ ကျယ်ပြန့်လာစဉ် BTC သည် ၎င်း၏ $70,000 ထောက်ခံမှုအဆင့်ကို ဆုံးရှုံးခဲ့ပြီး ကမ္ဘာ့ crypto ဈေးကွက်တန်ဖိုးသည် ခန့်မှန်းခြေ $150B–$250B ကျဆင်းခဲ့သည် (ခန့်မှန်းခြေ $2.55T မှ $2.35T–$2.40T အဆင့်သို့ လျှောကျသွားသည်)။
ဇယားဖွဲ့စည်းပုံနှင့် အရေးကြီးအဆင့်များ (BTC 4H / Daily):
• ထောက်ခံမှုအဆင့် ပြောင်းလဲမှု မအောင်မြင်ခြင်း ($70,000): အကြိမ်ကြိမ် စမ်းသပ်ပြီးနောက် $70,000 သည် ရက်သတ္တပတ်များစွာကြာ အဓိကထောက်ခံမှုအဆင့်မှ ချက်ချင်းရင်ဆိုင်ရသည့် ခုခံမှုအဆင့်သို့ ပြောင်းလဲသွားကာ stop-loss များ ဆက်တိုက်ဖြစ်ပေါ်စေပြီး $68,000 အောက်ရှိ ငွေဖြစ်လွယ်မှုအိတ်ကပ်အနီးသို့ ဈေးနှုန်းကို တွန်းပို့ခဲ့သည်။
• ပျက်ပြယ်စေမည့်အဆင့်: ဈေးကျဆင်းမှုကို ပျက်ပြယ်စေရန် ဝယ်လက်များသည် ပမာဏမြင့်မားသည့် နေ့စဉ်ပိတ်ဈေးကို $70,500 အထက် ပြန်ရောက်အောင် လုပ်ဆောင်ရန်လိုသည်။ ထိုသို့မဟုတ်ပါက ဝယ်လိုအားနည်းသော အောက်ပိုင်းဇုန်များ ဆက်လက်သက်ရောက်နေမည်ဖြစ်သည်။
ဤပြန်လည်ကျဆင်းမှု ဖြစ်ပွားရသည့်အကြောင်းရင်းများ (ဈေးကွက်အချင်းချင်း ဒေတာ):
• ဆင်းသက်လာဈေးကွက်တွင် လီဗာရေ့ချ်လျှော့ချခြင်း: Futures ကုန်သည်များသည် အဓိကလှိုင်းကြီးနှစ်ခုအတွင်း အတင်းအကျပ် ဖျက်သိမ်းမှု $2.4B ကျော်ကို ကြုံတွေ့ခဲ့ရသည် (နိုဝင်ဘာ ၉ ရက်တွင် $1.15B နှင့် နိုဝင်ဘာ ၁၂–၁၃ ရက်တွင် $1.3B)။ ယင်းကြောင့် $70K အထက်တွင် တည်ဆောက်ထားသော လီဗာရေ့ချ်လွန်ကဲသည့် long position များကို ဖယ်ရှားခဲ့သည်။
• Spot ETF မှ ငွေထွက်မှုများ: နိုဝင်ဘာလအစောပိုင်းတွင် အမေရိကန် spot Bitcoin ETF များ၏ အသားတင်ငွေထွက်မှုသည် ခန့်မှန်းခြေ $1.88B အထိ ရောက်ရှိခဲ့ပြီး ဈေးကျချိန်တွင် အဖွဲ့အစည်းဆိုင်ရာ spot ဝယ်လိုအား၏ အရေးကြီးသော ရင်းမြစ်တစ်ခုကို ဖယ်ရှားသွားခဲ့သည်။
• ရှယ်ယာဈေးကွက်နှင့် ဆက်စပ်မှု၊ မက်ခရိုစီးပွားရေး ဖိအား: Crypto ကျဆင်းမှုသည် အမေရိကန်ရှယ်ယာဈေးကွက်ရှိ AI ကဏ္ဍ၏ ပြင်းထန်သော မတည်ငြိမ်မှုကို ထင်ဟပ်ခဲ့သည်။ Nvidia ၏ ဦးဆောင်မှုအပြောင်းအလဲနှင့် ဘုတ်အဖွဲ့စုံစမ်းစစ်ဆေးမှုနောက်ပိုင်း နိုဝင်ဘာ ၁၂ ရက်တွင် တစ်နေ့တာအတွင်း ဈေးကွက်တန်ဖိုး $601B အထိ ပျောက်ဆုံးခဲ့သည်။ ထို့အပြင် ငွေကြေးဖောင်းပွမှုဒေတာ ဆက်လက်မြင့်မားနေခြင်းနှင့် အမေရိကန်ဒေါ်လာ ပိုမိုအားကောင်းလာခြင်းတို့က ဖိအားကို ပိုမိုတိုးစေခဲ့သည်။
နောက်ထပ် စောင့်ကြည့်ရမည့်အရာများ:
အမေရိကန် spot ETF ငွေစီးဆင်းမှုများ တည်ငြိမ်လာပြီး BTC သည် နေ့စဉ်ပိတ်ဈေးများတွင် $70,000 ကို ပြန်လည်ရယူနိုင်သည်အထိ ဈေးနှုန်းလှုပ်ရှားမှုသည် မက်ခရိုစီးပွားရေး ငွေဖြစ်လွယ်မှုနှင့် အမေရိကန်နည်းပညာကဏ္ဍအပေါ် သဘောထားတို့အပေါ် အကဲဆတ်နေဦးမည်ဖြစ်သည်။
$BTC အတွက် အောက်ခြေဈေးကို အတည်ပြုရန် မည်သည့်ညွှန်းကိန်းကို ဦးစားပေးစောင့်ကြည့်နေပါသလဲ—spot ETF ငွေဝင်မှု ပြန်လည်ကောင်းမွန်လာခြင်းလား၊ futures funding rate များ ပြန်လည်ချိန်ညှိလာခြင်းလား?👇
crypto သတင်းများအတွက် ကျွန်တော့်ကို follow လုပ်ပါ😉👍
$BTC #Bitcoin #MarketPullback #USPPIMissMayEaseBTCPressure
$AKE

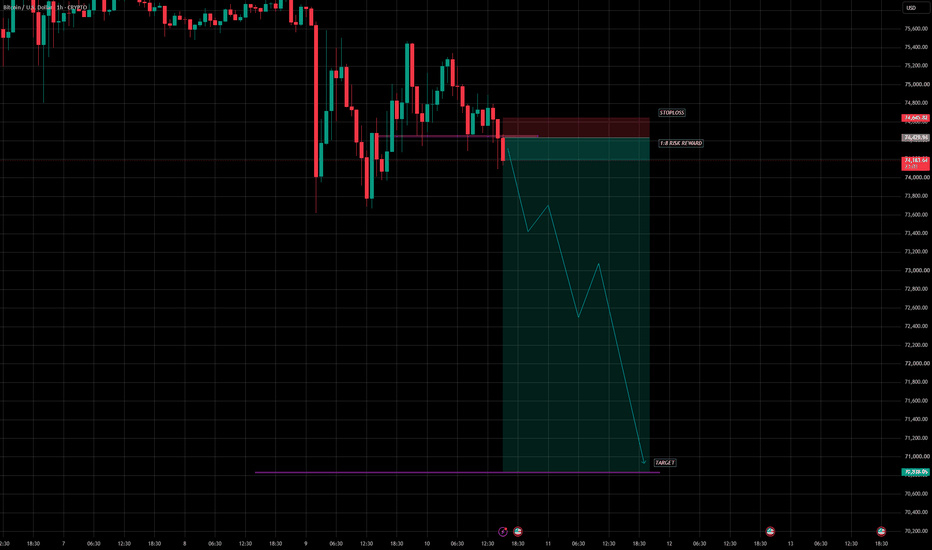
Aleks8234:
btc
4
1
30

ဘာသာပြန်ဆိုချက် ကြည့်မည်
Crypto market update 📊
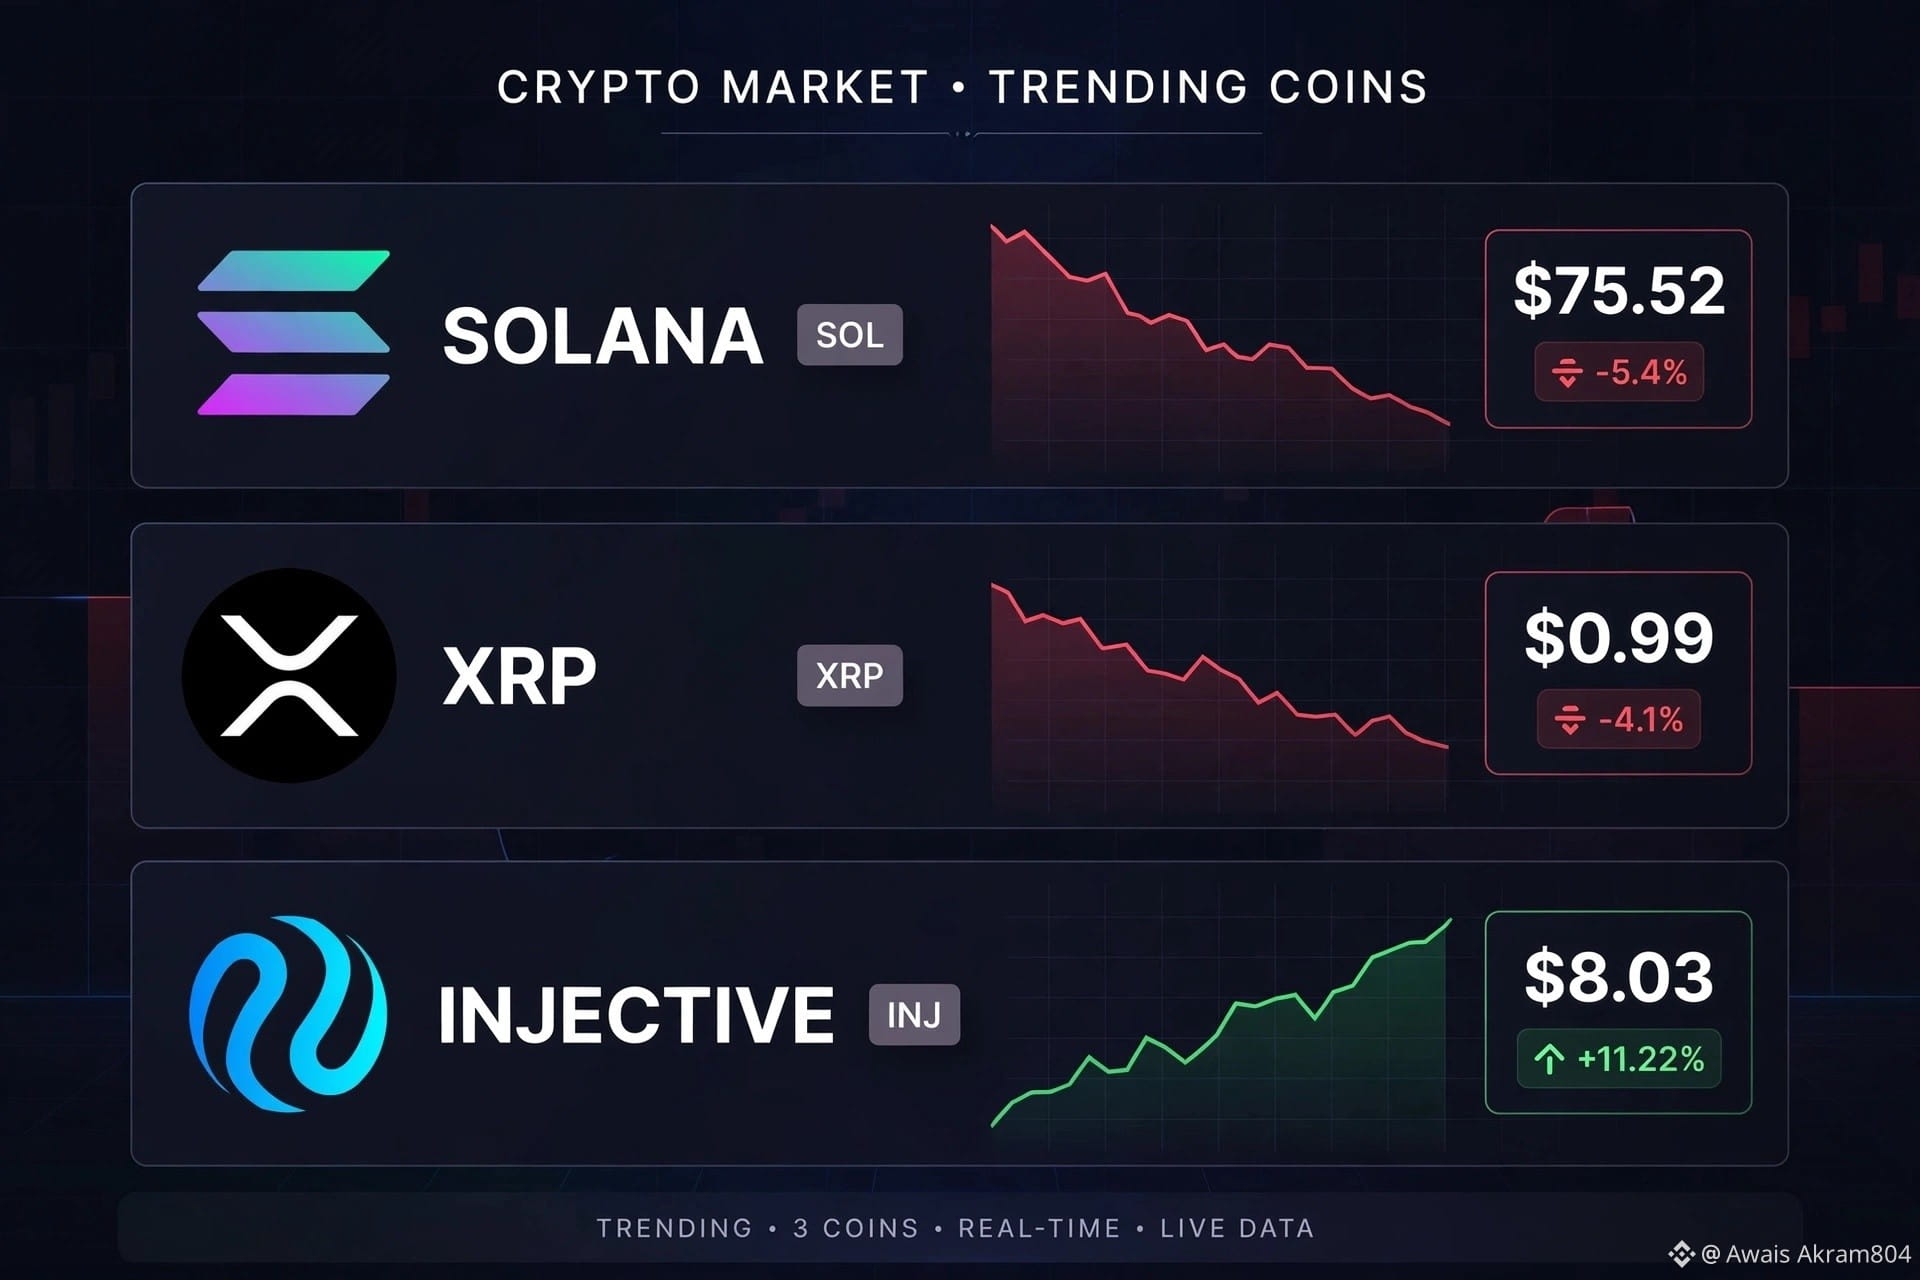
🔴 $SOL — $75.52, down 5.4%
Biggest fall in the top coins today, broke below $80.
🔴 $XRP — $0.99, down 4.1%
Lost the $1 level, down from $1.35 just 10 days ago.
🟢 $INJ — $8.03, up 11.22%
Top gainer on Binance today, while most of the market is down.
Bitcoin ETFs saw $185M outflows yesterday, and Fear & Greed is at 20 Extreme Fear.
Which one are you watching $SOL, $XRP, or $INJ? 👇
Not financial advice.
#Bitcoin #Crypto #Solana #XRP
Crypto market update 📊
🔴 $SOL — $75.52, down 5.4%
Biggest fall in the top coins today, broke below $80.
🔴 $XRP — $0.99, down 4.1%
Lost the $1 level, down from $1.35 just 10 days ago.
🟢 $INJ — $8.03, up 11.22%
Top gainer on Binance today, while most of the market is down.
Bitcoin ETFs saw $185M outflows yesterday, and Fear & Greed is at 20 Extreme Fear.
Which one are you watching $SOL , $XRP , or $INJ ? 👇
Not financial advice.
#Bitcoin #Crypto #Solana #XRP
🔴 $SOL — $75.52, down 5.4%
Biggest fall in the top coins today, broke below $80.
🔴 $XRP — $0.99, down 4.1%
Lost the $1 level, down from $1.35 just 10 days ago.
🟢 $INJ — $8.03, up 11.22%
Top gainer on Binance today, while most of the market is down.
Bitcoin ETFs saw $185M outflows yesterday, and Fear & Greed is at 20 Extreme Fear.
Which one are you watching $SOL , $XRP , or $INJ ? 👇
Not financial advice.
#Bitcoin #Crypto #Solana #XRP
1
1
462

·
--
ဘာသာပြန်ဆိုချက် ကြည့်မည်
Tempestade Perfeita nos Mercados: Quem Vai Acender a Próxima Grande Alta de Cripto e Ações?Os mercados globais estão atravessando um verdadeiro teste de fogo. Nos últimos dias, o Bitcoin recuou para abaixo da faixa dos US$ 73 mil — perdendo sua média móvel de 200 dias — enquanto as ações de tecnologia em Wall Street sentem o peso da reavaliação dos valuations de Inteligência Artificial e da cautela macroeconômica.
A combinação recente de eventos não deixou espaço para complacência:
Inflação resistente e o fator Fed: O CPI americano de outubro subiu 0,4% (acima da projeção de 0,3%), reacendendo apostas de que o Federal Reserve pode voltar a subir os juros em dezembro.
Dólar forte e juros longos: Com os títulos do Tesouro dos EUA de 10 anos rompendo a barreira dos 5% e o índice do dólar (DXY) próximo das máximas de 19 meses, a liquidez global ficou mais cara para ativos de risco.
Limpeza de alavancagem: Ondas bilionárias de liquidações no mercado cripto e saídas recentes nos ETFs varreram o excesso de otimismo, deixando o sentimento em território de cautela extrema.
Mas a história dos ciclos financeiros ensina uma lição valiosa: as maiores retomadas nascem exatamente quando o consenso parece mais pessimista.
Liquidações limpam o excesso de alavancagem, mas não criam compradores por si sós. Para que o próximo rali aconteça de forma sustentável, um novo catalisador precisa assumir o volante. E hoje, os olhares estão divididos entre três frentes principais:
Alívio na Liquidez Macro: Uma surpresa favorável nos próximos dados de inflação ou emprego que esfrie os rendimentos dos Treasuries e enfraqueça o dólar, reabrindo o apetite institucional.A Retomada dos Balanços de IA e Tech: Se as gigantes de tecnologia provarem nos próximos resultados que os investimentos pesados em IA estão gerando lucro real, a Nasdaq pode puxar novamente a correlação positiva com os criptoativos.Fluxo Institucional e Escassez: A reentrada de capital via ETFs spot e compras corporativas aproveitando os descontos atuais após a capitulação dos mãos-fracas.
O palco está montado, os preços foram recalibrados e a liquidez está à espreita esperando o primeiro sinal verde.
Na sua visão, qual será o verdadeiro gatilho da próxima grande recuperação — uma mudança de tom do Federal Reserve, uma nova onda de lucros no setor de IA/Tech ou a entrada agressiva de capital institucional nos ETFs — e quem vai liderar essa arrancada primeiro: o Bitcoin ou as ações de Wall Street?
$BTC
#WhatWillDriveCryptoandStocks’NextRebound?
#Bitcoin
#CryptoMarket
#stockmarket
Tempestade Perfeita nos Mercados: Quem Vai Acender a Próxima Grande Alta de Cripto e Ações?
Os mercados globais estão atravessando um verdadeiro teste de fogo. Nos últimos dias, o Bitcoin recuou para abaixo da faixa dos US$ 73 mil — perdendo sua média móvel de 200 dias — enquanto as ações de tecnologia em Wall Street sentem o peso da reavaliação dos valuations de Inteligência Artificial e da cautela macroeconômica.
A combinação recente de eventos não deixou espaço para complacência:
Inflação resistente e o fator Fed: O CPI americano de outubro subiu 0,4% (acima da projeção de 0,3%), reacendendo apostas de que o Federal Reserve pode voltar a subir os juros em dezembro.
Dólar forte e juros longos: Com os títulos do Tesouro dos EUA de 10 anos rompendo a barreira dos 5% e o índice do dólar (DXY) próximo das máximas de 19 meses, a liquidez global ficou mais cara para ativos de risco.
Limpeza de alavancagem: Ondas bilionárias de liquidações no mercado cripto e saídas recentes nos ETFs varreram o excesso de otimismo, deixando o sentimento em território de cautela extrema.
Mas a história dos ciclos financeiros ensina uma lição valiosa: as maiores retomadas nascem exatamente quando o consenso parece mais pessimista.
Liquidações limpam o excesso de alavancagem, mas não criam compradores por si sós. Para que o próximo rali aconteça de forma sustentável, um novo catalisador precisa assumir o volante. E hoje, os olhares estão divididos entre três frentes principais:
Alívio na Liquidez Macro: Uma surpresa favorável nos próximos dados de inflação ou emprego que esfrie os rendimentos dos Treasuries e enfraqueça o dólar, reabrindo o apetite institucional.A Retomada dos Balanços de IA e Tech: Se as gigantes de tecnologia provarem nos próximos resultados que os investimentos pesados em IA estão gerando lucro real, a Nasdaq pode puxar novamente a correlação positiva com os criptoativos.Fluxo Institucional e Escassez: A reentrada de capital via ETFs spot e compras corporativas aproveitando os descontos atuais após a capitulação dos mãos-fracas.
O palco está montado, os preços foram recalibrados e a liquidez está à espreita esperando o primeiro sinal verde.
Na sua visão, qual será o verdadeiro gatilho da próxima grande recuperação — uma mudança de tom do Federal Reserve, uma nova onda de lucros no setor de IA/Tech ou a entrada agressiva de capital institucional nos ETFs — e quem vai liderar essa arrancada primeiro: o Bitcoin ou as ações de Wall Street?
$BTC
#WhatWillDriveCryptoandStocks’NextRebound?
#Bitcoin
#CryptoMarket
#stockmarket
A combinação recente de eventos não deixou espaço para complacência:
Inflação resistente e o fator Fed: O CPI americano de outubro subiu 0,4% (acima da projeção de 0,3%), reacendendo apostas de que o Federal Reserve pode voltar a subir os juros em dezembro.
Dólar forte e juros longos: Com os títulos do Tesouro dos EUA de 10 anos rompendo a barreira dos 5% e o índice do dólar (DXY) próximo das máximas de 19 meses, a liquidez global ficou mais cara para ativos de risco.
Limpeza de alavancagem: Ondas bilionárias de liquidações no mercado cripto e saídas recentes nos ETFs varreram o excesso de otimismo, deixando o sentimento em território de cautela extrema.
Mas a história dos ciclos financeiros ensina uma lição valiosa: as maiores retomadas nascem exatamente quando o consenso parece mais pessimista.
Liquidações limpam o excesso de alavancagem, mas não criam compradores por si sós. Para que o próximo rali aconteça de forma sustentável, um novo catalisador precisa assumir o volante. E hoje, os olhares estão divididos entre três frentes principais:
Alívio na Liquidez Macro: Uma surpresa favorável nos próximos dados de inflação ou emprego que esfrie os rendimentos dos Treasuries e enfraqueça o dólar, reabrindo o apetite institucional.A Retomada dos Balanços de IA e Tech: Se as gigantes de tecnologia provarem nos próximos resultados que os investimentos pesados em IA estão gerando lucro real, a Nasdaq pode puxar novamente a correlação positiva com os criptoativos.Fluxo Institucional e Escassez: A reentrada de capital via ETFs spot e compras corporativas aproveitando os descontos atuais após a capitulação dos mãos-fracas.
O palco está montado, os preços foram recalibrados e a liquidez está à espreita esperando o primeiro sinal verde.
Na sua visão, qual será o verdadeiro gatilho da próxima grande recuperação — uma mudança de tom do Federal Reserve, uma nova onda de lucros no setor de IA/Tech ou a entrada agressiva de capital institucional nos ETFs — e quem vai liderar essa arrancada primeiro: o Bitcoin ou as ações de Wall Street?
$BTC
#WhatWillDriveCryptoandStocks’NextRebound?
#Bitcoin
#CryptoMarket
#stockmarket
121

·
--
ကျရိပ်ရှိသည်
ကြားဖြတ်ရွေးကောက်ပွဲ ၃ ကြိမ်၊ Bitcoin အောက်ဆုံးဈေးကို ရှာတွေ့ခဲ့တာ ၃ ကြိမ်။ သမိုင်းက ထပ်မံဖြစ်ပေါ်မလား? 👀
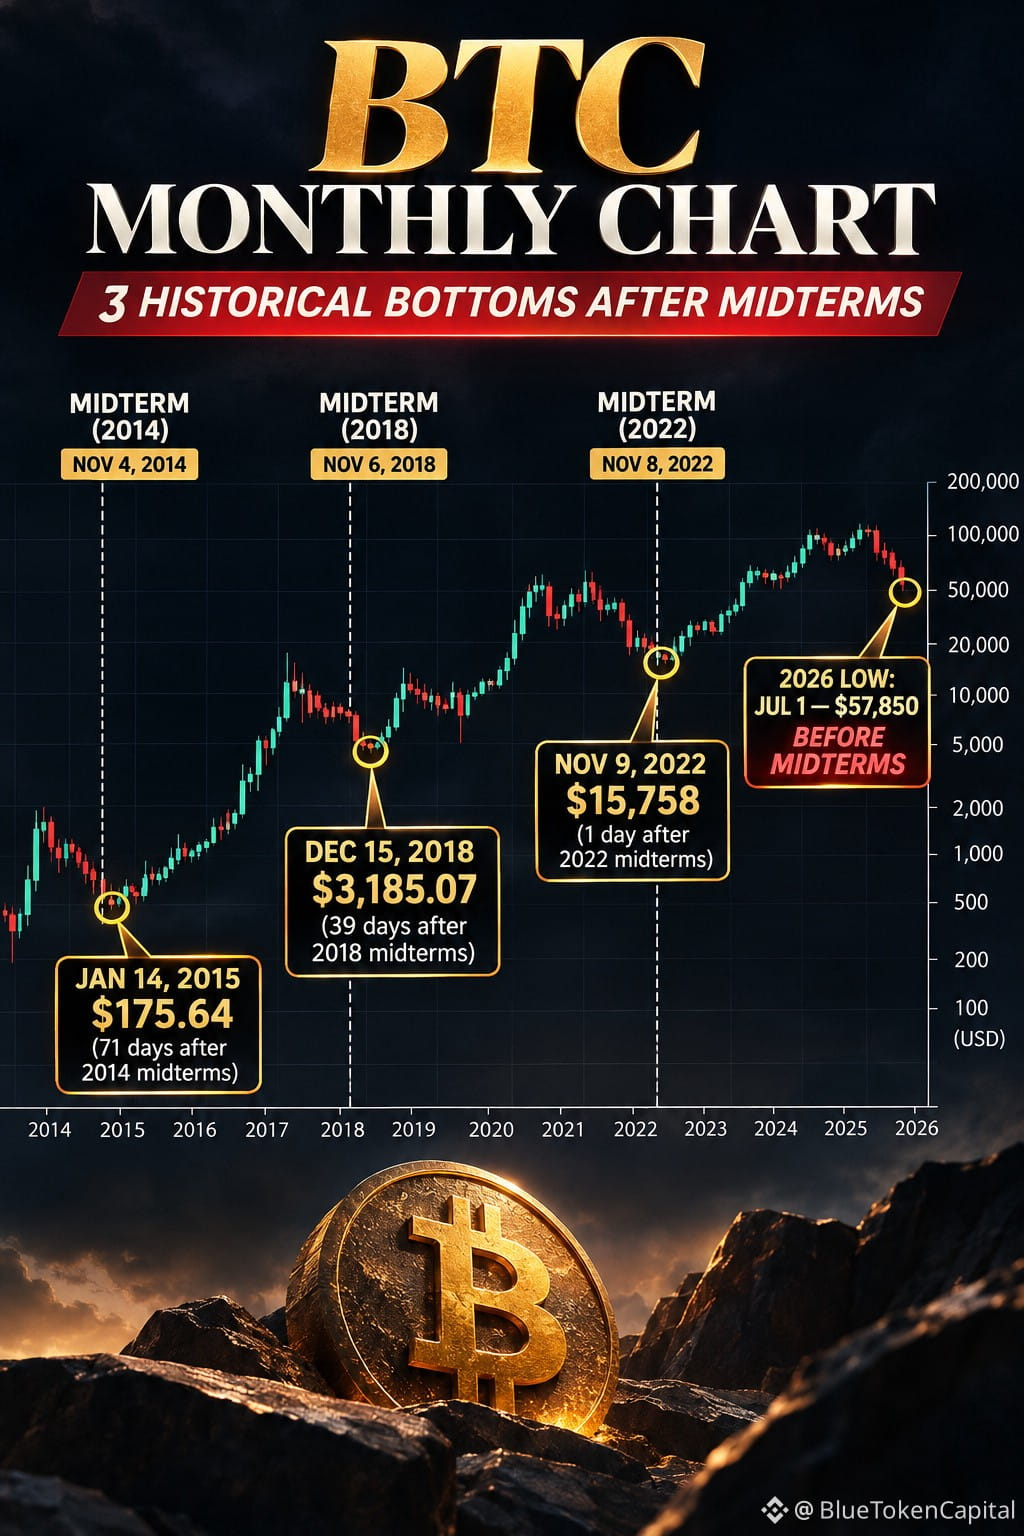
BTC လစဉ်ဇယားမှာ သတိပြုစရာကောင်းတဲ့ ကိန်းဂဏန်းတစ်ခုရှိပါတယ်။
🔻 2014: ရွေးကောက်ပွဲပြီး 71 ရက်အကြာမှာ BTC က $175.64 နဲ့ အောက်ဆုံးဈေးကို ရောက်ခဲ့ပါတယ်။
🔻 2018: ရွေးကောက်ပွဲပြီး 39 ရက်အကြာမှာ BTC က $3,185 နဲ့ အောက်ဆုံးဈေးကို ရောက်ခဲ့ပါတယ်။
🔻 2022: ရွေးကောက်ပွဲပြီး 1 ရက်အကြာမှာပဲ BTC ရဲ့ အပိတ်ဈေးက $15,758 နဲ့ အနိမ့်ဆုံးကို ရောက်ခဲ့ပါတယ်။
တူညီတဲ့အချက်ကတော့ သုံးကြိမ်စလုံး ဝက်ဝံဈေးကွက်ကာလအတွင်း ဖြစ်ပေါ်ခဲ့ပြီး နောက်ပိုင်းမှာ Bitcoin ဟာ ပြန်လည်နာလန်ထူတဲ့ စက်ဝန်းထဲကို ဝင်ရောက်ခဲ့တာပါ။
ဒါပေမဲ့ 2026 ခုနှစ်မှာတော့ ကွဲပြားတဲ့အချက်တစ်ခု ရှိနေပါတယ်။
လက်ရှိအထိ စက်ဝန်းရဲ့ အောက်ဆုံးဈေးဟာ နိုဝင်ဘာ ကြားဖြတ်ရွေးကောက်ပွဲမတိုင်ခင် ဇွန်လကုန်ပိုင်းကတည်းက ပေါ်လာခဲ့ပါတယ်။ သမိုင်းဝင်ပုံစံကို စမ်းသပ်ခံနေရပါပြီ။
ကျွန်တော့်အမြင်ကတော့—
ကြားဖြတ်ရွေးကောက်ပွဲဟာ စိတ်ပိုင်းဆိုင်ရာအရ အရေးပါတဲ့ မှတ်တိုင်တစ်ခု ဖြစ်နိုင်ပေမဲ့ အောက်ဆုံးဈေးကို တိုက်ရိုက်ဖြစ်ပေါ်စေတဲ့ အကြောင်းရင်းတော့ မဟုတ်ပါဘူး။
အောက်ဆုံးဈေးကို ဖမ်းဖို့ သမိုင်းကိုပဲ ကြည့်မနေပါနဲ့။ ငွေစီးဆင်းမှု၊ ဈေးကွက်ငွေဖြစ်လွယ်မှုနဲ့ ဈေးကွက်ဖွဲ့စည်းပုံကို ကြည့်ပါ။
2026 ခုနှစ်မှာ စည်းမျဉ်းဟောင်းကို ချိုးဖောက်မလား၊ ဒါမှမဟုတ် Bitcoin က စက်ဝန်းသစ်တစ်ခုအတွက် ပြင်ဆင်နေပြီလား?
#Bitcoin #BTC #Crypto #MarketCycle
ကြားဖြတ်ရွေးကောက်ပွဲ ၃ ကြိမ်၊ Bitcoin အောက်ဆုံးဈေးကို ရှာတွေ့ခဲ့တာ ၃ ကြိမ်။ သမိုင်းက ထပ်မံဖြစ်ပေါ်မလား? 👀
BTC လစဉ်ဇယားမှာ သတိပြုစရာကောင်းတဲ့ ကိန်းဂဏန်းတစ်ခုရှိပါတယ်။
🔻 2014: ရွေးကောက်ပွဲပြီး 71 ရက်အကြာမှာ BTC က $175.64 နဲ့ အောက်ဆုံးဈေးကို ရောက်ခဲ့ပါတယ်။
🔻 2018: ရွေးကောက်ပွဲပြီး 39 ရက်အကြာမှာ BTC က $3,185 နဲ့ အောက်ဆုံးဈေးကို ရောက်ခဲ့ပါတယ်။
🔻 2022: ရွေးကောက်ပွဲပြီး 1 ရက်အကြာမှာပဲ BTC ရဲ့ အပိတ်ဈေးက $15,758 နဲ့ အနိမ့်ဆုံးကို ရောက်ခဲ့ပါတယ်။
တူညီတဲ့အချက်ကတော့ သုံးကြိမ်စလုံး ဝက်ဝံဈေးကွက်ကာလအတွင်း ဖြစ်ပေါ်ခဲ့ပြီး နောက်ပိုင်းမှာ Bitcoin ဟာ ပြန်လည်နာလန်ထူတဲ့ စက်ဝန်းထဲကို ဝင်ရောက်ခဲ့တာပါ။
ဒါပေမဲ့ 2026 ခုနှစ်မှာတော့ ကွဲပြားတဲ့အချက်တစ်ခု ရှိနေပါတယ်။
လက်ရှိအထိ စက်ဝန်းရဲ့ အောက်ဆုံးဈေးဟာ နိုဝင်ဘာ ကြားဖြတ်ရွေးကောက်ပွဲမတိုင်ခင် ဇွန်လကုန်ပိုင်းကတည်းက ပေါ်လာခဲ့ပါတယ်။ သမိုင်းဝင်ပုံစံကို စမ်းသပ်ခံနေရပါပြီ။
ကျွန်တော့်အမြင်ကတော့—
ကြားဖြတ်ရွေးကောက်ပွဲဟာ စိတ်ပိုင်းဆိုင်ရာအရ အရေးပါတဲ့ မှတ်တိုင်တစ်ခု ဖြစ်နိုင်ပေမဲ့ အောက်ဆုံးဈေးကို တိုက်ရိုက်ဖြစ်ပေါ်စေတဲ့ အကြောင်းရင်းတော့ မဟုတ်ပါဘူး။
အောက်ဆုံးဈေးကို ဖမ်းဖို့ သမိုင်းကိုပဲ ကြည့်မနေပါနဲ့။ ငွေစီးဆင်းမှု၊ ဈေးကွက်ငွေဖြစ်လွယ်မှုနဲ့ ဈေးကွက်ဖွဲ့စည်းပုံကို ကြည့်ပါ။
2026 ခုနှစ်မှာ စည်းမျဉ်းဟောင်းကို ချိုးဖောက်မလား၊ ဒါမှမဟုတ် Bitcoin က စက်ဝန်းသစ်တစ်ခုအတွက် ပြင်ဆင်နေပြီလား?
#Bitcoin #BTC #Crypto #MarketCycle
BTC လစဉ်ဇယားမှာ သတိပြုစရာကောင်းတဲ့ ကိန်းဂဏန်းတစ်ခုရှိပါတယ်။
🔻 2014: ရွေးကောက်ပွဲပြီး 71 ရက်အကြာမှာ BTC က $175.64 နဲ့ အောက်ဆုံးဈေးကို ရောက်ခဲ့ပါတယ်။
🔻 2018: ရွေးကောက်ပွဲပြီး 39 ရက်အကြာမှာ BTC က $3,185 နဲ့ အောက်ဆုံးဈေးကို ရောက်ခဲ့ပါတယ်။
🔻 2022: ရွေးကောက်ပွဲပြီး 1 ရက်အကြာမှာပဲ BTC ရဲ့ အပိတ်ဈေးက $15,758 နဲ့ အနိမ့်ဆုံးကို ရောက်ခဲ့ပါတယ်။
တူညီတဲ့အချက်ကတော့ သုံးကြိမ်စလုံး ဝက်ဝံဈေးကွက်ကာလအတွင်း ဖြစ်ပေါ်ခဲ့ပြီး နောက်ပိုင်းမှာ Bitcoin ဟာ ပြန်လည်နာလန်ထူတဲ့ စက်ဝန်းထဲကို ဝင်ရောက်ခဲ့တာပါ။
ဒါပေမဲ့ 2026 ခုနှစ်မှာတော့ ကွဲပြားတဲ့အချက်တစ်ခု ရှိနေပါတယ်။
လက်ရှိအထိ စက်ဝန်းရဲ့ အောက်ဆုံးဈေးဟာ နိုဝင်ဘာ ကြားဖြတ်ရွေးကောက်ပွဲမတိုင်ခင် ဇွန်လကုန်ပိုင်းကတည်းက ပေါ်လာခဲ့ပါတယ်။ သမိုင်းဝင်ပုံစံကို စမ်းသပ်ခံနေရပါပြီ။
ကျွန်တော့်အမြင်ကတော့—
ကြားဖြတ်ရွေးကောက်ပွဲဟာ စိတ်ပိုင်းဆိုင်ရာအရ အရေးပါတဲ့ မှတ်တိုင်တစ်ခု ဖြစ်နိုင်ပေမဲ့ အောက်ဆုံးဈေးကို တိုက်ရိုက်ဖြစ်ပေါ်စေတဲ့ အကြောင်းရင်းတော့ မဟုတ်ပါဘူး။
အောက်ဆုံးဈေးကို ဖမ်းဖို့ သမိုင်းကိုပဲ ကြည့်မနေပါနဲ့။ ငွေစီးဆင်းမှု၊ ဈေးကွက်ငွေဖြစ်လွယ်မှုနဲ့ ဈေးကွက်ဖွဲ့စည်းပုံကို ကြည့်ပါ။
2026 ခုနှစ်မှာ စည်းမျဉ်းဟောင်းကို ချိုးဖောက်မလား၊ ဒါမှမဟုတ် Bitcoin က စက်ဝန်းသစ်တစ်ခုအတွက် ပြင်ဆင်နေပြီလား?
#Bitcoin #BTC #Crypto #MarketCycle
2
400

·
--
🚨 ၂၄ နာရီအတွင်း ဒေါ်လာ ၁.၂၉ ဘီလီယံဖိုး ဖျက်သိမ်းခံရ — Long position တွေ အပြင်းအထန် ဖိအားပေးခံရ
Bitcoin ဟာ ဒေါ်လာ ၆၈,၀၀၀ အောက်ကို ထပ်မံကျဆင်းသွားပြီး ခဏတာ ဒေါ်လာ ၆၇,၈၆၅ အထိ ရောက်ရှိခဲ့ပါတယ်။ တစ်ရက်တည်းမှာ ကုန်သည် ၁၆၄,၁၄၅ ဦး အရှုံးနဲ့ ရှင်းထုတ်ခံခဲ့ရပါတယ်။ 👀
ဖျက်သိမ်းခံရတဲ့ စုစုပေါင်း ဒေါ်လာ ၁.၂၉ ဘီလီယံထဲက ဒေါ်လာ ၁.၀၈ ဘီလီယံဟာ Long position တွေက ဖြစ်ပြီး၊ တစ်ခုတည်းအတွက် အများဆုံးဆုံးရှုံးမှုက Hyperliquid ပေါ်က BTC position ဒေါ်လာ ၂၀.၁၅ သန်း ဖြစ်ပါတယ်။ BTC ဟာ ၂၄ နာရီအတွင်း ~၄% ကျဆင်းပြီး ဒေါ်လာ ၆၈,၃၀၀ ဝန်းကျင်မှာ ရုန်းကန်နေရသလို ETH ကတော့ ဒေါ်လာ ၁,၉၃၂ ဝန်းကျင်မှာ ရှိနေပါတယ်။
ဒါက ပြန်တက်မလာခင် Long position တွေ နောက်ဆုံးအကြိမ် အရှင်းခံရတာလား — ဒါမှမဟုတ် နောက်ထပ် နာကျင်မှုတွေ လာဦးမှာလား။ 👇
#Bitcoin #BTC #Crypto
🚨 ၂၄ နာရီအတွင်း ဒေါ်လာ ၁.၂၉ ဘီလီယံဖိုး ဖျက်သိမ်းခံရ — Long position တွေ အပြင်းအထန် ဖိအားပေးခံရ
Bitcoin ဟာ ဒေါ်လာ ၆၈,၀၀၀ အောက်ကို ထပ်မံကျဆင်းသွားပြီး ခဏတာ ဒေါ်လာ ၆၇,၈၆၅ အထိ ရောက်ရှိခဲ့ပါတယ်။ တစ်ရက်တည်းမှာ ကုန်သည် ၁၆၄,၁၄၅ ဦး အရှုံးနဲ့ ရှင်းထုတ်ခံခဲ့ရပါတယ်။ 👀
ဖျက်သိမ်းခံရတဲ့ စုစုပေါင်း ဒေါ်လာ ၁.၂၉ ဘီလီယံထဲက ဒေါ်လာ ၁.၀၈ ဘီလီယံဟာ Long position တွေက ဖြစ်ပြီး၊ တစ်ခုတည်းအတွက် အများဆုံးဆုံးရှုံးမှုက Hyperliquid ပေါ်က BTC position ဒေါ်လာ ၂၀.၁၅ သန်း ဖြစ်ပါတယ်။ BTC ဟာ ၂၄ နာရီအတွင်း ~၄% ကျဆင်းပြီး ဒေါ်လာ ၆၈,၃၀၀ ဝန်းကျင်မှာ ရုန်းကန်နေရသလို ETH ကတော့ ဒေါ်လာ ၁,၉၃၂ ဝန်းကျင်မှာ ရှိနေပါတယ်။
ဒါက ပြန်တက်မလာခင် Long position တွေ နောက်ဆုံးအကြိမ် အရှင်းခံရတာလား — ဒါမှမဟုတ် နောက်ထပ် နာကျင်မှုတွေ လာဦးမှာလား။ 👇
#Bitcoin #BTC #Crypto
Bitcoin ဟာ ဒေါ်လာ ၆၈,၀၀၀ အောက်ကို ထပ်မံကျဆင်းသွားပြီး ခဏတာ ဒေါ်လာ ၆၇,၈၆၅ အထိ ရောက်ရှိခဲ့ပါတယ်။ တစ်ရက်တည်းမှာ ကုန်သည် ၁၆၄,၁၄၅ ဦး အရှုံးနဲ့ ရှင်းထုတ်ခံခဲ့ရပါတယ်။ 👀
ဖျက်သိမ်းခံရတဲ့ စုစုပေါင်း ဒေါ်လာ ၁.၂၉ ဘီလီယံထဲက ဒေါ်လာ ၁.၀၈ ဘီလီယံဟာ Long position တွေက ဖြစ်ပြီး၊ တစ်ခုတည်းအတွက် အများဆုံးဆုံးရှုံးမှုက Hyperliquid ပေါ်က BTC position ဒေါ်လာ ၂၀.၁၅ သန်း ဖြစ်ပါတယ်။ BTC ဟာ ၂၄ နာရီအတွင်း ~၄% ကျဆင်းပြီး ဒေါ်လာ ၆၈,၃၀၀ ဝန်းကျင်မှာ ရုန်းကန်နေရသလို ETH ကတော့ ဒေါ်လာ ၁,၉၃၂ ဝန်းကျင်မှာ ရှိနေပါတယ်။
ဒါက ပြန်တက်မလာခင် Long position တွေ နောက်ဆုံးအကြိမ် အရှင်းခံရတာလား — ဒါမှမဟုတ် နောက်ထပ် နာကျင်မှုတွေ လာဦးမှာလား။ 👇
#Bitcoin #BTC #Crypto
135
ဘာသာပြန်ဆိုချက် ကြည့်မည်
🚨 Bitcoin NUNCA había cerrado dos años seguidos en rojo… y en 2026 está a punto de pasar 👀
Pierde más del 21% en el año, y 2025 ya cerró en -6,3%.
▪️ Bitcoin (~68.400): para terminar 2026 en verde tendría que pasar de 87.500 antes del 31 de diciembre, casi +28%. Este trimestre ya es el segundo peor de su historia. El motivo: el mercado da 88% de probabilidad a que la Fed suba las tasas de interés en diciembre, el dólar está en su punto más fuerte desde abril de 2025 y el dinero huye del riesgo. Ojo: ahora los que apuestan a la baja le están pagando a los que apuestan al alza, algo que a veces aparece cerca de un piso.
▪️ Ethereum (~1.930): tocó ~1.900. Una billetera ligada a la Fundación Ethereum vendió 4.000 ETH en 3 días, y una empresa de la bolsa Nasdaq tuvo que vender ETH con pérdida para cuidar un préstamo. Si ETH baja cerca de 1.717, ese préstamo podría liquidarse: es la zona a vigilar.
▪️ AVAX (~8,24): defendió los 8,00. Su red lleva 230 días seguidos con más de 100.000 transacciones diarias, y una empresa de Nasdaq dejó otros negocios para dedicarse solo a guardar AVAX: tiene más de 14 millones.
El miedo está en 13 de 100, de lo más bajo del año.
¿Este es el piso o falta más caída? 👇
#Bitcoin #ETH #AVAX
🚨 Bitcoin NUNCA había cerrado dos años seguidos en rojo… y en 2026 está a punto de pasar 👀
Pierde más del 21% en el año, y 2025 ya cerró en -6,3%.
▪️ Bitcoin (~68.400): para terminar 2026 en verde tendría que pasar de 87.500 antes del 31 de diciembre, casi +28%. Este trimestre ya es el segundo peor de su historia. El motivo: el mercado da 88% de probabilidad a que la Fed suba las tasas de interés en diciembre, el dólar está en su punto más fuerte desde abril de 2025 y el dinero huye del riesgo. Ojo: ahora los que apuestan a la baja le están pagando a los que apuestan al alza, algo que a veces aparece cerca de un piso.
▪️ Ethereum (~1.930): tocó ~1.900. Una billetera ligada a la Fundación Ethereum vendió 4.000 ETH en 3 días, y una empresa de la bolsa Nasdaq tuvo que vender ETH con pérdida para cuidar un préstamo. Si ETH baja cerca de 1.717, ese préstamo podría liquidarse: es la zona a vigilar.
▪️ AVAX (~8,24): defendió los 8,00. Su red lleva 230 días seguidos con más de 100.000 transacciones diarias, y una empresa de Nasdaq dejó otros negocios para dedicarse solo a guardar AVAX: tiene más de 14 millones.
El miedo está en 13 de 100, de lo más bajo del año.
¿Este es el piso o falta más caída? 👇
#Bitcoin #ETH #AVAX
Pierde más del 21% en el año, y 2025 ya cerró en -6,3%.
▪️ Bitcoin (~68.400): para terminar 2026 en verde tendría que pasar de 87.500 antes del 31 de diciembre, casi +28%. Este trimestre ya es el segundo peor de su historia. El motivo: el mercado da 88% de probabilidad a que la Fed suba las tasas de interés en diciembre, el dólar está en su punto más fuerte desde abril de 2025 y el dinero huye del riesgo. Ojo: ahora los que apuestan a la baja le están pagando a los que apuestan al alza, algo que a veces aparece cerca de un piso.
▪️ Ethereum (~1.930): tocó ~1.900. Una billetera ligada a la Fundación Ethereum vendió 4.000 ETH en 3 días, y una empresa de la bolsa Nasdaq tuvo que vender ETH con pérdida para cuidar un préstamo. Si ETH baja cerca de 1.717, ese préstamo podría liquidarse: es la zona a vigilar.
▪️ AVAX (~8,24): defendió los 8,00. Su red lleva 230 días seguidos con más de 100.000 transacciones diarias, y una empresa de Nasdaq dejó otros negocios para dedicarse solo a guardar AVAX: tiene más de 14 millones.
El miedo está en 13 de 100, de lo más bajo del año.
¿Este es el piso o falta más caída? 👇
#Bitcoin #ETH #AVAX

548

ဘာသာပြန်ဆိုချက် ကြည့်မည်
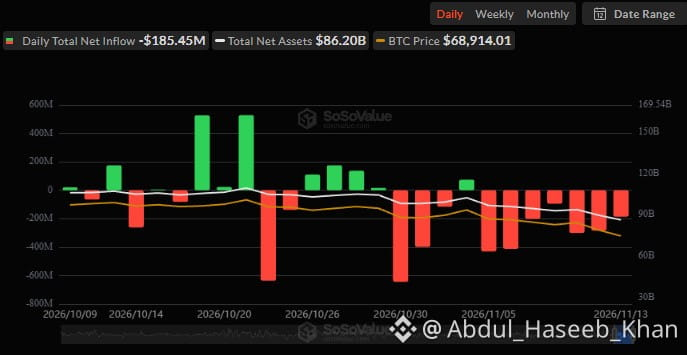
BITCOIN ($BTC ) ETFs SEE $1.07 BILLION IN OUTFLOWS!
US Spot Bitcoin ETFs have recorded outflows every trading day this week, with a massive $1.07 billion leaving the funds.
📉 Is institutional demand for Bitcoin weakening?
What do you think? Bullish or bearish? 👇
{spot}(BTCUSDT)
#Bitcoin #BTC #CryptoNews #BinanceSquare
BITCOIN ($BTC ) ETFs SEE $1.07 BILLION IN OUTFLOWS!
US Spot Bitcoin ETFs have recorded outflows every trading day this week, with a massive $1.07 billion leaving the funds.
📉 Is institutional demand for Bitcoin weakening?
What do you think? Bullish or bearish? 👇
#Bitcoin #BTC #CryptoNews #BinanceSquare
US Spot Bitcoin ETFs have recorded outflows every trading day this week, with a massive $1.07 billion leaving the funds.
📉 Is institutional demand for Bitcoin weakening?
What do you think? Bullish or bearish? 👇
#Bitcoin #BTC #CryptoNews #BinanceSquare
1
48

·
--
ကျရိပ်ရှိသည်
🚨 BITCOIN ဟာ ရောင်းအားဖိအား ဆက်လက်ရှိနေသဖြင့် $70K အောက်တွင် ရုန်းကန်နေရသည်!
US PPI အချက်အလက်သည် မျှော်မှန်းချက်ထက် အနည်းငယ်နိမ့်ကျခဲ့သော်လည်း Bitcoin သည် အကျဘက်သို့ ပြင်းထန်သော ဖိအားကို ရင်ဆိုင်နေရဆဲဖြစ်သည်။
US ထုတ်လုပ်သူဈေးနှုန်းညွှန်းကိန်း (PPI) သည် တစ်နှစ်ထက်တစ်နှစ် 6.5% ရှိခဲ့ပြီး ခန့်မှန်းထားသည့် 6.6% ထက် နိမ့်ခဲ့သည်။ ကိန်းဂဏန်းမှာ အနည်းငယ်နိမ့်ကျခဲ့သော်လည်း 2022 ခုနှစ်နောက်ပိုင်း အမြင့်ဆုံး နှစ်စဉ်အဆင့်တွင် ရှိနေဆဲဖြစ်သည်။
အစီရင်ခံစာထွက်လာပြီးနောက် BTC သည် $70,000 အနီးသို့ ခဏတာ ပြန်တက်ခဲ့သော်လည်း ဝယ်ယူသူများက အရှိန်ကို ထိန်းထားနိုင်ခြင်းမရှိခဲ့ပါ။ ဈေးနှုန်းသည် လျင်မြန်စွာ ပြန်ကျသွားခဲ့ရာ ဈေးကွက်ယုံကြည်မှု အားနည်းနေဆဲဖြစ်ကြောင်း ပြသနေသည်။
🔍 ဈေးနှုန်းကျဆင်းမှုကို ဘာတွေက တွန်းအားပေးနေသလဲ?
Fed အပေါ် စိုးရိမ်မှုများ: ဒီဇင်ဘာလတွင် အတိုးနှုန်းမြှင့်တင်နိုင်ခြေ မြင့်မားနေသည်ဟု ဈေးကွက်များက ဆက်လက်တွက်ဆနေကြသည်။
US ဒေါ်လာ အားကောင်းမှု: ဒေါ်လာ၏ ဆက်လက်အားကောင်းနေမှုသည် အန္တရာယ်ရှိသော ပိုင်ဆိုင်မှုများအပေါ် ဖိအားဖြစ်စေသည်။
ETF မှ ငွေထွက်မှုများ: အဖွဲ့အစည်းဆိုင်ရာ ရင်းနှီးမြှုပ်နှံမှုစီးဆင်းမှုများသည် Bitcoin အတွက် စိုးရိမ်စရာဖြစ်နေဆဲဖြစ်သည်။
အကြီးအကျယ် အတင်းအကျပ် ဖျက်သိမ်းမှုများ: ဒေါ်လာ 1.4 ဘီလီယံကျော်တန်ဖိုးရှိ အတင်းအကျပ် ဖျက်သိမ်းမှုများက ရောင်းအားဖိအားကို ပိုမိုမြင့်တက်စေခဲ့သည်။
📉 BTC ဈေးနှုန်းအလားအလာ
အရေးကြီးသည့် $70K အဆင့်ကို ကျော်လွန်ကျဆင်းခဲ့ပြီးနောက် Bitcoin သည် $67,350 ဝန်းကျင်တွင် အရောင်းအဝယ်ဖြစ်နေသည်။ ဝယ်ယူသူများက အရေးကြီးသော ခုခံမှုအဆင့်ကို ပြန်လည်ရယူနိုင်ခြင်းမရှိပါက ကာလတိုဈေးကွက်ဖွဲ့စည်းပုံသည် အကျဘက်သို့ ဦးတည်နေဆဲဖြစ်သည်။
🎯 အရောင်းအဝယ်အစီအစဉ် – အကျဘက်အခြေအနေ
ဝင်ရောက်ရန်အပိုင်းအခြား: $67,800–$68,400
ပစ်မှတ် 1: $66,900
ပစ်မှတ် 2: $65,500
ပစ်မှတ် 3: $64,000
Stop Loss: $69,200 အထက်
အတည်ပြုချက်: BTC သည် $68,500 ကို ခိုင်ခိုင်မာမာ ပြန်လည်ရယူရန် မအောင်မြင်မှသာ ဤ short အရောင်းအဝယ်အစီအစဉ်သည် စိတ်ဝင်စားဖွယ်ဖြစ်လာမည်။ မတည်ငြိမ်မှု မြင့်မားနေဆဲဖြစ်သည့်အတွက် ရင်းနှီးမြှုပ်နှံမှုပမာဏကို သေးငယ်စွာသာ ထားသင့်သည်။
💡 ကျွန်ုပ်၏အမြင်
Bitcoin သည် လက်ရှိအားနည်းမှုကို ပြောင်းပြန်လှန်ရန် ပိုမိုအားကောင်းသော ဝယ်လိုအားဖိအား လိုအပ်သည်။ အရေးကြီးသော ခုခံမှုအဆင့်များကို ပြန်လည်ကျော်လွန်နိုင်သည်အထိ ရောင်းသူများက ကာလတိုလမ်းကြောင်းကို ဆက်လက်ထိန်းချုပ်ထားနိုင်သည်။
ဤအဆင့်များသည် အရောင်းအဝယ်ဖြစ်နိုင်ခြေကို ဖော်ပြခြင်းသာဖြစ်ပြီး ဈေးနှုန်းပစ်မှတ်များကို အာမခံခြင်းမဟုတ်ပါ။
ဘဏ္ဍာရေးဆိုင်ရာ အကြံဉာဏ်မဟုတ်ပါ။ ကိုယ်တိုင်သုတေသနပြုပြီး အန္တရာယ်ကို သေချာစွာ စီမံခန့်ခွဲပါ။
$BTC #Bitcoin #CryptoMarket #USPPIMissMayEaseBTCPressure
🚨 BITCOIN ဟာ ရောင်းအားဖိအား ဆက်လက်ရှိနေသဖြင့် $70K အောက်တွင် ရုန်းကန်နေရသည်!
US PPI အချက်အလက်သည် မျှော်မှန်းချက်ထက် အနည်းငယ်နိမ့်ကျခဲ့သော်လည်း Bitcoin သည် အကျဘက်သို့ ပြင်းထန်သော ဖိအားကို ရင်ဆိုင်နေရဆဲဖြစ်သည်။
US ထုတ်လုပ်သူဈေးနှုန်းညွှန်းကိန်း (PPI) သည် တစ်နှစ်ထက်တစ်နှစ် 6.5% ရှိခဲ့ပြီး ခန့်မှန်းထားသည့် 6.6% ထက် နိမ့်ခဲ့သည်။ ကိန်းဂဏန်းမှာ အနည်းငယ်နိမ့်ကျခဲ့သော်လည်း 2022 ခုနှစ်နောက်ပိုင်း အမြင့်ဆုံး နှစ်စဉ်အဆင့်တွင် ရှိနေဆဲဖြစ်သည်။
အစီရင်ခံစာထွက်လာပြီးနောက် BTC သည် $70,000 အနီးသို့ ခဏတာ ပြန်တက်ခဲ့သော်လည်း ဝယ်ယူသူများက အရှိန်ကို ထိန်းထားနိုင်ခြင်းမရှိခဲ့ပါ။ ဈေးနှုန်းသည် လျင်မြန်စွာ ပြန်ကျသွားခဲ့ရာ ဈေးကွက်ယုံကြည်မှု အားနည်းနေဆဲဖြစ်ကြောင်း ပြသနေသည်။
🔍 ဈေးနှုန်းကျဆင်းမှုကို ဘာတွေက တွန်းအားပေးနေသလဲ?
Fed အပေါ် စိုးရိမ်မှုများ: ဒီဇင်ဘာလတွင် အတိုးနှုန်းမြှင့်တင်နိုင်ခြေ မြင့်မားနေသည်ဟု ဈေးကွက်များက ဆက်လက်တွက်ဆနေကြသည်။
US ဒေါ်လာ အားကောင်းမှု: ဒေါ်လာ၏ ဆက်လက်အားကောင်းနေမှုသည် အန္တရာယ်ရှိသော ပိုင်ဆိုင်မှုများအပေါ် ဖိအားဖြစ်စေသည်။
ETF မှ ငွေထွက်မှုများ: အဖွဲ့အစည်းဆိုင်ရာ ရင်းနှီးမြှုပ်နှံမှုစီးဆင်းမှုများသည် Bitcoin အတွက် စိုးရိမ်စရာဖြစ်နေဆဲဖြစ်သည်။
အကြီးအကျယ် အတင်းအကျပ် ဖျက်သိမ်းမှုများ: ဒေါ်လာ 1.4 ဘီလီယံကျော်တန်ဖိုးရှိ အတင်းအကျပ် ဖျက်သိမ်းမှုများက ရောင်းအားဖိအားကို ပိုမိုမြင့်တက်စေခဲ့သည်။
📉 BTC ဈေးနှုန်းအလားအလာ
အရေးကြီးသည့် $70K အဆင့်ကို ကျော်လွန်ကျဆင်းခဲ့ပြီးနောက် Bitcoin သည် $67,350 ဝန်းကျင်တွင် အရောင်းအဝယ်ဖြစ်နေသည်။ ဝယ်ယူသူများက အရေးကြီးသော ခုခံမှုအဆင့်ကို ပြန်လည်ရယူနိုင်ခြင်းမရှိပါက ကာလတိုဈေးကွက်ဖွဲ့စည်းပုံသည် အကျဘက်သို့ ဦးတည်နေဆဲဖြစ်သည်။
🎯 အရောင်းအဝယ်အစီအစဉ် – အကျဘက်အခြေအနေ
ဝင်ရောက်ရန်အပိုင်းအခြား: $67,800–$68,400
ပစ်မှတ် 1: $66,900
ပစ်မှတ် 2: $65,500
ပစ်မှတ် 3: $64,000
Stop Loss: $69,200 အထက်
အတည်ပြုချက်: BTC သည် $68,500 ကို ခိုင်ခိုင်မာမာ ပြန်လည်ရယူရန် မအောင်မြင်မှသာ ဤ short အရောင်းအဝယ်အစီအစဉ်သည် စိတ်ဝင်စားဖွယ်ဖြစ်လာမည်။ မတည်ငြိမ်မှု မြင့်မားနေဆဲဖြစ်သည့်အတွက် ရင်းနှီးမြှုပ်နှံမှုပမာဏကို သေးငယ်စွာသာ ထားသင့်သည်။
💡 ကျွန်ုပ်၏အမြင်
Bitcoin သည် လက်ရှိအားနည်းမှုကို ပြောင်းပြန်လှန်ရန် ပိုမိုအားကောင်းသော ဝယ်လိုအားဖိအား လိုအပ်သည်။ အရေးကြီးသော ခုခံမှုအဆင့်များကို ပြန်လည်ကျော်လွန်နိုင်သည်အထိ ရောင်းသူများက ကာလတိုလမ်းကြောင်းကို ဆက်လက်ထိန်းချုပ်ထားနိုင်သည်။
ဤအဆင့်များသည် အရောင်းအဝယ်ဖြစ်နိုင်ခြေကို ဖော်ပြခြင်းသာဖြစ်ပြီး ဈေးနှုန်းပစ်မှတ်များကို အာမခံခြင်းမဟုတ်ပါ။
ဘဏ္ဍာရေးဆိုင်ရာ အကြံဉာဏ်မဟုတ်ပါ။ ကိုယ်တိုင်သုတေသနပြုပြီး အန္တရာယ်ကို သေချာစွာ စီမံခန့်ခွဲပါ။
$BTC #Bitcoin #CryptoMarket #USPPIMissMayEaseBTCPressure
US PPI အချက်အလက်သည် မျှော်မှန်းချက်ထက် အနည်းငယ်နိမ့်ကျခဲ့သော်လည်း Bitcoin သည် အကျဘက်သို့ ပြင်းထန်သော ဖိအားကို ရင်ဆိုင်နေရဆဲဖြစ်သည်။
US ထုတ်လုပ်သူဈေးနှုန်းညွှန်းကိန်း (PPI) သည် တစ်နှစ်ထက်တစ်နှစ် 6.5% ရှိခဲ့ပြီး ခန့်မှန်းထားသည့် 6.6% ထက် နိမ့်ခဲ့သည်။ ကိန်းဂဏန်းမှာ အနည်းငယ်နိမ့်ကျခဲ့သော်လည်း 2022 ခုနှစ်နောက်ပိုင်း အမြင့်ဆုံး နှစ်စဉ်အဆင့်တွင် ရှိနေဆဲဖြစ်သည်။
အစီရင်ခံစာထွက်လာပြီးနောက် BTC သည် $70,000 အနီးသို့ ခဏတာ ပြန်တက်ခဲ့သော်လည်း ဝယ်ယူသူများက အရှိန်ကို ထိန်းထားနိုင်ခြင်းမရှိခဲ့ပါ။ ဈေးနှုန်းသည် လျင်မြန်စွာ ပြန်ကျသွားခဲ့ရာ ဈေးကွက်ယုံကြည်မှု အားနည်းနေဆဲဖြစ်ကြောင်း ပြသနေသည်။
🔍 ဈေးနှုန်းကျဆင်းမှုကို ဘာတွေက တွန်းအားပေးနေသလဲ?
Fed အပေါ် စိုးရိမ်မှုများ: ဒီဇင်ဘာလတွင် အတိုးနှုန်းမြှင့်တင်နိုင်ခြေ မြင့်မားနေသည်ဟု ဈေးကွက်များက ဆက်လက်တွက်ဆနေကြသည်။
US ဒေါ်လာ အားကောင်းမှု: ဒေါ်လာ၏ ဆက်လက်အားကောင်းနေမှုသည် အန္တရာယ်ရှိသော ပိုင်ဆိုင်မှုများအပေါ် ဖိအားဖြစ်စေသည်။
ETF မှ ငွေထွက်မှုများ: အဖွဲ့အစည်းဆိုင်ရာ ရင်းနှီးမြှုပ်နှံမှုစီးဆင်းမှုများသည် Bitcoin အတွက် စိုးရိမ်စရာဖြစ်နေဆဲဖြစ်သည်။
အကြီးအကျယ် အတင်းအကျပ် ဖျက်သိမ်းမှုများ: ဒေါ်လာ 1.4 ဘီလီယံကျော်တန်ဖိုးရှိ အတင်းအကျပ် ဖျက်သိမ်းမှုများက ရောင်းအားဖိအားကို ပိုမိုမြင့်တက်စေခဲ့သည်။
📉 BTC ဈေးနှုန်းအလားအလာ
အရေးကြီးသည့် $70K အဆင့်ကို ကျော်လွန်ကျဆင်းခဲ့ပြီးနောက် Bitcoin သည် $67,350 ဝန်းကျင်တွင် အရောင်းအဝယ်ဖြစ်နေသည်။ ဝယ်ယူသူများက အရေးကြီးသော ခုခံမှုအဆင့်ကို ပြန်လည်ရယူနိုင်ခြင်းမရှိပါက ကာလတိုဈေးကွက်ဖွဲ့စည်းပုံသည် အကျဘက်သို့ ဦးတည်နေဆဲဖြစ်သည်။
🎯 အရောင်းအဝယ်အစီအစဉ် – အကျဘက်အခြေအနေ
ဝင်ရောက်ရန်အပိုင်းအခြား: $67,800–$68,400
ပစ်မှတ် 1: $66,900
ပစ်မှတ် 2: $65,500
ပစ်မှတ် 3: $64,000
Stop Loss: $69,200 အထက်
အတည်ပြုချက်: BTC သည် $68,500 ကို ခိုင်ခိုင်မာမာ ပြန်လည်ရယူရန် မအောင်မြင်မှသာ ဤ short အရောင်းအဝယ်အစီအစဉ်သည် စိတ်ဝင်စားဖွယ်ဖြစ်လာမည်။ မတည်ငြိမ်မှု မြင့်မားနေဆဲဖြစ်သည့်အတွက် ရင်းနှီးမြှုပ်နှံမှုပမာဏကို သေးငယ်စွာသာ ထားသင့်သည်။
💡 ကျွန်ုပ်၏အမြင်
Bitcoin သည် လက်ရှိအားနည်းမှုကို ပြောင်းပြန်လှန်ရန် ပိုမိုအားကောင်းသော ဝယ်လိုအားဖိအား လိုအပ်သည်။ အရေးကြီးသော ခုခံမှုအဆင့်များကို ပြန်လည်ကျော်လွန်နိုင်သည်အထိ ရောင်းသူများက ကာလတိုလမ်းကြောင်းကို ဆက်လက်ထိန်းချုပ်ထားနိုင်သည်။
ဤအဆင့်များသည် အရောင်းအဝယ်ဖြစ်နိုင်ခြေကို ဖော်ပြခြင်းသာဖြစ်ပြီး ဈေးနှုန်းပစ်မှတ်များကို အာမခံခြင်းမဟုတ်ပါ။
ဘဏ္ဍာရေးဆိုင်ရာ အကြံဉာဏ်မဟုတ်ပါ။ ကိုယ်တိုင်သုတေသနပြုပြီး အန္တရာယ်ကို သေချာစွာ စီမံခန့်ခွဲပါ။
$BTC #Bitcoin #CryptoMarket #USPPIMissMayEaseBTCPressure
2
181

·
--
ဘာသာပြန်ဆိုချက် ကြည့်မည်
$BTC broke $67,568 — 3-month low, lowest since 19 August
Sequel to this morning's close-verdict post (05:43 PKT): the level that post flagged as must-hold just broke. Bitcoin closed Friday at $68,314, held $68,000 into the close — then kept falling through the night.
Snapshot — live 09:00 PKT, Binance: $66,966, -2.8% in 24h. Range $66,614-$70,214. 24h volume 26,273 BTC ($1.80B). RSI 14 at 27.3 (oversold). Fear & Greed 13, Extreme Fear.
What happened: no single new headline — the same three drivers from Friday kept working. Hot October CPI (+0.4% vs +0.3% expected) repriced Fed expectations; US spot BTC ETFs have now lost over $2.5B since 30 Oct (BigGo Finance); Nvidia's resignation shock kept tech in risk-off. CoinGlass: about $1.3B in liquidations in 24h, mostly longs. BTC is now -9.9% in 7 days, -16.4% in 30 days, and about 47% below its ~$126,000 October 2025 high.
Why $67,568 mattered: it was Friday's low and the line the morning post said must hold. The break is intraday so far — a daily close below it confirms the breakdown. Next clear level is $65,000. Mining difficulty retarget lands today (estimate about -9% this morning; landed figure not yet confirmed).
Expectations — Deribit options, 20 Nov expiry (6 days), spot $66,855, not a guarantee: above $70,000 by expiry 20%, below $65,000 28%, between the two 52%. A 4% move either way: up 29%, down 20%. Above the SMA200 ($73,092) only about 5%. ATM straddle $3,074 (4.6% of spot) — the market prices a move of about that size by expiry. Base-rate cross-check (from the morning post, closes down 4% or more, N=3): 0 up first, 2 down first, 1 flat — weak evidence, same direction.
Plan: do not chase, do not catch the knife blind. Long only on a daily close back above $70,000, stop below $67,568; targets $71,460 then $73,092. A daily close below $65,000 opens $64,181 (-4% level) then $60,000. Tiny size, spot only, no leverage. Confidence: Low.
$BTC #Bitcoin #BTC #Crypto
$BTC broke $67,568 — 3-month low, lowest since 19 August
Sequel to this morning's close-verdict post (05:43 PKT): the level that post flagged as must-hold just broke. Bitcoin closed Friday at $68,314, held $68,000 into the close — then kept falling through the night.
Snapshot — live 09:00 PKT, Binance: $66,966, -2.8% in 24h. Range $66,614-$70,214. 24h volume 26,273 BTC ($1.80B). RSI 14 at 27.3 (oversold). Fear & Greed 13, Extreme Fear.
What happened: no single new headline — the same three drivers from Friday kept working. Hot October CPI (+0.4% vs +0.3% expected) repriced Fed expectations; US spot BTC ETFs have now lost over $2.5B since 30 Oct (BigGo Finance); Nvidia's resignation shock kept tech in risk-off. CoinGlass: about $1.3B in liquidations in 24h, mostly longs. BTC is now -9.9% in 7 days, -16.4% in 30 days, and about 47% below its ~$126,000 October 2025 high.
Why $67,568 mattered: it was Friday's low and the line the morning post said must hold. The break is intraday so far — a daily close below it confirms the breakdown. Next clear level is $65,000. Mining difficulty retarget lands today (estimate about -9% this morning; landed figure not yet confirmed).
Expectations — Deribit options, 20 Nov expiry (6 days), spot $66,855, not a guarantee: above $70,000 by expiry 20%, below $65,000 28%, between the two 52%. A 4% move either way: up 29%, down 20%. Above the SMA200 ($73,092) only about 5%. ATM straddle $3,074 (4.6% of spot) — the market prices a move of about that size by expiry. Base-rate cross-check (from the morning post, closes down 4% or more, N=3): 0 up first, 2 down first, 1 flat — weak evidence, same direction.
Plan: do not chase, do not catch the knife blind. Long only on a daily close back above $70,000, stop below $67,568; targets $71,460 then $73,092. A daily close below $65,000 opens $64,181 (-4% level) then $60,000. Tiny size, spot only, no leverage. Confidence: Low.
$BTC #Bitcoin #BTC #Crypto
Sequel to this morning's close-verdict post (05:43 PKT): the level that post flagged as must-hold just broke. Bitcoin closed Friday at $68,314, held $68,000 into the close — then kept falling through the night.
Snapshot — live 09:00 PKT, Binance: $66,966, -2.8% in 24h. Range $66,614-$70,214. 24h volume 26,273 BTC ($1.80B). RSI 14 at 27.3 (oversold). Fear & Greed 13, Extreme Fear.
What happened: no single new headline — the same three drivers from Friday kept working. Hot October CPI (+0.4% vs +0.3% expected) repriced Fed expectations; US spot BTC ETFs have now lost over $2.5B since 30 Oct (BigGo Finance); Nvidia's resignation shock kept tech in risk-off. CoinGlass: about $1.3B in liquidations in 24h, mostly longs. BTC is now -9.9% in 7 days, -16.4% in 30 days, and about 47% below its ~$126,000 October 2025 high.
Why $67,568 mattered: it was Friday's low and the line the morning post said must hold. The break is intraday so far — a daily close below it confirms the breakdown. Next clear level is $65,000. Mining difficulty retarget lands today (estimate about -9% this morning; landed figure not yet confirmed).
Expectations — Deribit options, 20 Nov expiry (6 days), spot $66,855, not a guarantee: above $70,000 by expiry 20%, below $65,000 28%, between the two 52%. A 4% move either way: up 29%, down 20%. Above the SMA200 ($73,092) only about 5%. ATM straddle $3,074 (4.6% of spot) — the market prices a move of about that size by expiry. Base-rate cross-check (from the morning post, closes down 4% or more, N=3): 0 up first, 2 down first, 1 flat — weak evidence, same direction.
Plan: do not chase, do not catch the knife blind. Long only on a daily close back above $70,000, stop below $67,568; targets $71,460 then $73,092. A daily close below $65,000 opens $64,181 (-4% level) then $60,000. Tiny size, spot only, no leverage. Confidence: Low.
$BTC #Bitcoin #BTC #Crypto
64

·
--
ဘာသာပြန်ဆိုချက် ကြည့်မည်
🚨 البيتكوين كسر أهم خط في تاريخه... والكل ساكتت!#Bitcoin #BTC #BinanceSquare
البيتكوين ذلحين تحت المتوسط المتحرك لـ 200 أسبوع
لأول مرة من زمان!
ايش يعني هذا الكلام بالعربي البسيط؟
يعني السوق كله تعبان، والناس اللي كانوا متفائلين، ذلحين خايفين!
أنا ما أقول لك بيع، ولا أقول لك اشتري
أنا أقول لك الحقيقة اللي محد يقولها:
90% من الناس اللي يتداولوا كل يوم، يخسروا
ليش؟ لأنهم يتداولوا وهم تعبانين، وهم خايفين، وهم مستعجلين! سؤالي لك، وجاوبني بصراحة:
انت ذلحين خايف؟ ولا متفائل؟ ولا بطلت تفتح التطبيق؟
اكتب لي كلمة واحدة بس: خايف / متفائل / معتزل
🚨 البيتكوين كسر أهم خط في تاريخه... والكل ساكتت!#Bitcoin #BTC #BinanceSquare
البيتكوين ذلحين تحت المتوسط المتحرك لـ 200 أسبوع
لأول مرة من زمان!
ايش يعني هذا الكلام بالعربي البسيط؟
يعني السوق كله تعبان، والناس اللي كانوا متفائلين، ذلحين خايفين!
أنا ما أقول لك بيع، ولا أقول لك اشتري
أنا أقول لك الحقيقة اللي محد يقولها:
90% من الناس اللي يتداولوا كل يوم، يخسروا
ليش؟ لأنهم يتداولوا وهم تعبانين، وهم خايفين، وهم مستعجلين! سؤالي لك، وجاوبني بصراحة:
انت ذلحين خايف؟ ولا متفائل؟ ولا بطلت تفتح التطبيق؟
اكتب لي كلمة واحدة بس: خايف / متفائل / معتزل
البيتكوين ذلحين تحت المتوسط المتحرك لـ 200 أسبوع
لأول مرة من زمان!
ايش يعني هذا الكلام بالعربي البسيط؟
يعني السوق كله تعبان، والناس اللي كانوا متفائلين، ذلحين خايفين!
أنا ما أقول لك بيع، ولا أقول لك اشتري
أنا أقول لك الحقيقة اللي محد يقولها:
90% من الناس اللي يتداولوا كل يوم، يخسروا
ليش؟ لأنهم يتداولوا وهم تعبانين، وهم خايفين، وهم مستعجلين! سؤالي لك، وجاوبني بصراحة:
انت ذلحين خايف؟ ولا متفائل؟ ولا بطلت تفتح التطبيق؟
اكتب لي كلمة واحدة بس: خايف / متفائل / معتزل
1
80

·
--
ကျရိပ်ရှိသည်
ဘာသာပြန်ဆိုချက် ကြည့်မည်
$BTC to $30K: Is It Really Going to Happen? 👀
#Bitcoin is trading around $67K. But what if the next major destination is not $100K... but $30K?
Look at this monthly chart.
Bitcoin has experienced some brutal corrections after previous cycle peaks:
🔻 2017–2018: -84%
🔻 2021–2022: -77%
🔻 2025–2026: Could history repeat with another -75% correction?
Bitcoin previously reached around $126K. A 75% drop from there would bring #BTC close to $30K.
And there's something interesting about the green trendline. It connects major historical cycle bottoms, and its projected path points toward the $30K region around 2027.
But this time, we also have a complicated macro environment.
🌍 GEOPOLITICAL RISK
The Iran conflict, energy prices and global uncertainty are keeping markets nervous. Any escalation could push oil prices higher, fuel inflation and trigger another risk-off reaction across financial markets.
🏦 THE FED'S DECEMBER DECISION
Things are getting even more interesting.
October US inflation came in hotter than expected, while the Reuters poll of 101 economists points to another 25 bps rate hike in December.
Markets are also pricing in the possibility of a larger 50 bps hike.😭
Higher rates, stronger dollar and tighter liquidity are not exactly what #bitcoin bulls want to see.
So, do we really need to prepare for $30K?
My view: I won't rule it out, but I won't call it inevitable either.
If geopolitical tensions escalate and the Fed keeps tightening, Bitcoin could face another brutal correction.
But if inflation cools, tensions ease and monetary conditions improve, this bearish scenario could fail completely.
Remember, the chart shows a possibility, not a promise.
Would you start accumulating at $50K, $40K or wait for $30K?
Let's hear your thoughts. 👁️
{future}(BTCUSDT)
$BTC to $30K: Is It Really Going to Happen? 👀
#Bitcoin is trading around $67K. But what if the next major destination is not $100K... but $30K?
Look at this monthly chart.
Bitcoin has experienced some brutal corrections after previous cycle peaks:
🔻 2017–2018: -84%
🔻 2021–2022: -77%
🔻 2025–2026: Could history repeat with another -75% correction?
Bitcoin previously reached around $126K. A 75% drop from there would bring #BTC close to $30K.
And there's something interesting about the green trendline. It connects major historical cycle bottoms, and its projected path points toward the $30K region around 2027.
But this time, we also have a complicated macro environment.
🌍 GEOPOLITICAL RISK
The Iran conflict, energy prices and global uncertainty are keeping markets nervous. Any escalation could push oil prices higher, fuel inflation and trigger another risk-off reaction across financial markets.
🏦 THE FED'S DECEMBER DECISION
Things are getting even more interesting.
October US inflation came in hotter than expected, while the Reuters poll of 101 economists points to another 25 bps rate hike in December.
Markets are also pricing in the possibility of a larger 50 bps hike.😭
Higher rates, stronger dollar and tighter liquidity are not exactly what #bitcoin bulls want to see.
So, do we really need to prepare for $30K?
My view: I won't rule it out, but I won't call it inevitable either.
If geopolitical tensions escalate and the Fed keeps tightening, Bitcoin could face another brutal correction.
But if inflation cools, tensions ease and monetary conditions improve, this bearish scenario could fail completely.
Remember, the chart shows a possibility, not a promise.
Would you start accumulating at $50K, $40K or wait for $30K?
Let's hear your thoughts. 👁️
#Bitcoin is trading around $67K. But what if the next major destination is not $100K... but $30K?
Look at this monthly chart.
Bitcoin has experienced some brutal corrections after previous cycle peaks:
🔻 2017–2018: -84%
🔻 2021–2022: -77%
🔻 2025–2026: Could history repeat with another -75% correction?
Bitcoin previously reached around $126K. A 75% drop from there would bring #BTC close to $30K.
And there's something interesting about the green trendline. It connects major historical cycle bottoms, and its projected path points toward the $30K region around 2027.
But this time, we also have a complicated macro environment.
🌍 GEOPOLITICAL RISK
The Iran conflict, energy prices and global uncertainty are keeping markets nervous. Any escalation could push oil prices higher, fuel inflation and trigger another risk-off reaction across financial markets.
🏦 THE FED'S DECEMBER DECISION
Things are getting even more interesting.
October US inflation came in hotter than expected, while the Reuters poll of 101 economists points to another 25 bps rate hike in December.
Markets are also pricing in the possibility of a larger 50 bps hike.😭
Higher rates, stronger dollar and tighter liquidity are not exactly what #bitcoin bulls want to see.
So, do we really need to prepare for $30K?
My view: I won't rule it out, but I won't call it inevitable either.
If geopolitical tensions escalate and the Fed keeps tightening, Bitcoin could face another brutal correction.
But if inflation cools, tensions ease and monetary conditions improve, this bearish scenario could fail completely.
Remember, the chart shows a possibility, not a promise.
Would you start accumulating at $50K, $40K or wait for $30K?
Let's hear your thoughts. 👁️
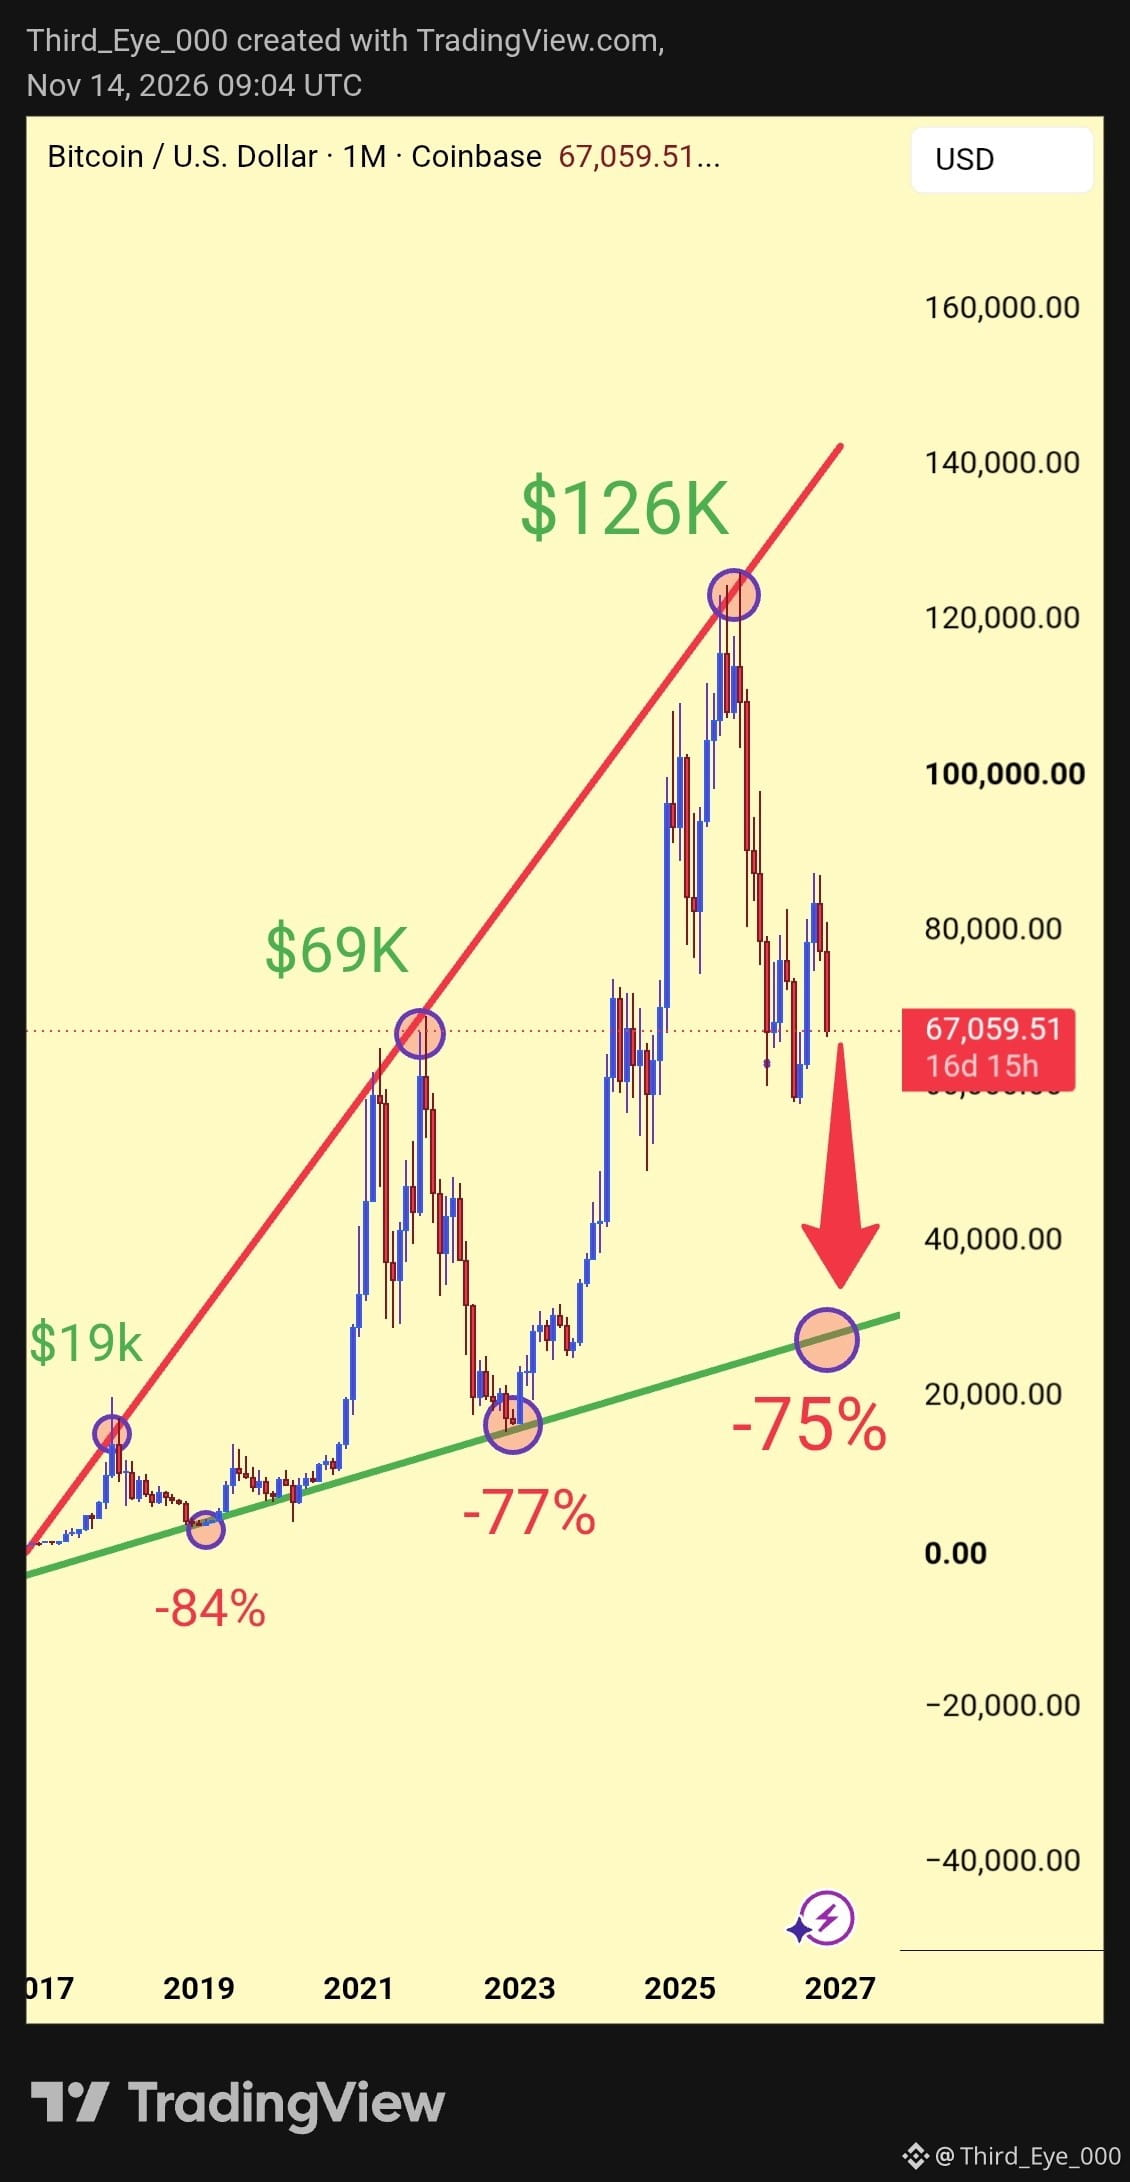
171
Log in to explore more content
Join global crypto users on Binance Square
⚡️ Get latest and useful information about crypto.
💬 Trusted by the world’s largest crypto exchange.
👍 Discover real insights from verified creators.
အီးမေးလ် / ဖုန်းနံပါတ်
ရေပန်းစားနေသော ခေါင်းစဉ်များ
1
#WhoWillSucceedJensenHuangatNvidia?
ကြည့်ရှုမှု 23,079 ကြိမ်
339 ဦး ဆွေးနွေးနေသည်
2
#WhatWillDriveCryptoandStocks’NextRebound?
ကြည့်ရှုမှု 315,080 ကြိမ်
2,293 ဦး ဆွေးနွေးနေသည်
3
#USPPIMissMayEaseBTCPressure
ကြည့်ရှုမှု 141,252 ကြိမ်
1,589 ဦး ဆွေးနွေးနေသည်
4
#TONStrategyReports$23.97MQ3NetLoss
ကြည့်ရှုမှု 435 ကြိမ်
10 ဦး ဆွေးနွေးနေသည်
5
#PolkadotCommunityApprovesNewStrategyWith97%Vote
ကြည့်ရှုမှု 1,261 ကြိမ်
63 ဦး ဆွေးနွေးနေသည်
6
#dYdXPlansV9.9UpgradeToShiftUSDCToInjective
ကြည့်ရှုမှု 1,145 ကြိမ်
50 ဦး ဆွေးနွေးနေသည်
7
#TradFiForBeginners
ကြည့်ရှုမှု 661,447 ကြိမ်
4,287 ဦး ဆွေးနွေးနေသည်
8
#MANTRAPausesUnstakingFor7DaysAfterKeplrSecurityIncident
ကြည့်ရှုမှု 2,509 ကြိမ်
36 ဦး ဆွေးနွေးနေသည်
9
#BitcoinCoreDisclosesTorTrafficVulnerability
ကြည့်ရှုမှု 64,985 ကြိမ်
902 ဦး ဆွေးနွေးနေသည်
10
#BitcoinBreaksBelow200WeekMovingAverage
ကြည့်ရှုမှု 142,438 ကြိမ်
913 ဦး ဆွေးနွေးနေသည်