
Tayeb 101
11.4k Posts

Tayeb 101
HODLer & crypto analyst turning volatility into opportunity; sharing chart insights.
4.6K+ Following
13.1K+ Followers
15.0K+ Liked
Posts
All
Quotes
Videos
Live
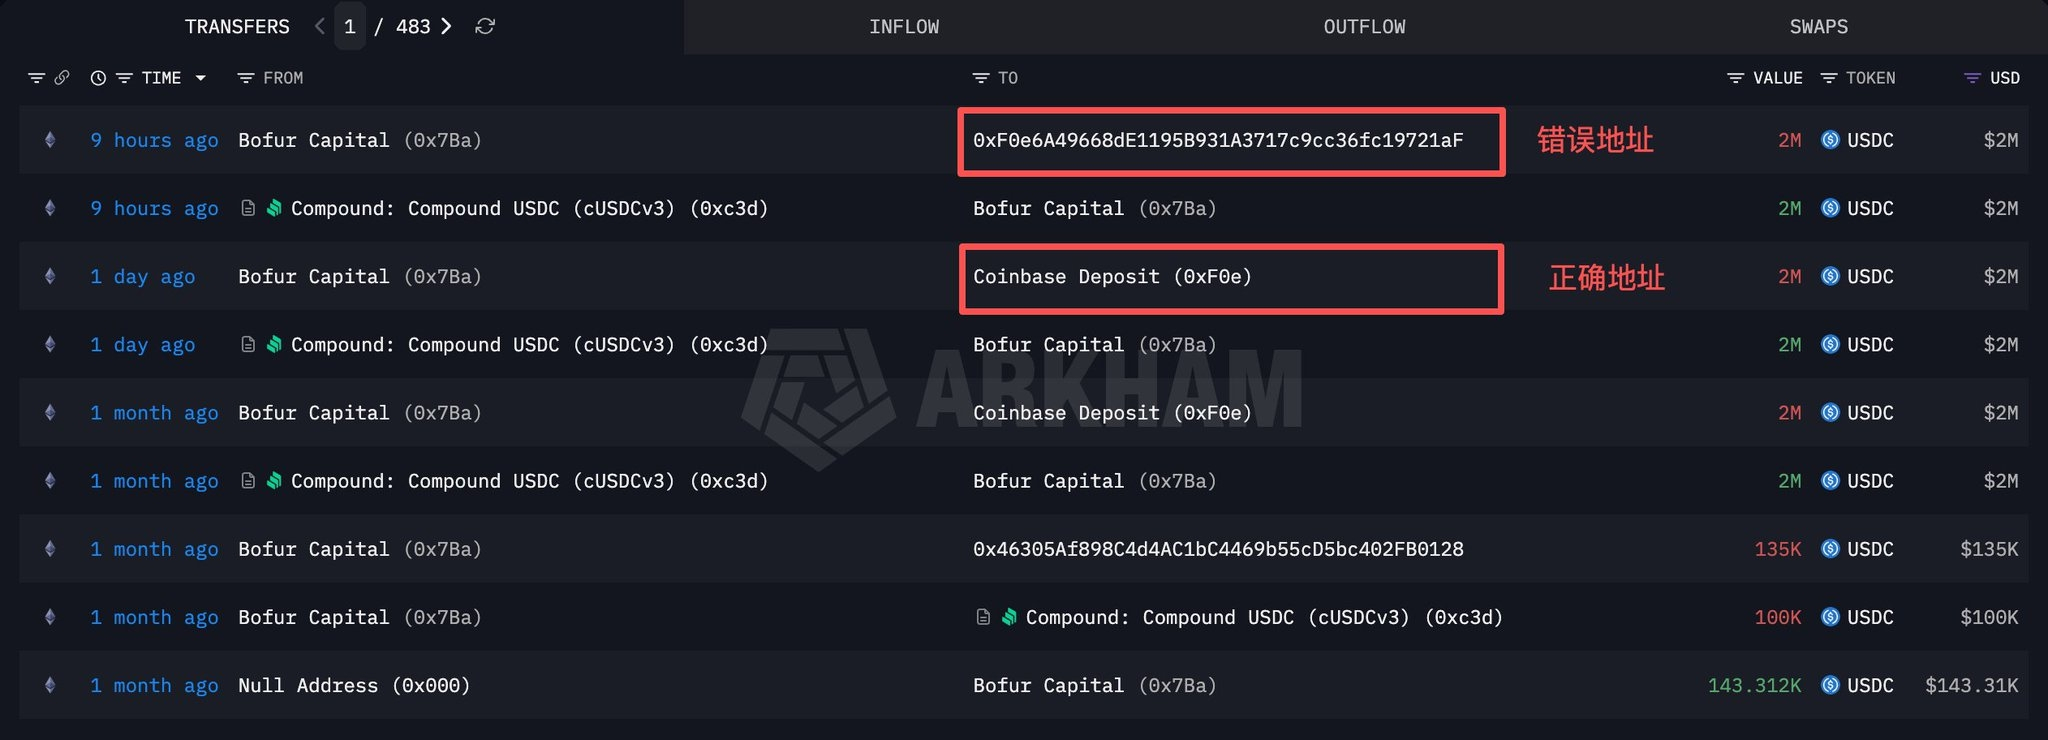
9 hours ago, someone directly copied an incorrect address from the transaction history and made a transfer, resulting in a loss of 2 million USD.
Please make sure to double-check the wallet address before sending funds, and never copy addresses from historical records! $BTC
Please make sure to double-check the wallet address before sending funds, and never copy addresses from historical records! $BTC
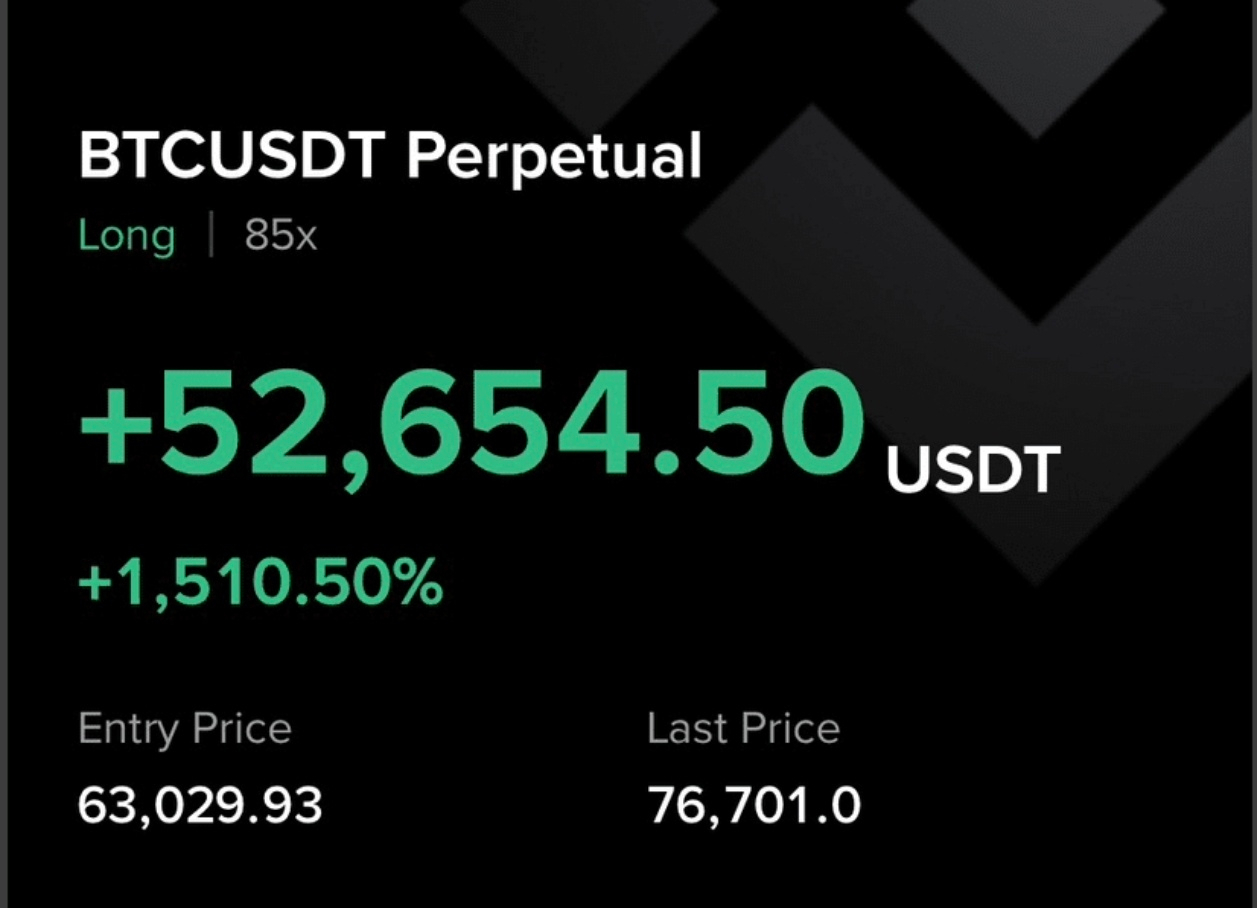
BTC long from $63,029 all the way to $76,701 🚀 85x leverage and still standing, that's the kind of conviction that either makes you rich or wrecks you 😤
+52,654.50 USDT profit, +1,510.50% on the position 💰 this is why people keep gambling on perps even after getting rejected a dozen times before
Not financial advice but $BTC holding above 76k after a run like this tells me buyers aren't done yet, could easily see another leg up if this level holds 📈
Leverage like this isn't for everyone though, one wrong move and this flips into a liquidation story instead of a flex 💀
+52,654.50 USDT profit, +1,510.50% on the position 💰 this is why people keep gambling on perps even after getting rejected a dozen times before
Not financial advice but $BTC holding above 76k after a run like this tells me buyers aren't done yet, could easily see another leg up if this level holds 📈
Leverage like this isn't for everyone though, one wrong move and this flips into a liquidation story instead of a flex 💀
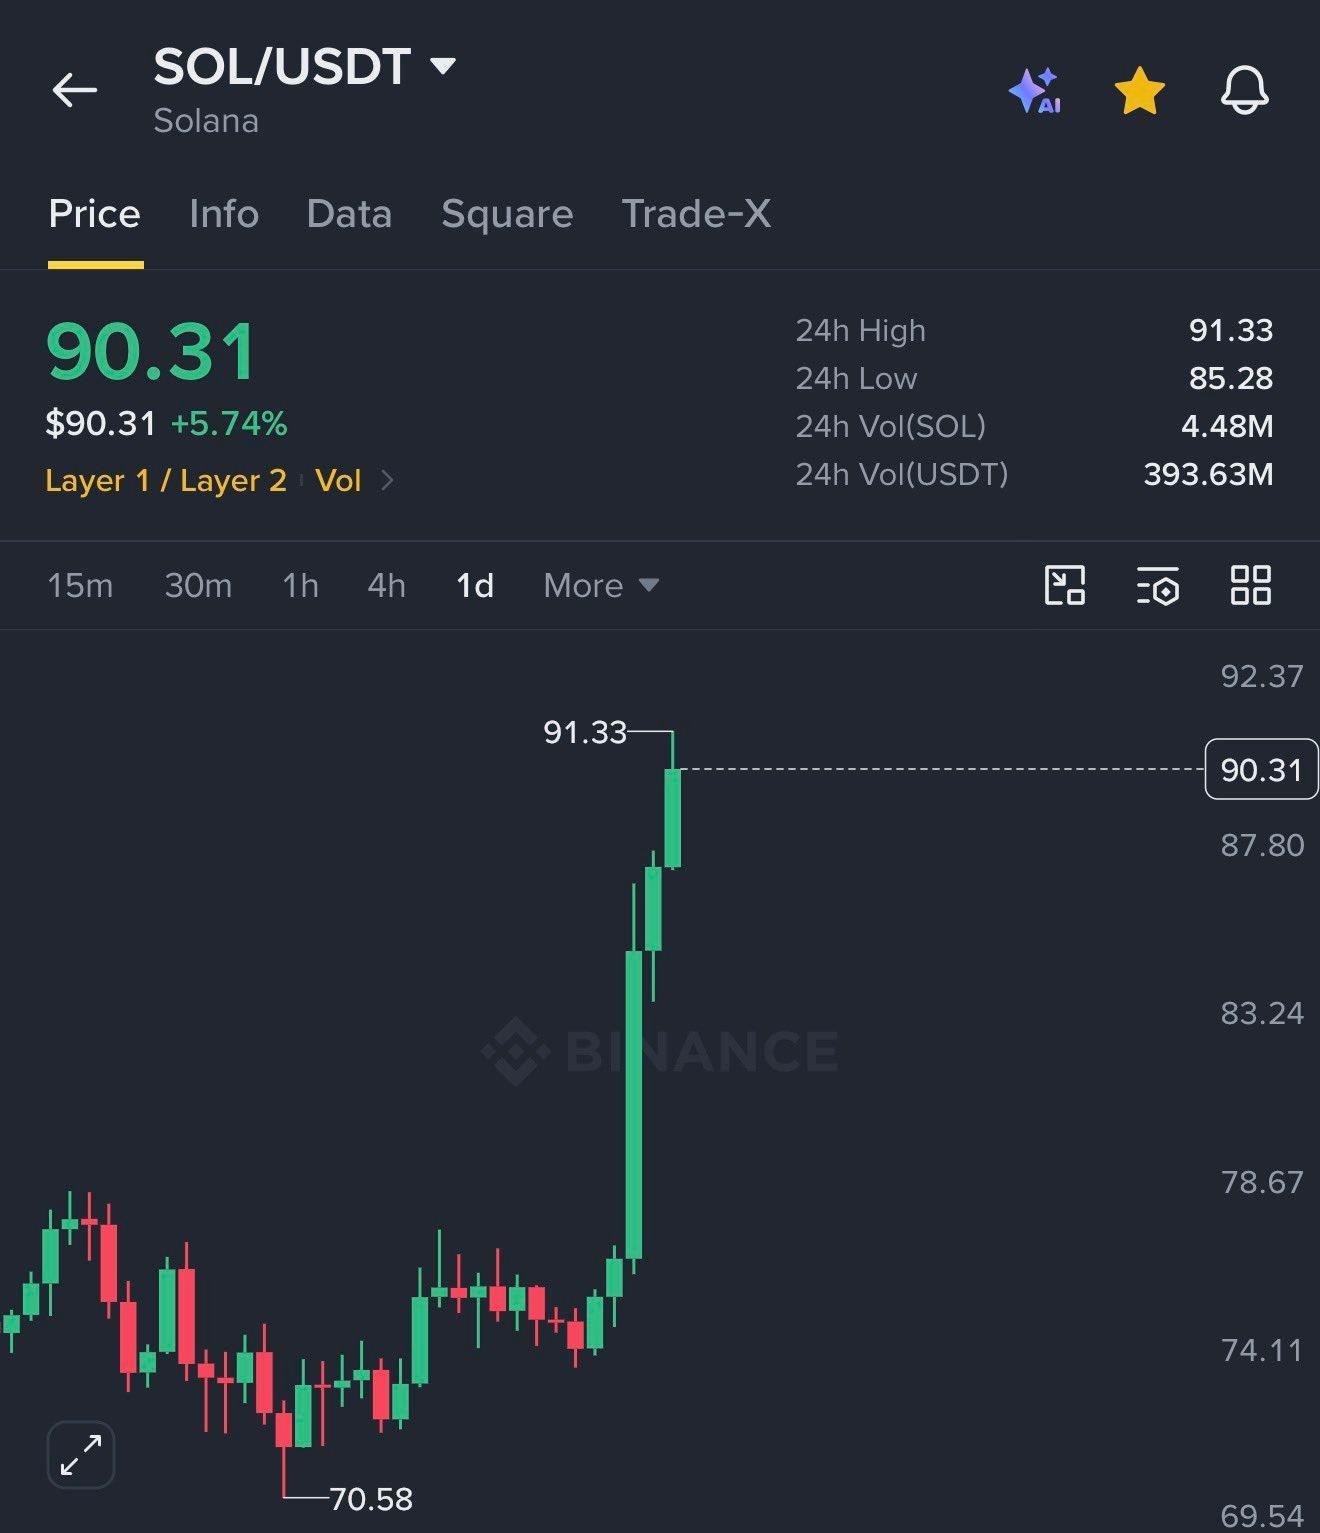
🚨 LATEST: CZ Backs Tokenization Across All Blockchains
⚡ CZ said he supports tokenization across all blockchains, despite the potential for fragmented liquidity.
⚡ “It is the fastest way to grow the sector,” CZ said, pointing to multiple players pushing tokenization forward.
#CZ #Tokenization #Crypto #Blockchain #RWA
⚡ CZ said he supports tokenization across all blockchains, despite the potential for fragmented liquidity.
⚡ “It is the fastest way to grow the sector,” CZ said, pointing to multiple players pushing tokenization forward.
#CZ #Tokenization #Crypto #Blockchain #RWA
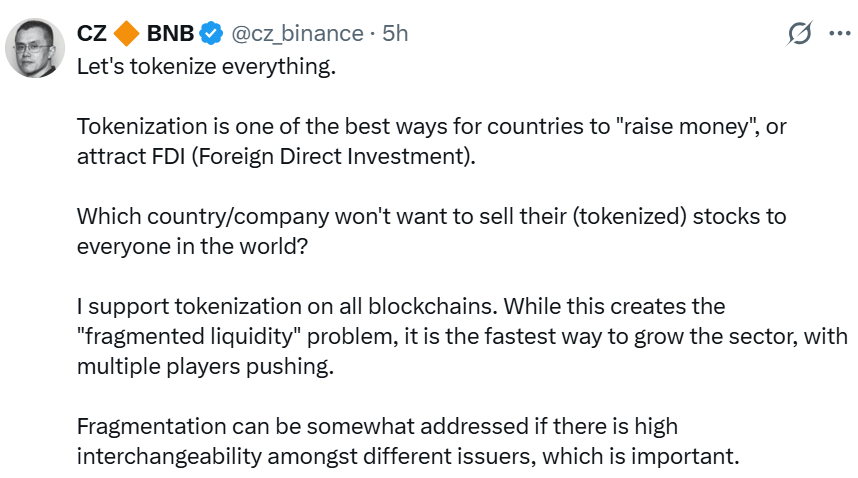
JUST IN: $222,000,000 shorts liquidated from the cryptocurrency market in the past 60 minutes. $BTC
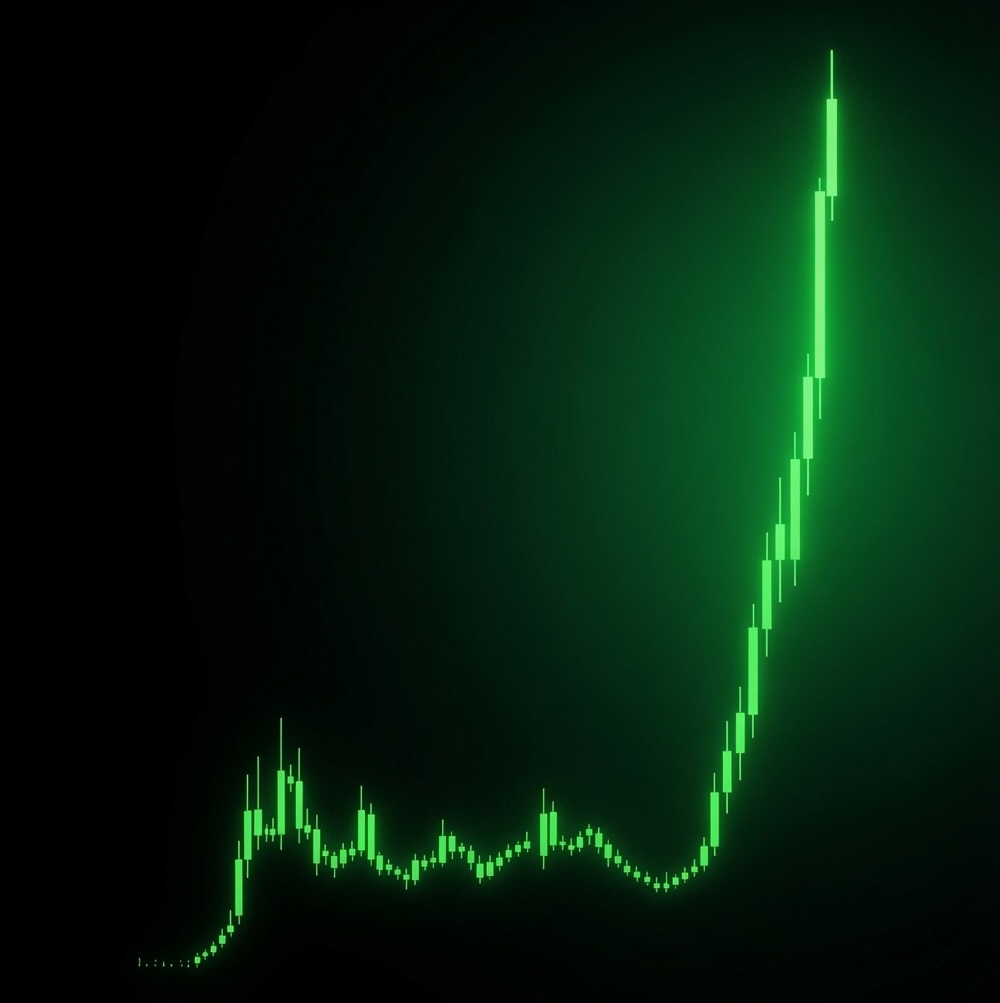
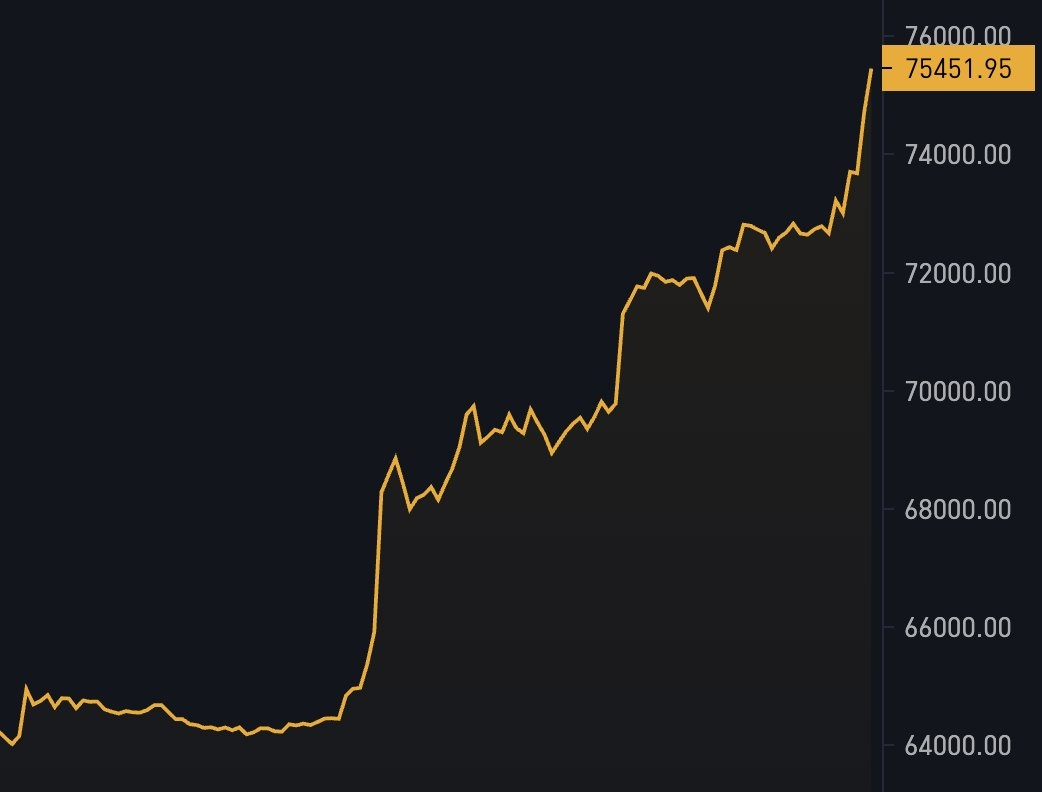
BEARS JUST GOT DESTROYED.
Crypto shorts suffered over $2.7 billion in liquidations as Bitcoin rallied above $70,000.
The move caught a lot of traders on the wrong side.
This is exactly why leverage matters.
When positioning becomes too one-sided, the market doesn’t need much fuel to trigger a violent move in the opposite direction.
Bitcoin didn’t just move higher.
It forced billions in bearish bets to unwind.
Now the question:
Was this the start of the next leg higher…
Or did the market just flush out excessive leverage before the next battle?
Watching how price reacts around $70K closely.
Crypto shorts suffered over $2.7 billion in liquidations as Bitcoin rallied above $70,000.
The move caught a lot of traders on the wrong side.
This is exactly why leverage matters.
When positioning becomes too one-sided, the market doesn’t need much fuel to trigger a violent move in the opposite direction.
Bitcoin didn’t just move higher.
It forced billions in bearish bets to unwind.
Now the question:
Was this the start of the next leg higher…
Or did the market just flush out excessive leverage before the next battle?
Watching how price reacts around $70K closely.
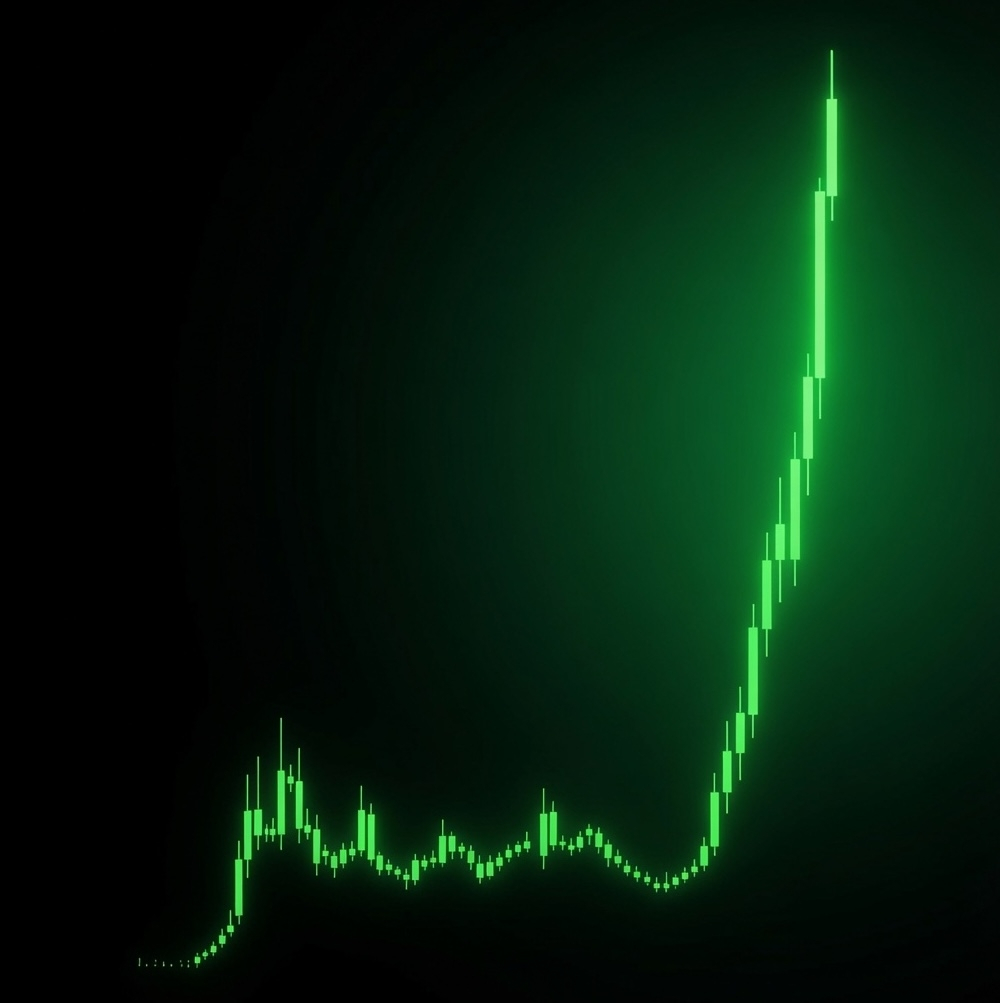
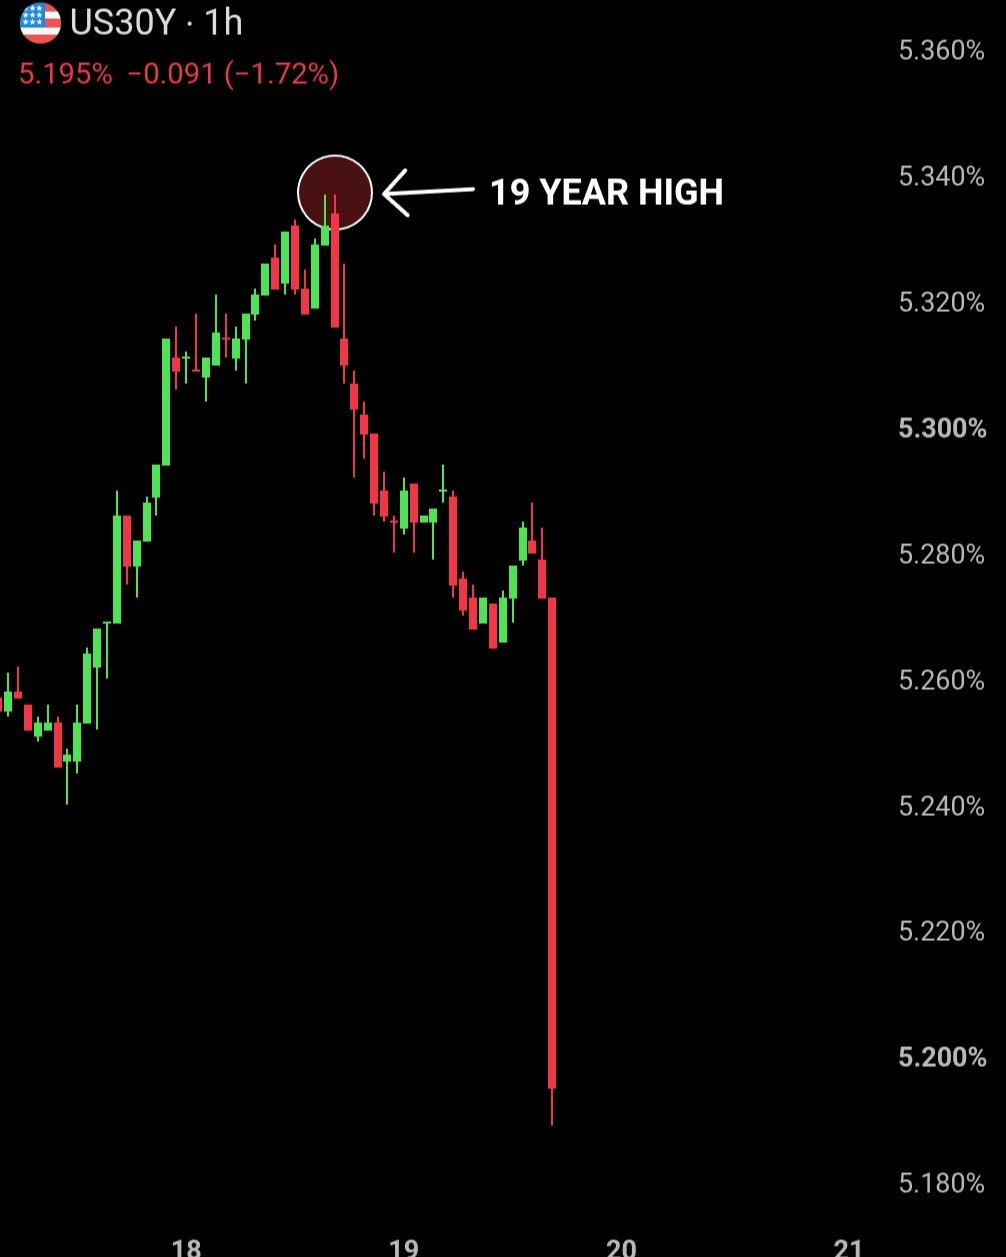
BREAKING: The US 30 year yield just crashed below 5.20% after the Treasury doubled its long term bond buybacks.
The yield hit 5.337% yesterday, a 19 year high, before dropping to 5.189%.
A buyback is when the Treasury goes into the market and buys back bonds it already issued.
That takes supply out of the market and pushes prices up, which pulls yields down.
Treasury is doubling the size of these operations in the 10 to 30 year sector from $2 billion to $4 billion each, starting September 9 and running through November 4.
Treasury says this is about liquidity, not the level of yields.
The timing still matters.
The announcement landed the same week borrowing costs hit their highest level since 2007, and the market read it as the government stepping in to support its own debt.
The yield hit 5.337% yesterday, a 19 year high, before dropping to 5.189%.
A buyback is when the Treasury goes into the market and buys back bonds it already issued.
That takes supply out of the market and pushes prices up, which pulls yields down.
Treasury is doubling the size of these operations in the 10 to 30 year sector from $2 billion to $4 billion each, starting September 9 and running through November 4.
Treasury says this is about liquidity, not the level of yields.
The timing still matters.
The announcement landed the same week borrowing costs hit their highest level since 2007, and the market read it as the government stepping in to support its own debt.
54,000 crypto wallet users’ data has reportedly been leaked.
Owners of Trezor and SafePal wallets are now facing increased phishing risks as attackers use leaked information to target users.
The important thing:
Your funds are not compromised unless someone gets access to your seed phrase.
Never share your seed phrase.
Never click random wallet links.
Never trust anyone claiming to be “support” in your DMs.
In crypto, your security practices matter just as much as your investments.
Owners of Trezor and SafePal wallets are now facing increased phishing risks as attackers use leaked information to target users.
The important thing:
Your funds are not compromised unless someone gets access to your seed phrase.
Never share your seed phrase.
Never click random wallet links.
Never trust anyone claiming to be “support” in your DMs.
In crypto, your security practices matter just as much as your investments.

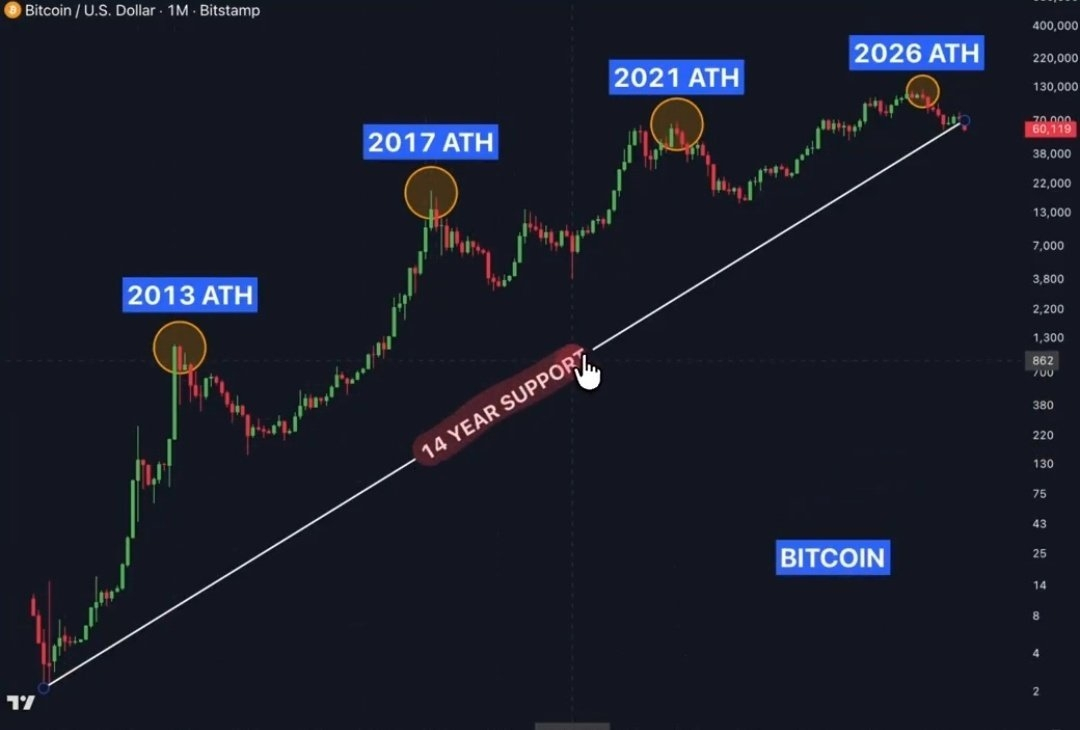
FOR 14 YEARS, #BITCOIN NEVER LOST THIS TRENDLINE.
Not in the 2014 collapse.
Not in the 2018 bear market.
Not even during the 2022 capitulation.
Now it’s happening.
Bitcoin is starting to break below the same long-term support that held every previous cycle together.
Something structurally changed this cycle.
Not in the 2014 collapse.
Not in the 2018 bear market.
Not even during the 2022 capitulation.
Now it’s happening.
Bitcoin is starting to break below the same long-term support that held every previous cycle together.
Something structurally changed this cycle.
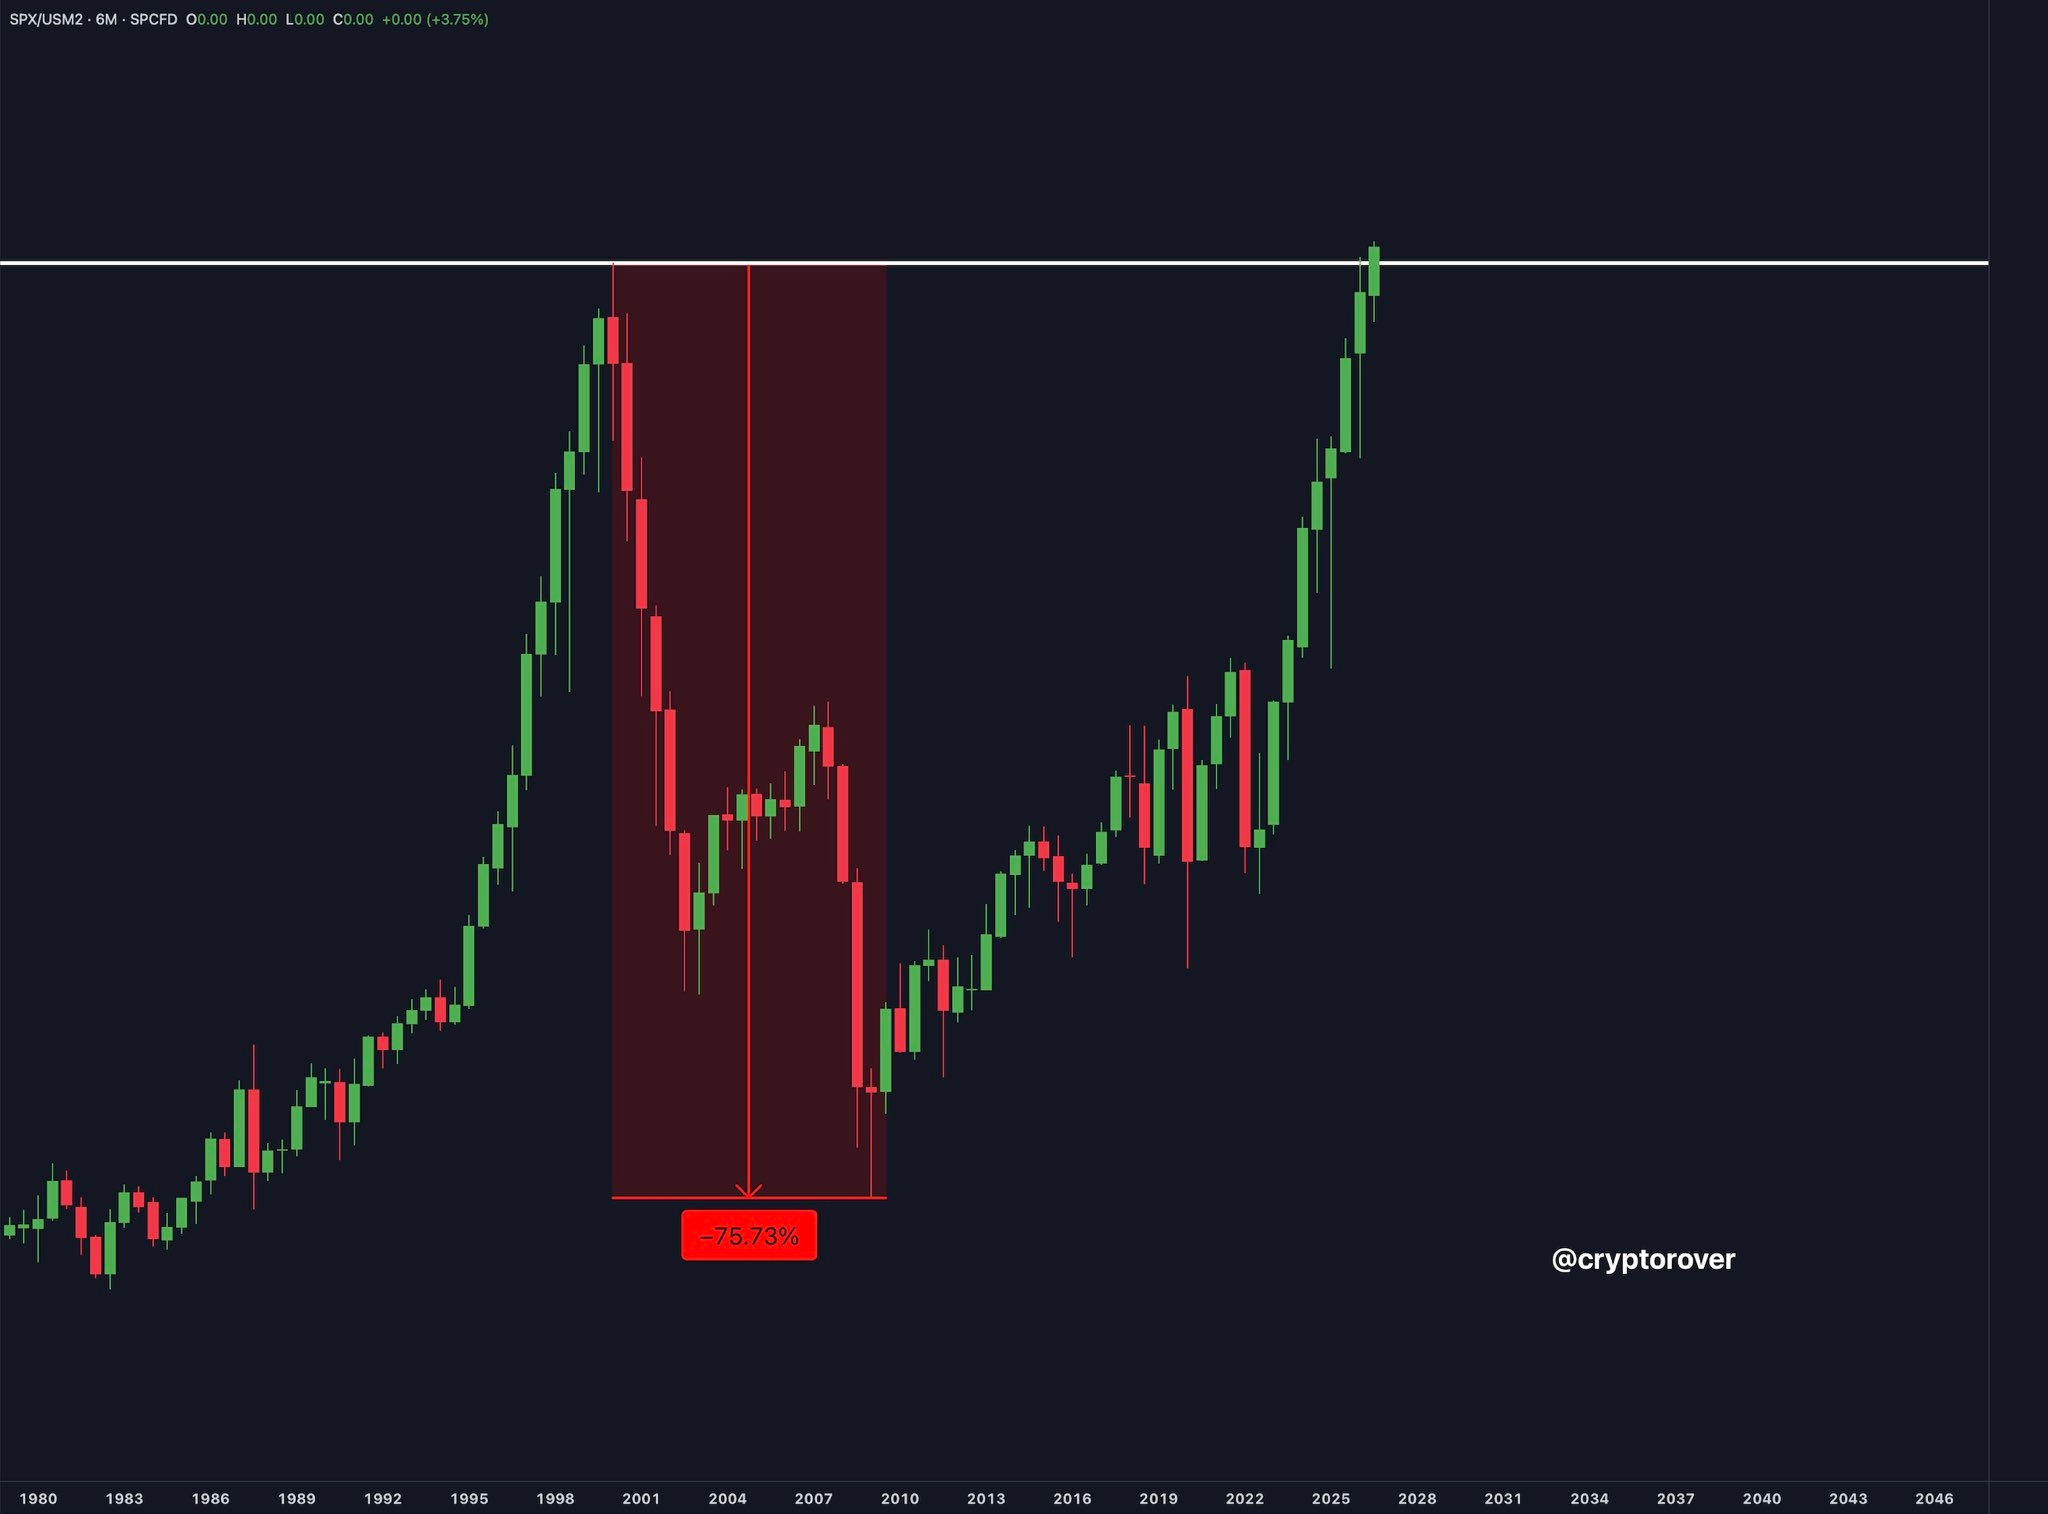
BREAKING: 🚨 U.S. stock market (S&P 500) is now at its most overvalued level in history, overtaking the 2008 peak.
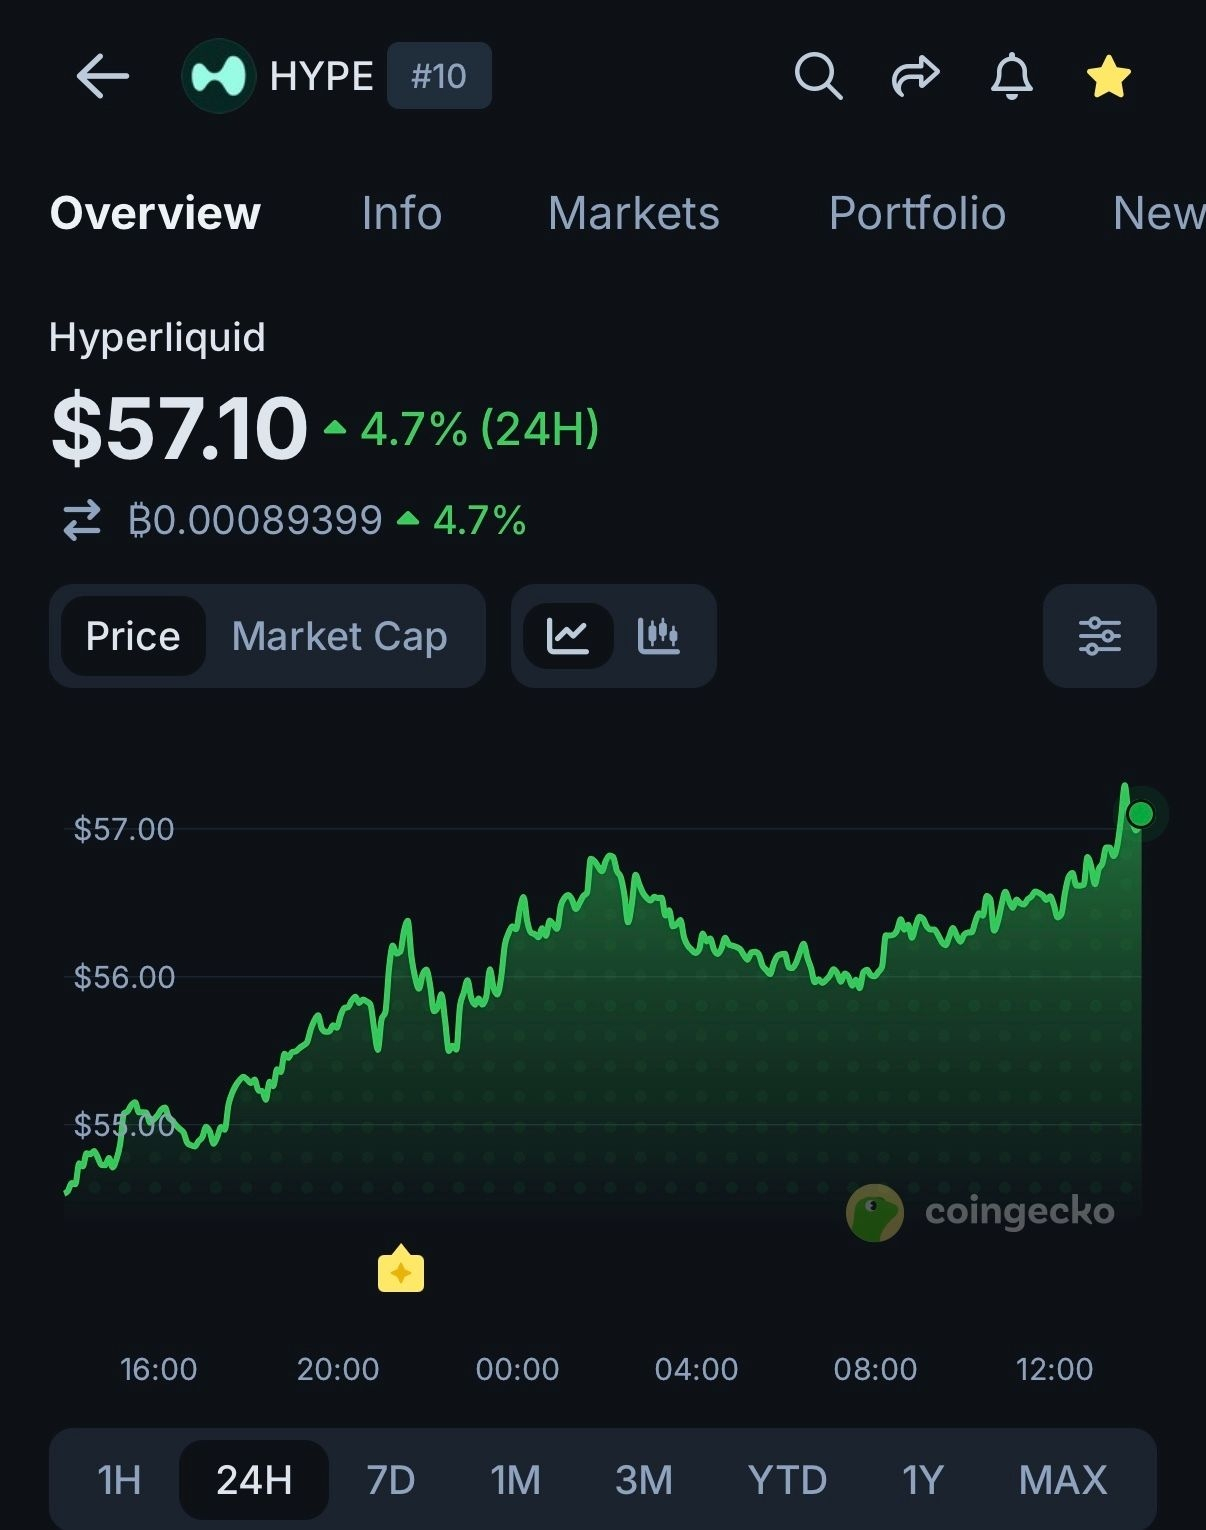
JUST IN: $HYPE reclaims $57 for the first time since late July, amid news it is exploring a path into US perpetual futures markets.
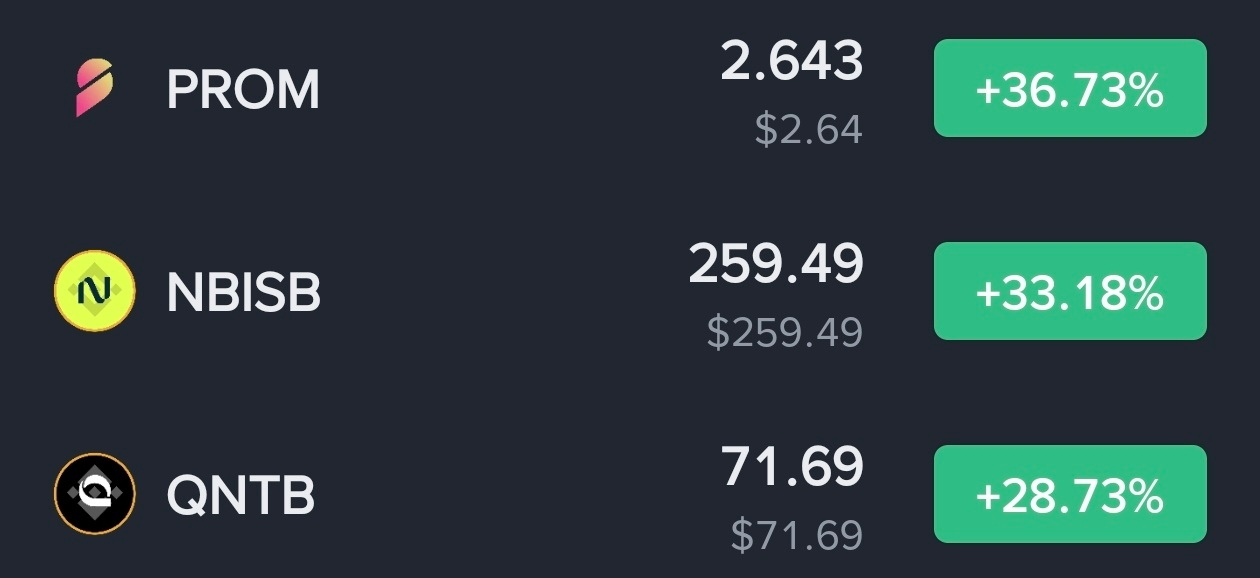
$PROM leading, up +36.73% at $2.643
$NBISB up +33.18% sitting at 259.49
$QNTB close behind at +28.73% now at 71.69
PROM stretching ahead of this group here, if it holds above $2.60 there's a decent chance it keeps pushing before things cool off 👀
#Crypto #Altcoins #CryptoGainers
$NBISB up +33.18% sitting at 259.49
$QNTB close behind at +28.73% now at 71.69
PROM stretching ahead of this group here, if it holds above $2.60 there's a decent chance it keeps pushing before things cool off 👀
#Crypto #Altcoins #CryptoGainers
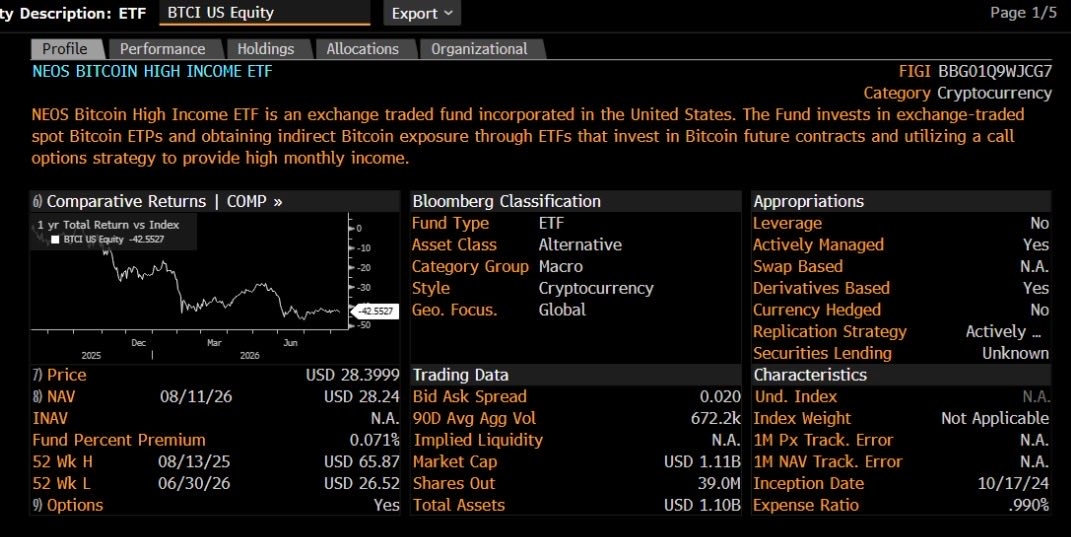
JUST IN: Goldman Sachs acquires NEOS, including $1 billion in their Bitcoin High Income ETFs 🤯
Swedish investment firm B Treasury Capital AB plans to become the first company in Europe to pay dividends in Bitcoin
The company, valued at approximately $11 million, says it intends to distribute a 10% annual dividend yield, with monthly Bitcoin payouts to eligible shareholders
The company, valued at approximately $11 million, says it intends to distribute a 10% annual dividend yield, with monthly Bitcoin payouts to eligible shareholders

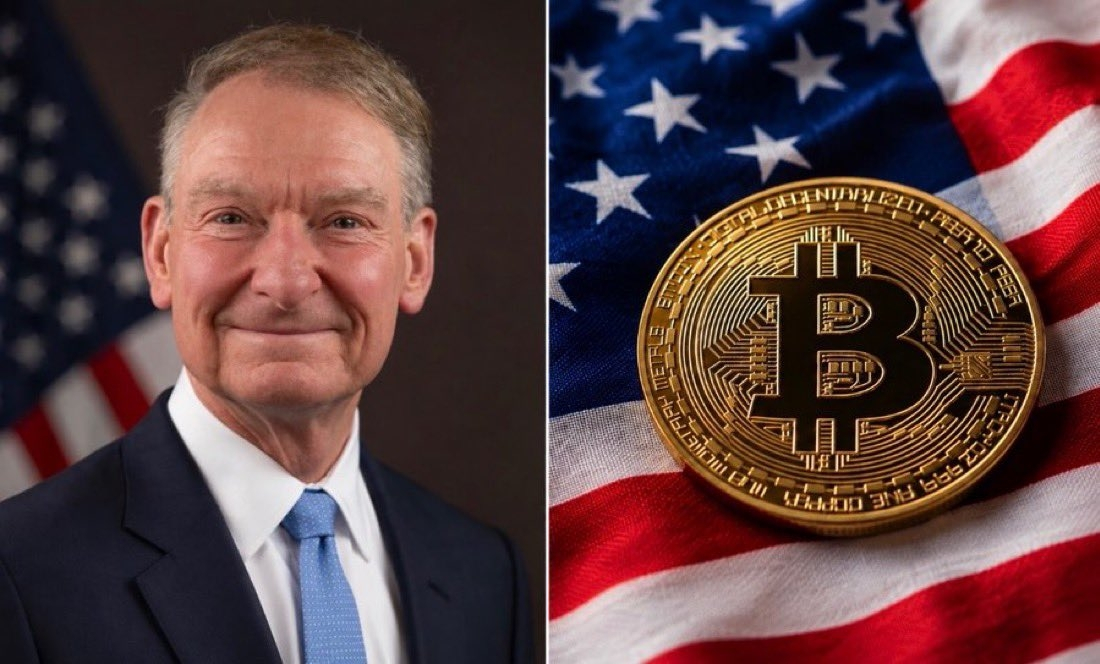
BREAKING: 🇺🇸 SEC prepares an “innovation exemption” that could enable 24/7 blockchain-based trading of tokenized U.S. stocks.
This is HUGE 🚀 $GOOGL
This is HUGE 🚀 $GOOGL
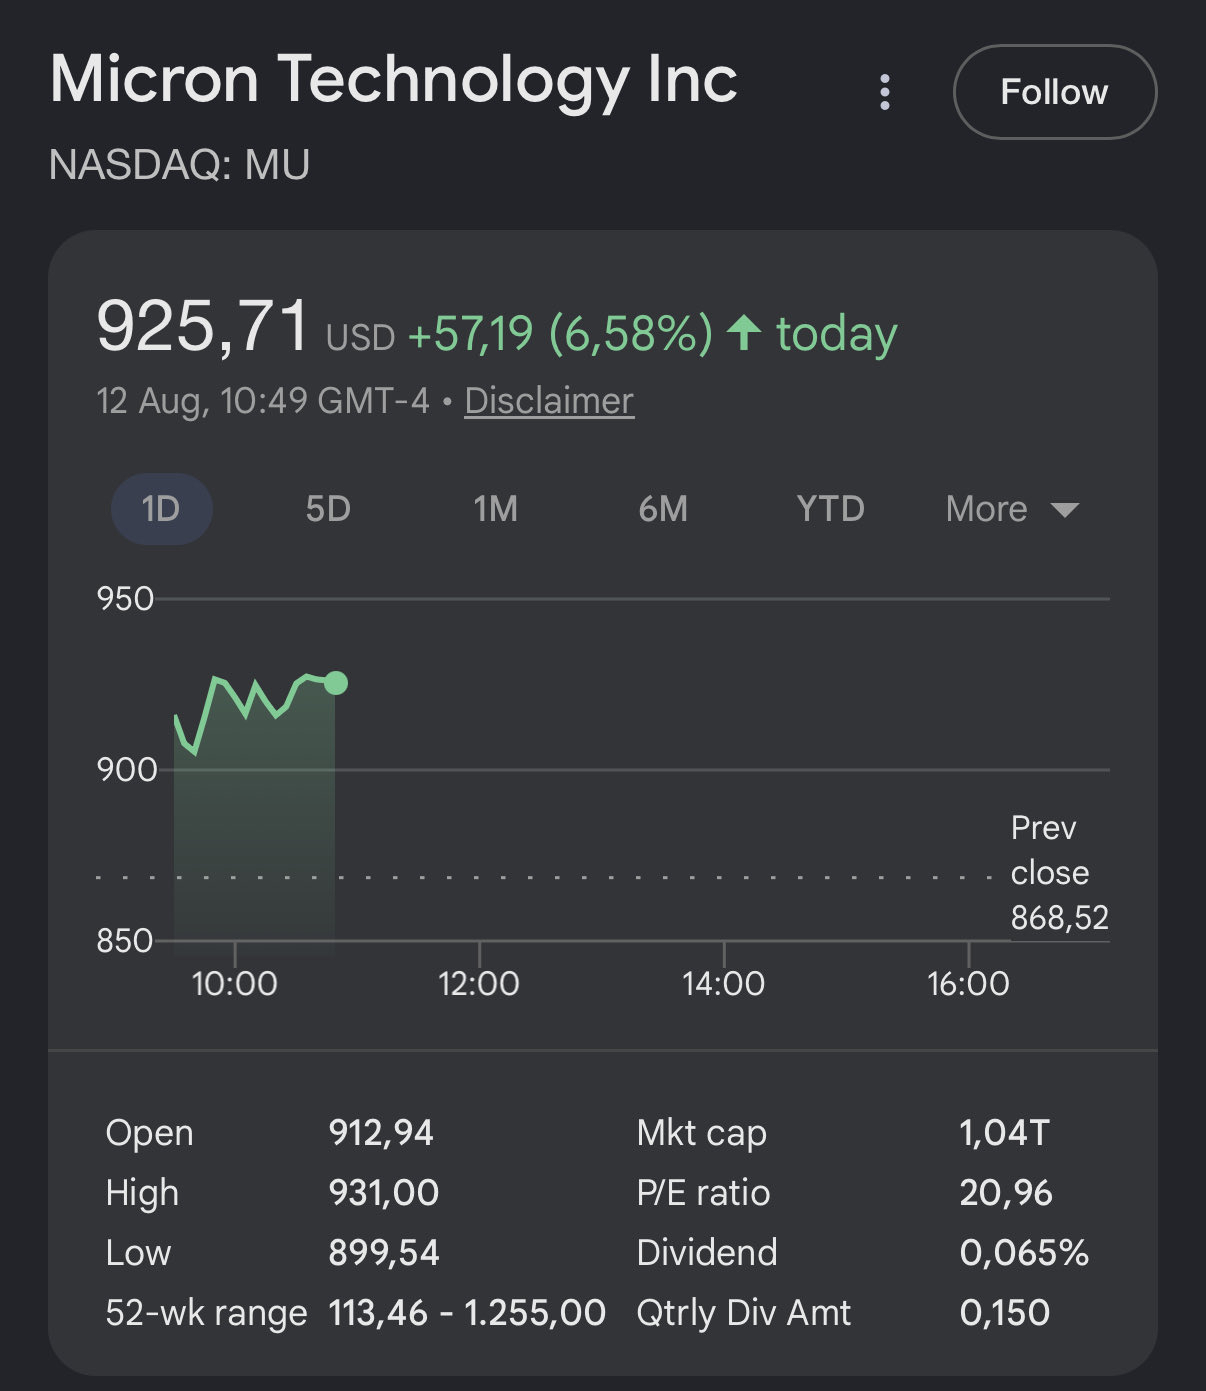
Good day for $MU , up 6% today.
It has been ranging for the past few weeks, but the company’s fundamentals remain strong. I believe we should be back above $1,000 shortly.
Staying patient.
It has been ranging for the past few weeks, but the company’s fundamentals remain strong. I believe we should be back above $1,000 shortly.
Staying patient.
Log in to explore more content