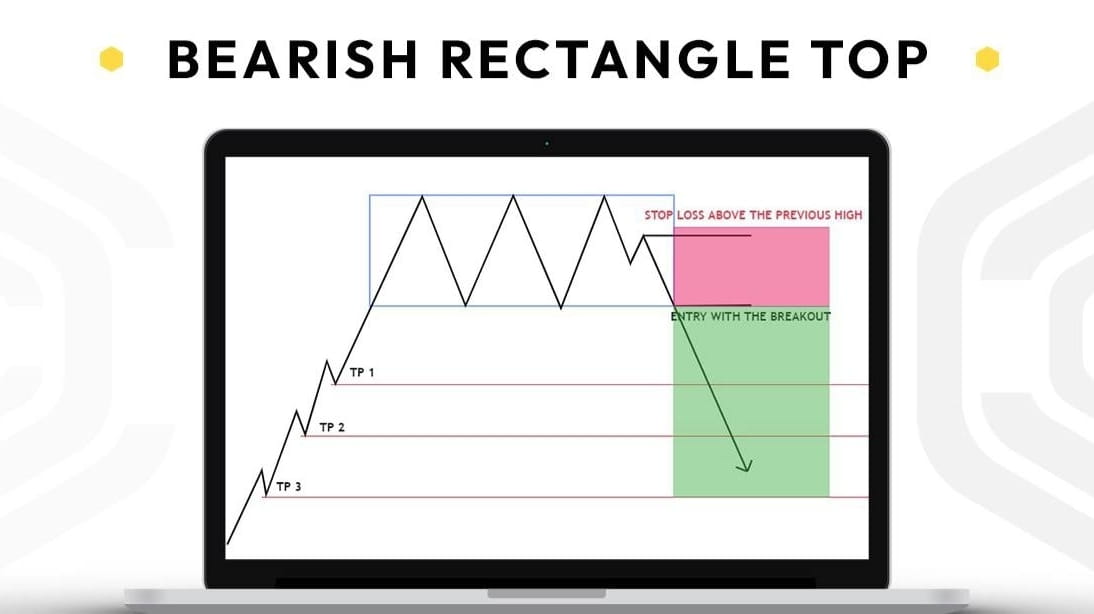

Bearish Rectangle Top
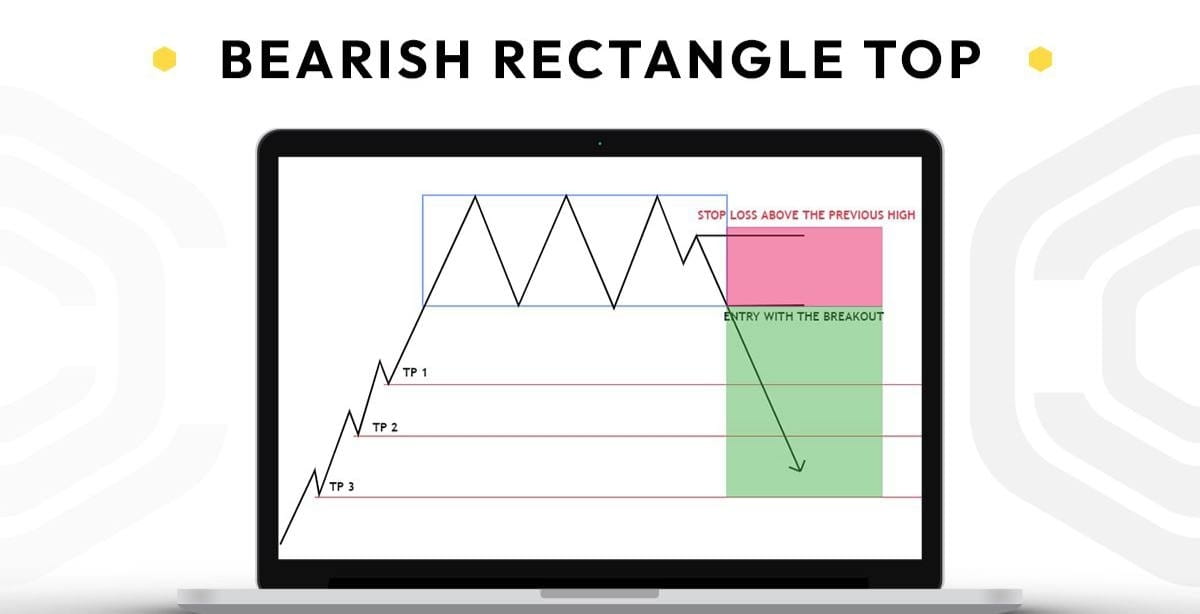
🔅The bearish rectangle top pattern functions as a reversal pattern when it occurs in a uptrend and the breakout happens to the downside.
🔅The price rise in a strong uptrend and then starts to consolidate between support and resistance levels.
🔅The consolidation marks a period of equilibrium when neither buyers nor sellers are stronger than the other party.
🔅This up-down struggle continues for a while and the pattern begins to exhibit the shape of a rectangle.
🔅In the case of a Bearish rectangle top chart pattern, the stop loss should be placed at the previous high of the pattern.
🔅The limitation for the target will be the previous support level which was formed before by the price action.