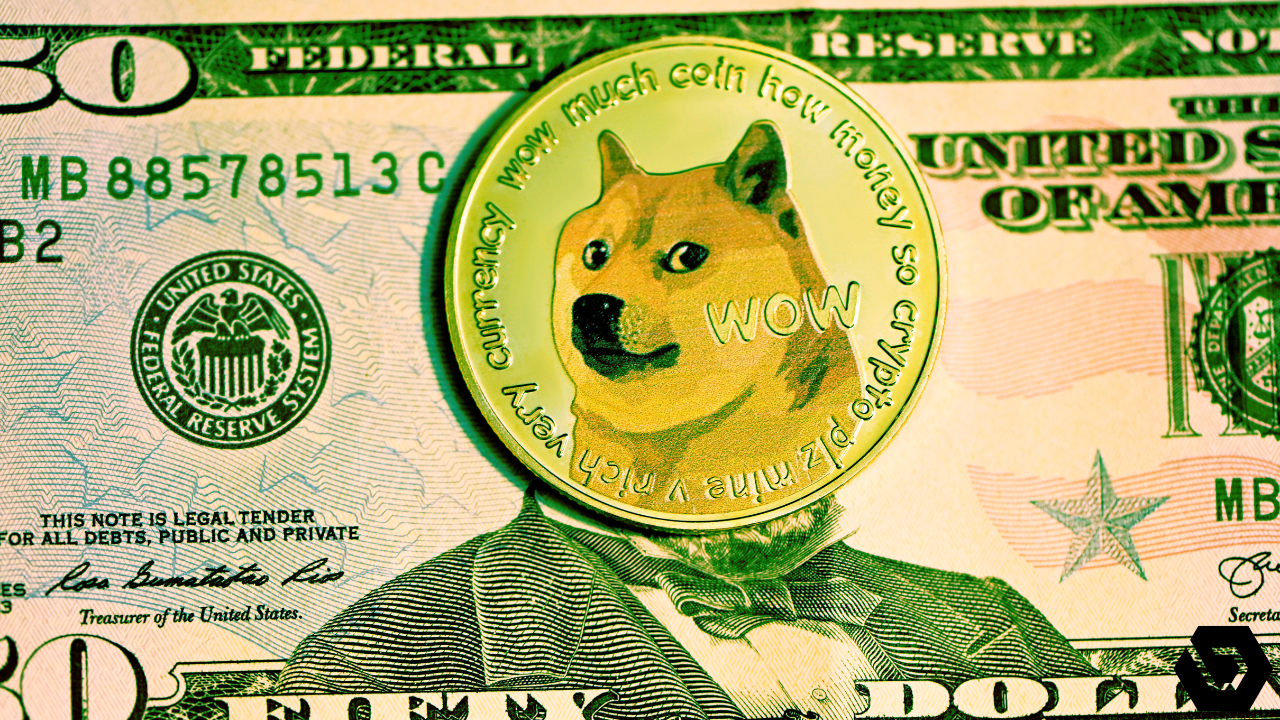
📈 Analysis and Prediction (DOGE and EOS):
#doge - On September 27, the price of #dogecoin broke the descending trend line. This trend line had held for 64 days before the breakthrough. However, DOGE couldn't sustain a significant upward movement. The price reached a high of $0.064 and then fell. Currently, the price of the meme coin is holding just above the horizontal area of $0.060. DOGE is trading within a descending triangle pattern, which usually indicates a bearish trend. If the coin experiences a bearish breakout from the triangle, it will likely drop another 15% and reach the area of $0.052. Despite the pessimistic forecast, a rise in DOGE above the triangle's resistance line would imply a bullish trend. In that case, the price may increase by 8% and reach the resistance level of $0.067. 📉🐶
#eos - Since June 2021, the price of EOS has been declining below a descending resistance line. In April 2023, it rebounded from this line and accelerated the downward pace. In June, the price dropped below the horizontal support area of $0.90. The bearish breakout led the token to a minimum level of $0.50, reached in August, just slightly above the historical low of $0.47. After that, the price rebounded but still remains below the descending resistance line. If EOS breaks below the $0.50 area, it may drop by 80% and reach the next Fibonacci support level at $0.12. However, in the case of a bullish breakout, the price could rise by 50% to the area of $0.90. 📉🔒
And as a gift for reading these analytics - a virtual cup of hot chocolate to warm you up! Have a good appetite!