
Haider Hunter
464 ໂພສ

Haider Hunter
ລາຍງານ
ບລັອກຜູ້ໃຊ້
Crypto Spot and future Trader | , 💎 Real-time analysis & breakout alerts | 🔥 Smart entries, profit-taking strategies, and market insights daily!
3 ກໍາລັງຕິດຕາມ
98 ຜູ້ຕິດຕາມ
631 Liked
ໂພສ
ປັກໝຸດ
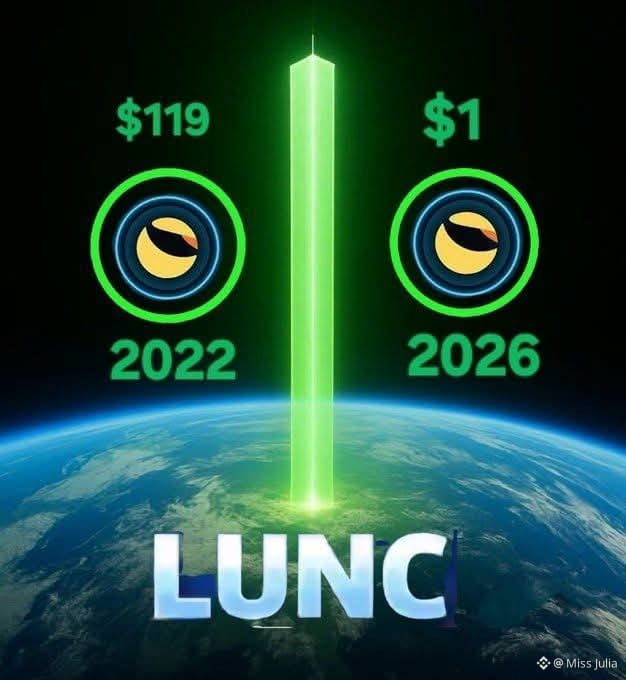
🔥 $LUNC once reached $119.
Yet some people believe it can't even touch $1 again. 🤔
Markets are driven by cycles, sentiment, and conviction. The biggest moves often happen when the majority has already lost faith.
Save this post the comeback story of $LUNC may not be finished yet
🔥 $LUNC once reached $119.
Yet some people believe it can't even touch $1 again. 🤔
Markets are driven by cycles, sentiment, and conviction. The biggest moves often happen when the majority has already lost faith.
Save this post the comeback story of $LUNC may not be finished yet
Yet some people believe it can't even touch $1 again. 🤔
Markets are driven by cycles, sentiment, and conviction. The biggest moves often happen when the majority has already lost faith.
Save this post the comeback story of $LUNC may not be finished yet
15
57
4.7k
ປັກໝຸດ
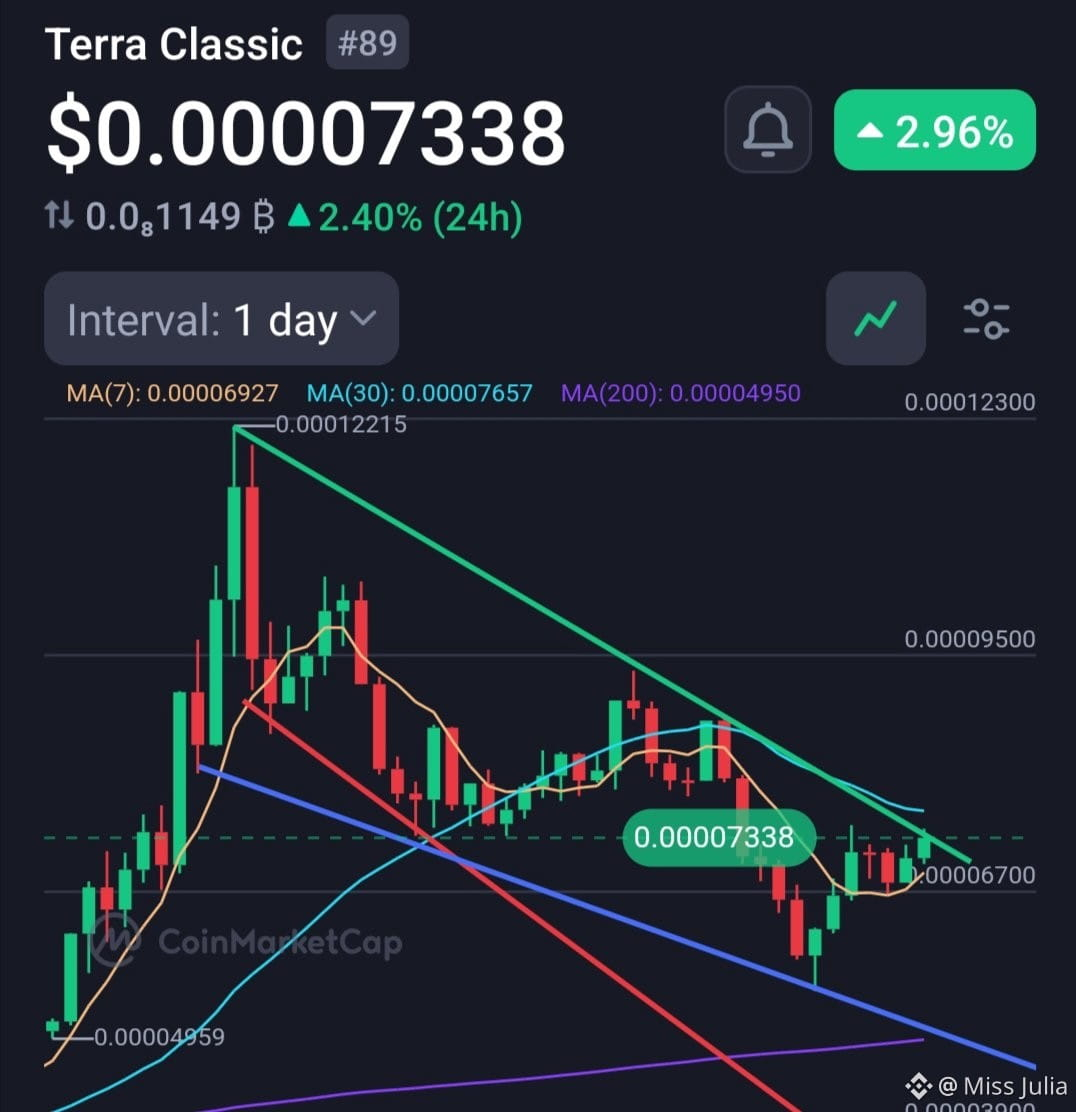
💥 $LUNC is knocking on the door of a major resistance zone bulls are slowly building momentum, and a breakout here could shift sentiment across the entire Terra Classic community.
Break the resistance, and the next targets come into focus fast one strong daily close above resistance could be the spark that starts the next big move.$LUNC
{spot}(LUNCUSDT)
💥 $LUNC is knocking on the door of a major resistance zone bulls are slowly building momentum, and a breakout here could shift sentiment across the entire Terra Classic community.
Break the resistance, and the next targets come into focus fast one strong daily close above resistance could be the spark that starts the next big move.$LUNC
Break the resistance, and the next targets come into focus fast one strong daily close above resistance could be the spark that starts the next big move.$LUNC
12
1
49
4.4k
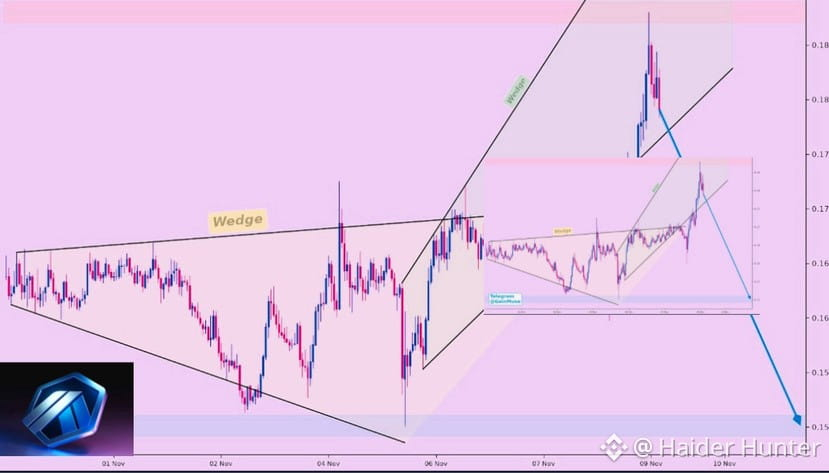
$ARB The useful clue is in the reaction
1H | Latest price: 0.1791. Support reference
0.17640345. Resistance reference 0.18209551
The useful clue is how price treats the boundary not how many lines are on the chart. A close beyond it and a successful retest would support acceptance a return inside would challenge it.
Price behaviour around a boundary matters more than the number of technical markings. Keep the observation separate from the forecast.
$ARB The useful clue is in the reaction
1H | Latest price: 0.1791. Support reference
0.17640345. Resistance reference 0.18209551
The useful clue is how price treats the boundary not how many lines are on the chart. A close beyond it and a successful retest would support acceptance a return inside would challenge it.
Price behaviour around a boundary matters more than the number of technical markings. Keep the observation separate from the forecast.
1H | Latest price: 0.1791. Support reference
0.17640345. Resistance reference 0.18209551
The useful clue is how price treats the boundary not how many lines are on the chart. A close beyond it and a successful retest would support acceptance a return inside would challenge it.
Price behaviour around a boundary matters more than the number of technical markings. Keep the observation separate from the forecast.
3
162
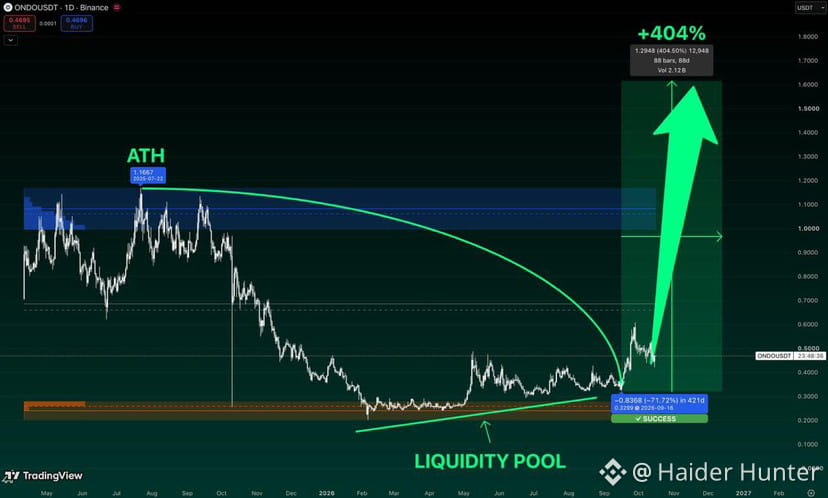
🚨 $ONDO TO $1.60? BULLISH MOMENTUM BUILDING!
$ONDO has bounced from its $0.30 liquidity zone and is now trading near $0.47 the structure looks promising but the major test is reclaiming the $1.00 – $1.16 resistance zone
A confirmed breakout could open the door to
Target $1.60
🚨 $ONDO TO $1.60? BULLISH MOMENTUM BUILDING!
$ONDO has bounced from its $0.30 liquidity zone and is now trading near $0.47 the structure looks promising but the major test is reclaiming the $1.00 – $1.16 resistance zone
A confirmed breakout could open the door to
Target $1.60
$ONDO has bounced from its $0.30 liquidity zone and is now trading near $0.47 the structure looks promising but the major test is reclaiming the $1.00 – $1.16 resistance zone
A confirmed breakout could open the door to
Target $1.60
2
3
197
Three trending crypto assets are attracting market attention for different reasons: Zcash
$ZEC
$PEPE
$ARB
ZEC Privacy is back in focus following the completion of its NU7 upgrade, which reduced block times from 75 to 25 seconds. ETF inflows and institutional interest are also supporting its narrative.
#pepe Whale activity is driving attention.
Arkham linked approximately $51M worth of
PEPE representing 2.82% of its supply to Justin Sun wallets. Traders are watching the $0.000005 resistance level although large-holder movements also carry selling risks.
#arb Arbitrum continues to attract attention after ranking second in monthly perps DEX volume. However its upcoming 92.65M ARB token unlock on November 16 could introduce selling pressure. Key support levels to watch are $0.14 and $O.11.
Each asset has a different catalyst but risk management remains important.
For traders interested in these opportunities, Bitget is running its Trading Club Championship
Three trending crypto assets are attracting market attention for different reasons: Zcash
$ZEC
$PEPE
$ARB
ZEC Privacy is back in focus following the completion of its NU7 upgrade, which reduced block times from 75 to 25 seconds. ETF inflows and institutional interest are also supporting its narrative.
#pepe Whale activity is driving attention.
Arkham linked approximately $51M worth of
PEPE representing 2.82% of its supply to Justin Sun wallets. Traders are watching the $0.000005 resistance level although large-holder movements also carry selling risks.
#arb Arbitrum continues to attract attention after ranking second in monthly perps DEX volume. However its upcoming 92.65M ARB token unlock on November 16 could introduce selling pressure. Key support levels to watch are $0.14 and $O.11.
Each asset has a different catalyst but risk management remains important.
For traders interested in these opportunities, Bitget is running its Trading Club Championship
$ZEC
$PEPE
$ARB
ZEC Privacy is back in focus following the completion of its NU7 upgrade, which reduced block times from 75 to 25 seconds. ETF inflows and institutional interest are also supporting its narrative.
#pepe Whale activity is driving attention.
Arkham linked approximately $51M worth of
PEPE representing 2.82% of its supply to Justin Sun wallets. Traders are watching the $0.000005 resistance level although large-holder movements also carry selling risks.
#arb Arbitrum continues to attract attention after ranking second in monthly perps DEX volume. However its upcoming 92.65M ARB token unlock on November 16 could introduce selling pressure. Key support levels to watch are $0.14 and $O.11.
Each asset has a different catalyst but risk management remains important.
For traders interested in these opportunities, Bitget is running its Trading Club Championship
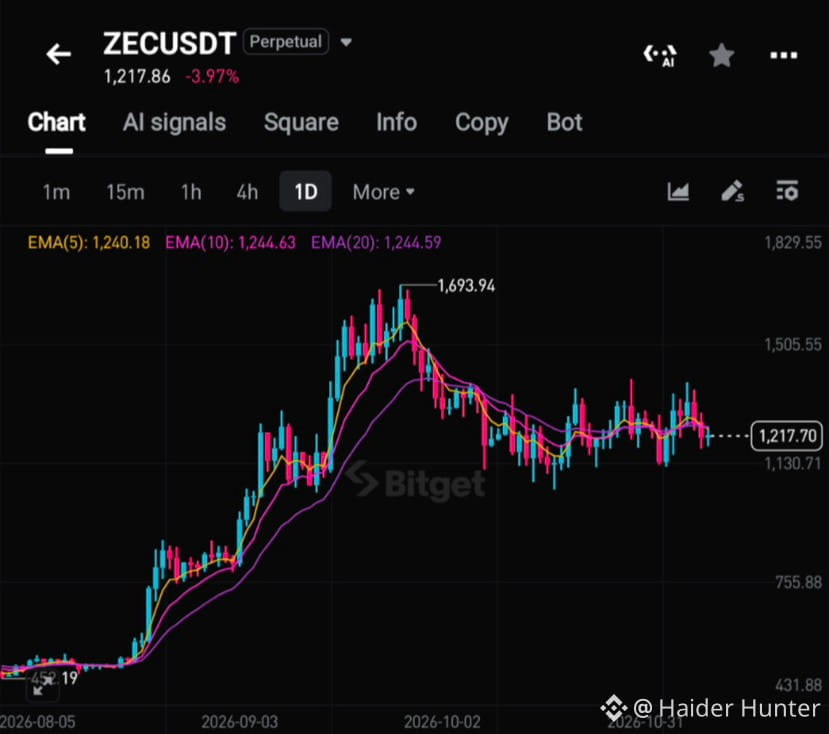
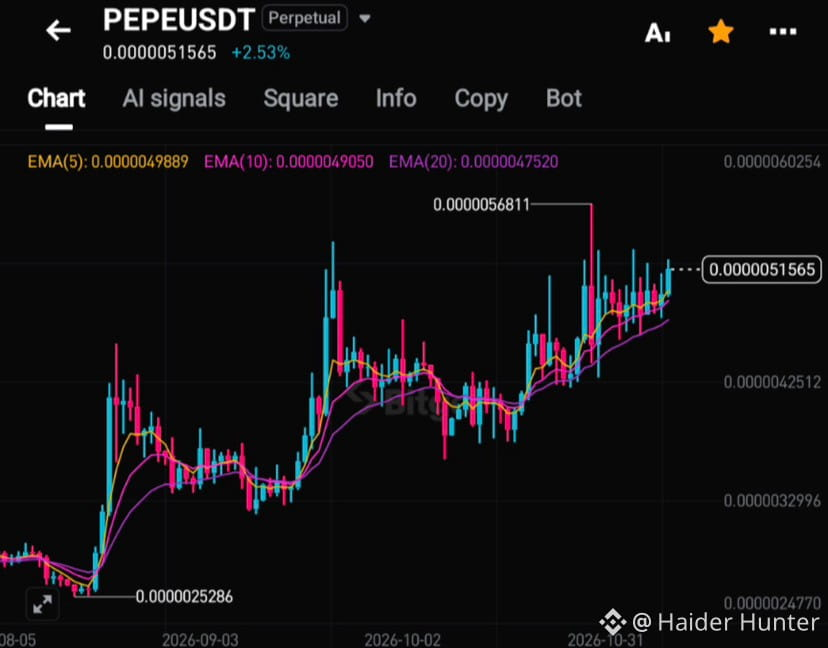
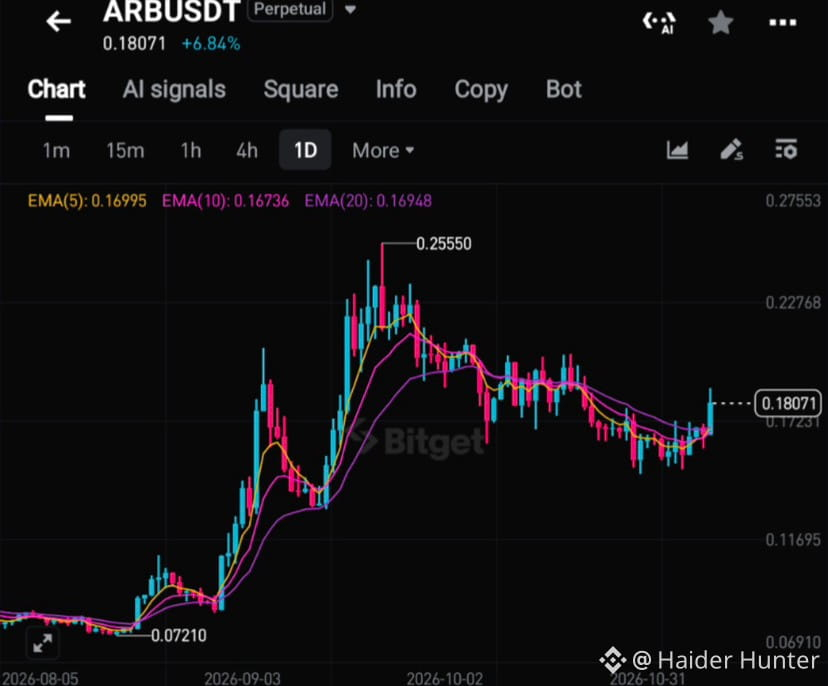
3
51
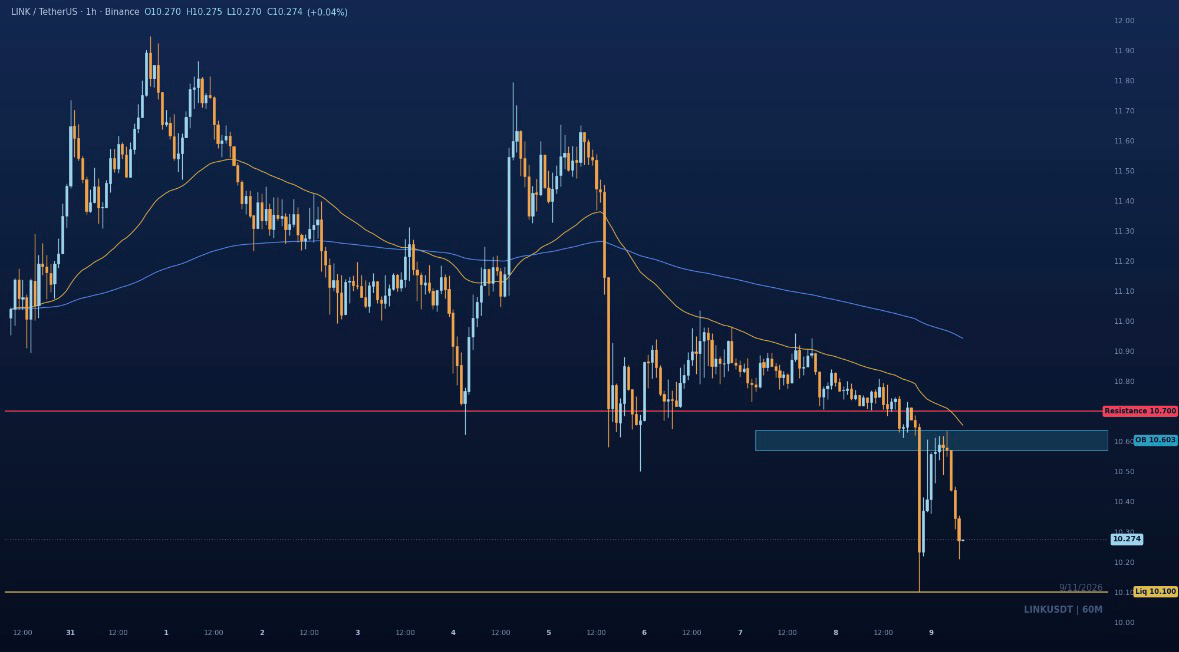
The odd part of this
$LINK hart is the bounce
it came off a swept 10.10 low yet it barely lifted before stalling under the EMAs.
Structure is a clean lower high sequence with
BOS down through 11.00 and 10.70, and price is deep in discount below both the 50 and 200 EMAS.
The 10.57-10.64 order block is the last up candle before the drop so a corrective push into it should meet offers rather than demand.
Continuation toward 10.10 is the base case; a reclaim of 10.70 is what would break it.
Does this bounce look like a real turn to you, or just fuel for the next leg down?
More reads like this land daily in the group, bio has the way in.
The odd part of this
$LINK hart is the bounce
it came off a swept 10.10 low yet it barely lifted before stalling under the EMAs.
Structure is a clean lower high sequence with
BOS down through 11.00 and 10.70, and price is deep in discount below both the 50 and 200 EMAS.
The 10.57-10.64 order block is the last up candle before the drop so a corrective push into it should meet offers rather than demand.
Continuation toward 10.10 is the base case; a reclaim of 10.70 is what would break it.
Does this bounce look like a real turn to you, or just fuel for the next leg down?
More reads like this land daily in the group, bio has the way in.
$LINK hart is the bounce
it came off a swept 10.10 low yet it barely lifted before stalling under the EMAs.
Structure is a clean lower high sequence with
BOS down through 11.00 and 10.70, and price is deep in discount below both the 50 and 200 EMAS.
The 10.57-10.64 order block is the last up candle before the drop so a corrective push into it should meet offers rather than demand.
Continuation toward 10.10 is the base case; a reclaim of 10.70 is what would break it.
Does this bounce look like a real turn to you, or just fuel for the next leg down?
More reads like this land daily in the group, bio has the way in.
3
168
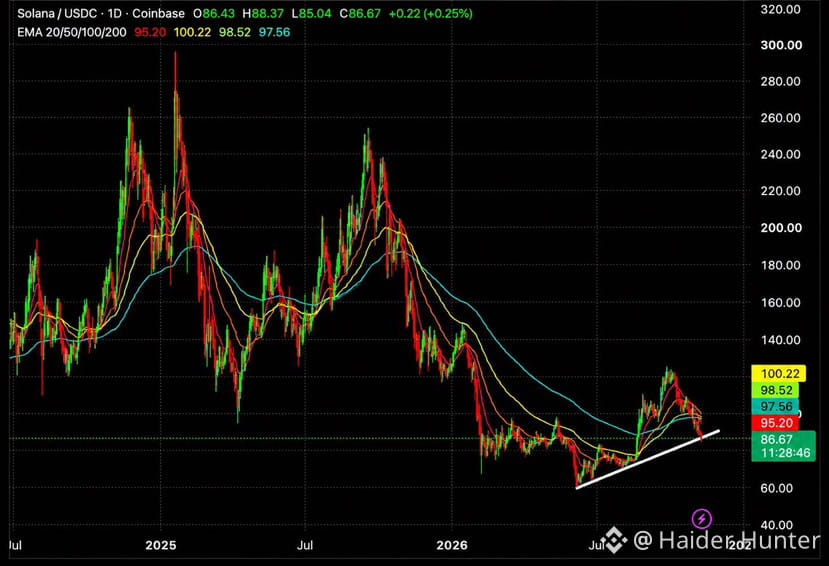
🚨 $SOL — BEARS ARE HUNTING FOR ANOTHER LEG DOWN! 📉
SOL remains trapped in a strong daily
downtrend, with lower highs and lower lows.
Price is struggling near $85, while sellers continue dominating market momentum.
A confirmed breakdown below $85 or a weak
bounce toward $90 could offer a short opportunity.
No bullish reversal is visible yet, keeping the bearish bias firmly intact.
KEY LEVELS
Resistance: $90.00
Support: $85.00
🚨 $SOL — BEARS ARE HUNTING FOR ANOTHER LEG DOWN! 📉
SOL remains trapped in a strong daily
downtrend, with lower highs and lower lows.
Price is struggling near $85, while sellers continue dominating market momentum.
A confirmed breakdown below $85 or a weak
bounce toward $90 could offer a short opportunity.
No bullish reversal is visible yet, keeping the bearish bias firmly intact.
KEY LEVELS
Resistance: $90.00
Support: $85.00
SOL remains trapped in a strong daily
downtrend, with lower highs and lower lows.
Price is struggling near $85, while sellers continue dominating market momentum.
A confirmed breakdown below $85 or a weak
bounce toward $90 could offer a short opportunity.
No bullish reversal is visible yet, keeping the bearish bias firmly intact.
KEY LEVELS
Resistance: $90.00
Support: $85.00
4
485
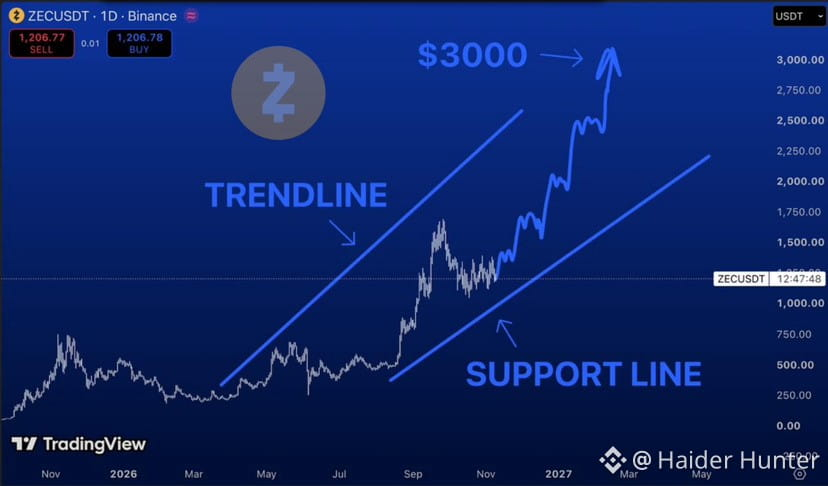
🚨$ZEC HOLDS BULLISH STRUCTURE IS $2,000 NEXT
After rallying toward $1,600, $ZEC has pulled back and is consolidating around $1,200 Higher lows and rising support suggest the broader bullish structure remains intact
A reclaim of $1,500–$1,600 could open the door toward $2,000 buyers need to confirm the breakout first!
KEY LEVELS:
Target 1: $1,600
Target 2: $2,000
🚨$ZEC HOLDS BULLISH STRUCTURE IS $2,000 NEXT
After rallying toward $1,600, $ZEC has pulled back and is consolidating around $1,200 Higher lows and rising support suggest the broader bullish structure remains intact
A reclaim of $1,500–$1,600 could open the door toward $2,000 buyers need to confirm the breakout first!
KEY LEVELS:
Target 1: $1,600
Target 2: $2,000
After rallying toward $1,600, $ZEC has pulled back and is consolidating around $1,200 Higher lows and rising support suggest the broader bullish structure remains intact
A reclaim of $1,500–$1,600 could open the door toward $2,000 buyers need to confirm the breakout first!
KEY LEVELS:
Target 1: $1,600
Target 2: $2,000
3
197
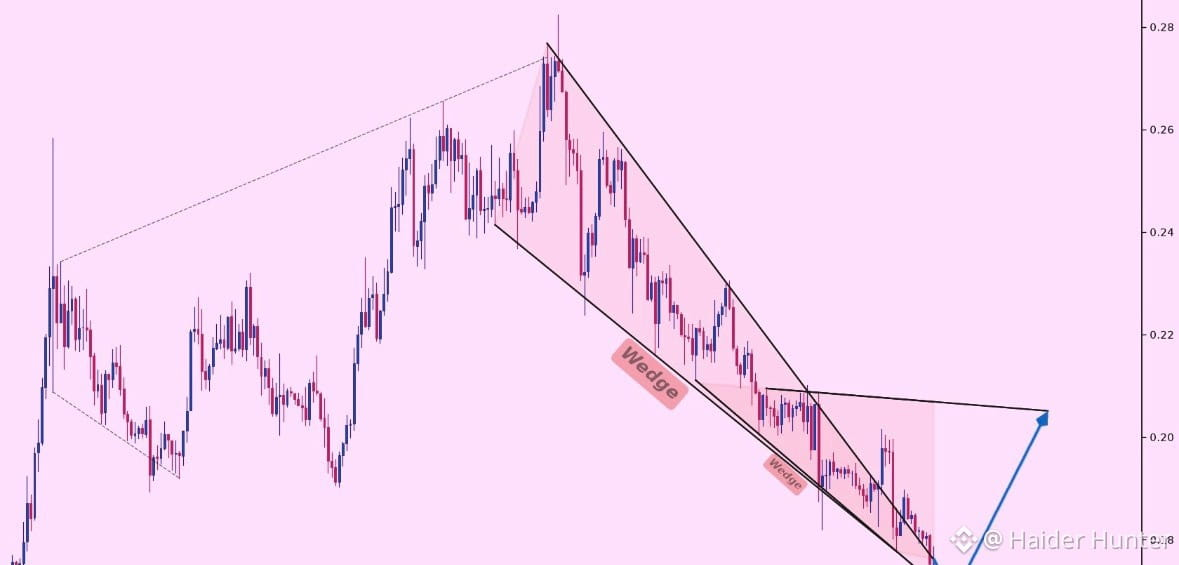
$ADA Which level could change the
story?
8H | Latest price: 0.1763. Support reference
0.17182903. Resistance reference 0.18087043.
A level earns attention through the reaction around it.
Watch whether price closes beyond the boundary and holds on retest or slips back inside. Those outcomes tell different stories.
The reaction matters more than the label attached to a line.
A wick alone does not establish acceptance. Wait for evidence before changing the view.
4 More analytics and education:
$ADA Which level could change the
story?
8H | Latest price: 0.1763. Support reference
0.17182903. Resistance reference 0.18087043.
A level earns attention through the reaction around it.
Watch whether price closes beyond the boundary and holds on retest or slips back inside. Those outcomes tell different stories.
The reaction matters more than the label attached to a line.
A wick alone does not establish acceptance. Wait for evidence before changing the view.
4 More analytics and education:
story?
8H | Latest price: 0.1763. Support reference
0.17182903. Resistance reference 0.18087043.
A level earns attention through the reaction around it.
Watch whether price closes beyond the boundary and holds on retest or slips back inside. Those outcomes tell different stories.
The reaction matters more than the label attached to a line.
A wick alone does not establish acceptance. Wait for evidence before changing the view.
4 More analytics and education:
5
7
1.1k
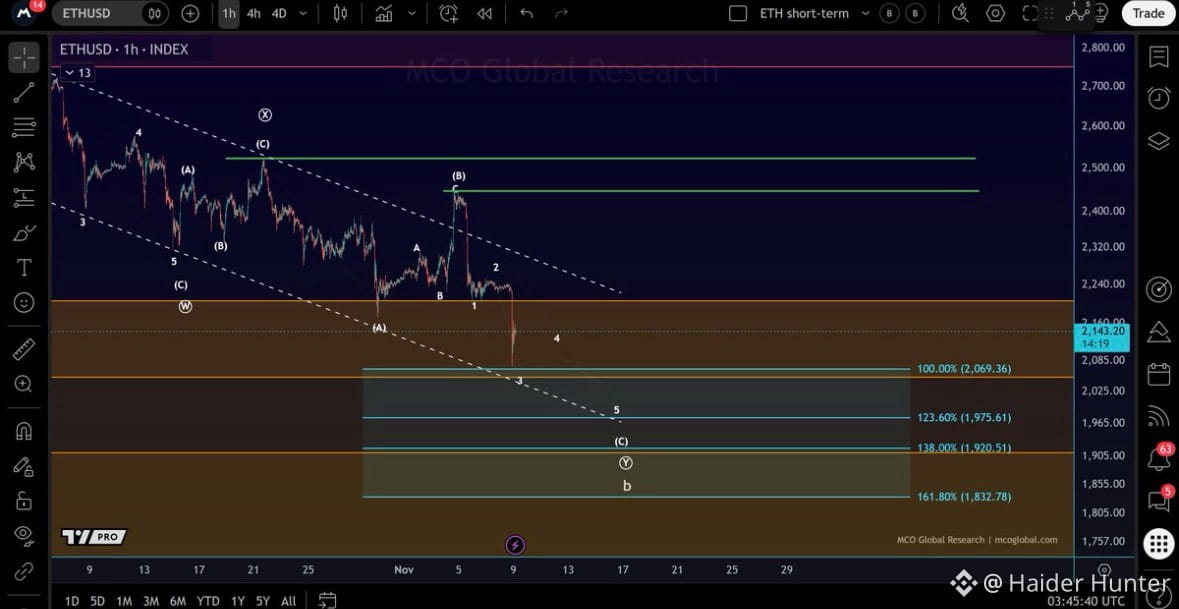
$ETH Wave 2 was unusually weak and wave 3 to the downside may now be underway.
Price has entered the blue target zone between $1,832 and $2,069.
The first indication that a bottom may be forming would be a breakout above the upper channel boundary or a move above the last swing high at $2,255.
$ETH Wave 2 was unusually weak and wave 3 to the downside may now be underway.
Price has entered the blue target zone between $1,832 and $2,069.
The first indication that a bottom may be forming would be a breakout above the upper channel boundary or a move above the last swing high at $2,255.
Price has entered the blue target zone between $1,832 and $2,069.
The first indication that a bottom may be forming would be a breakout above the upper channel boundary or a move above the last swing high at $2,255.
3
79
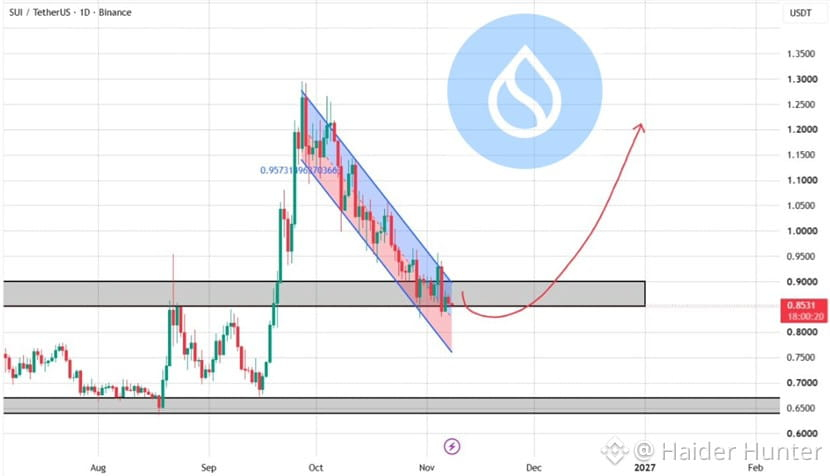
🔥 $SUI BREAKDOWN OR A CLEVER LIQUIDITY GRAB
Many traders saw a breakdown, but bulls may have used the drop below support to sweep liquidity. Price touched around $0.82 before quickly reclaiming the demand zone — an encouraging early signal for buyers.
The setup remains alive if bulls defend support break the descending channel, and push toward liquidity above confirmation is still needed!
KEY LEVELS:
Support: $0.83–$0.85
Upside Target Liquidity above the descending channel
🔥 $SUI BREAKDOWN OR A CLEVER LIQUIDITY GRAB
Many traders saw a breakdown, but bulls may have used the drop below support to sweep liquidity. Price touched around $0.82 before quickly reclaiming the demand zone — an encouraging early signal for buyers.
The setup remains alive if bulls defend support break the descending channel, and push toward liquidity above confirmation is still needed!
KEY LEVELS:
Support: $0.83–$0.85
Upside Target Liquidity above the descending channel
Many traders saw a breakdown, but bulls may have used the drop below support to sweep liquidity. Price touched around $0.82 before quickly reclaiming the demand zone — an encouraging early signal for buyers.
The setup remains alive if bulls defend support break the descending channel, and push toward liquidity above confirmation is still needed!
KEY LEVELS:
Support: $0.83–$0.85
Upside Target Liquidity above the descending channel
3
207
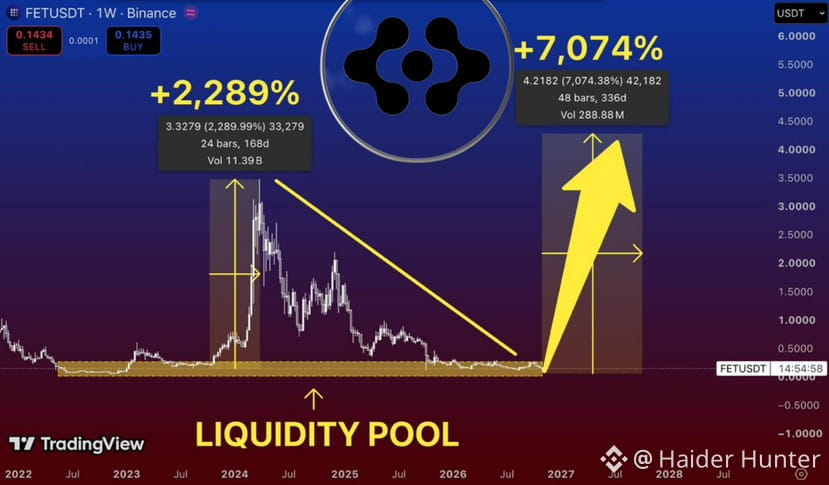
🚨 $FET AT $0.14 COULD HISTORY BE ABOUT TO REPEAT
$FET is back near the levels where it traded in 2023 before delivering an incredible 2,289% rally after nearly three years of giving back those gains price is once again testing a major long-term support zone
The weekly downtrend remains intact but price compression near multi year support makes this area worth watching can buyers repeat history? Confirmation will tell!
KEY LEVELS
Target 1: $0.30
Target 2: $0.60
🚨 $FET AT $0.14 COULD HISTORY BE ABOUT TO REPEAT
$FET is back near the levels where it traded in 2023 before delivering an incredible 2,289% rally after nearly three years of giving back those gains price is once again testing a major long-term support zone
The weekly downtrend remains intact but price compression near multi year support makes this area worth watching can buyers repeat history? Confirmation will tell!
KEY LEVELS
Target 1: $0.30
Target 2: $0.60
$FET is back near the levels where it traded in 2023 before delivering an incredible 2,289% rally after nearly three years of giving back those gains price is once again testing a major long-term support zone
The weekly downtrend remains intact but price compression near multi year support makes this area worth watching can buyers repeat history? Confirmation will tell!
KEY LEVELS
Target 1: $0.30
Target 2: $0.60
2
4
1.2k
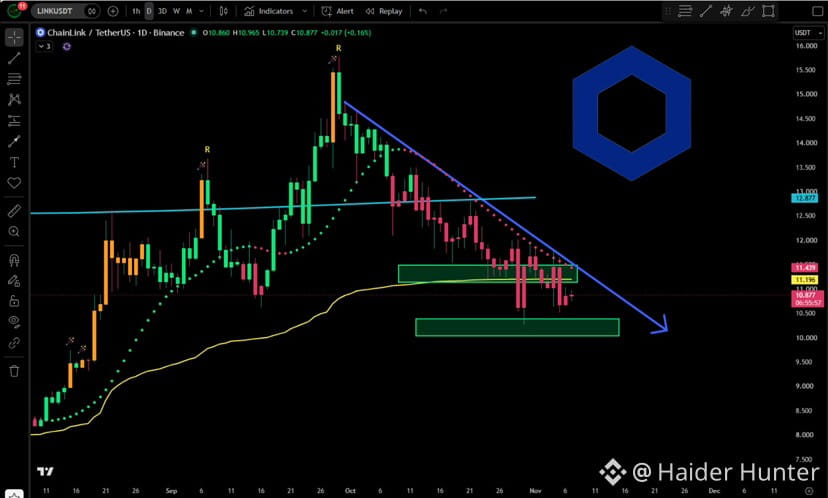
🚨 $LINK STILL BEARISH HAVE WE FOUND THE BOTTOM YET
Chainlink remains in a daily downtrend and the bearish structure is still intact until buyers prove otherwise all four downside targets have been hit putting the focus on where selling pressure might finally slow down
A strong support reaction and a confirmed trend reversal are needed before calling a bottom until then caution remains key.
🚨 $LINK STILL BEARISH HAVE WE FOUND THE BOTTOM YET
Chainlink remains in a daily downtrend and the bearish structure is still intact until buyers prove otherwise all four downside targets have been hit putting the focus on where selling pressure might finally slow down
A strong support reaction and a confirmed trend reversal are needed before calling a bottom until then caution remains key.
Chainlink remains in a daily downtrend and the bearish structure is still intact until buyers prove otherwise all four downside targets have been hit putting the focus on where selling pressure might finally slow down
A strong support reaction and a confirmed trend reversal are needed before calling a bottom until then caution remains key.
3
361
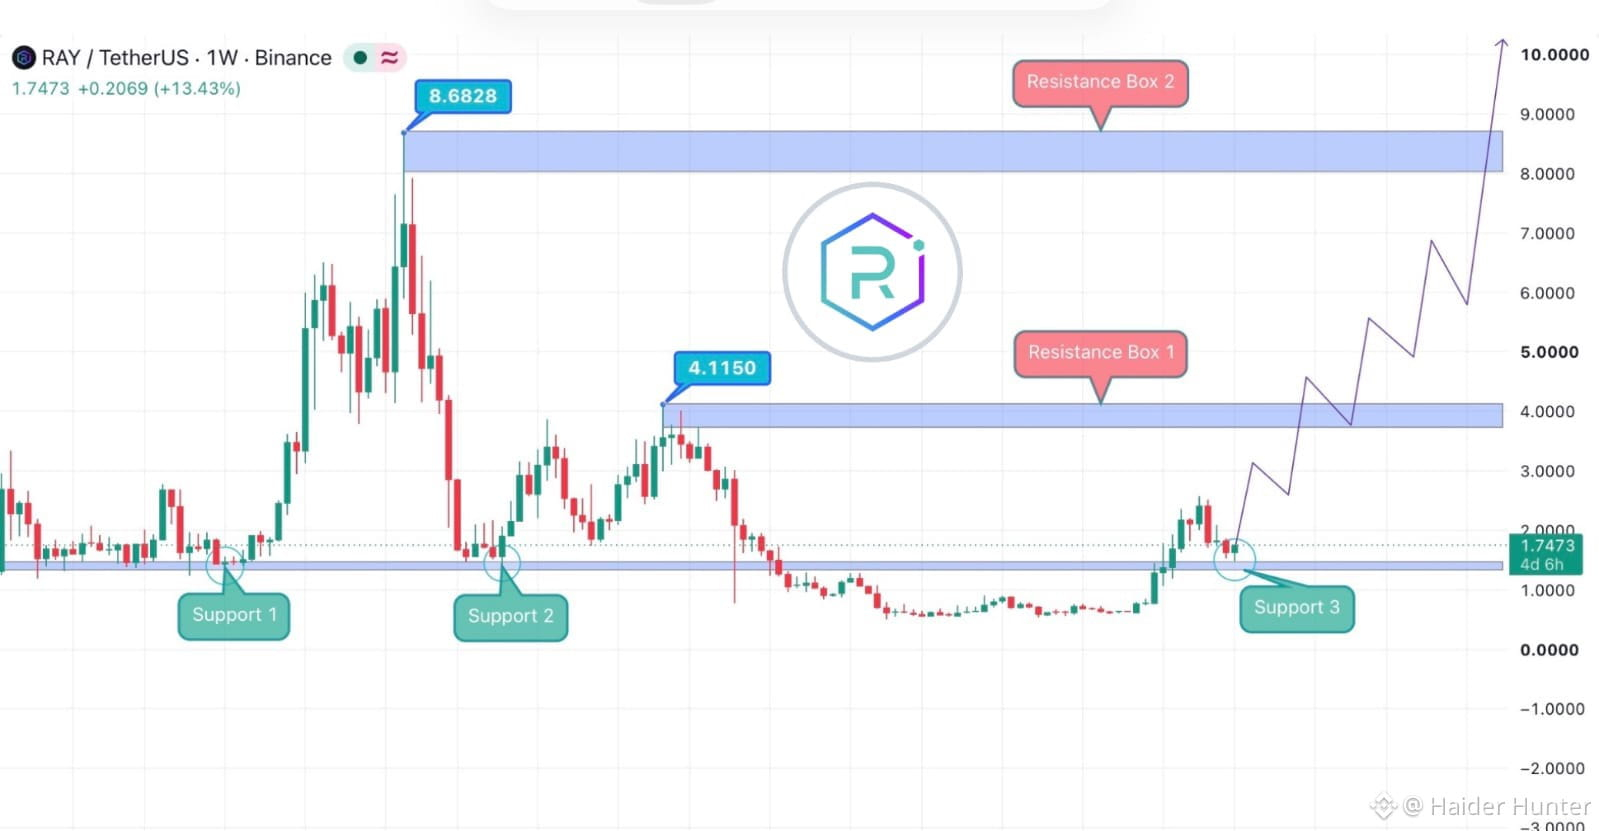
🚨 $RAY SHOWS STRENGTH COULD DOUBLE DIGITS BE NEXT
$RAY reportedly delivered a 335% gain in the premium group just days ago now despite heavy market pressure the token is showing relative strength while many other altcoins struggle to hold their ground
Could another major move be building Double digit prices remain an ambitious scenario not a guarantee watch for confirmation before chasing momentum
🚨 $RAY SHOWS STRENGTH COULD DOUBLE DIGITS BE NEXT
$RAY reportedly delivered a 335% gain in the premium group just days ago now despite heavy market pressure the token is showing relative strength while many other altcoins struggle to hold their ground
Could another major move be building Double digit prices remain an ambitious scenario not a guarantee watch for confirmation before chasing momentum
$RAY reportedly delivered a 335% gain in the premium group just days ago now despite heavy market pressure the token is showing relative strength while many other altcoins struggle to hold their ground
Could another major move be building Double digit prices remain an ambitious scenario not a guarantee watch for confirmation before chasing momentum
1
3
148
·
--
ສັນຍານກະທິງ
🔥 $LUNC IS THIS A BEAR MARKET OR JUST A RESET
Crypto markets are under pressure, and uncertainty is spreading but every major dip puts investors to the test. Could this correction become an opportunity for a stronger recovery
Stay patient manage risk and watch for signs of a trend reversal
KEY LEVELS
Target 1: $0.0001
Target 2: $0.000
🔥 $LUNC IS THIS A BEAR MARKET OR JUST A RESET
Crypto markets are under pressure, and uncertainty is spreading but every major dip puts investors to the test. Could this correction become an opportunity for a stronger recovery
Stay patient manage risk and watch for signs of a trend reversal
KEY LEVELS
Target 1: $0.0001
Target 2: $0.000
Crypto markets are under pressure, and uncertainty is spreading but every major dip puts investors to the test. Could this correction become an opportunity for a stronger recovery
Stay patient manage risk and watch for signs of a trend reversal
KEY LEVELS
Target 1: $0.0001
Target 2: $0.000

13
1
25
3.7k
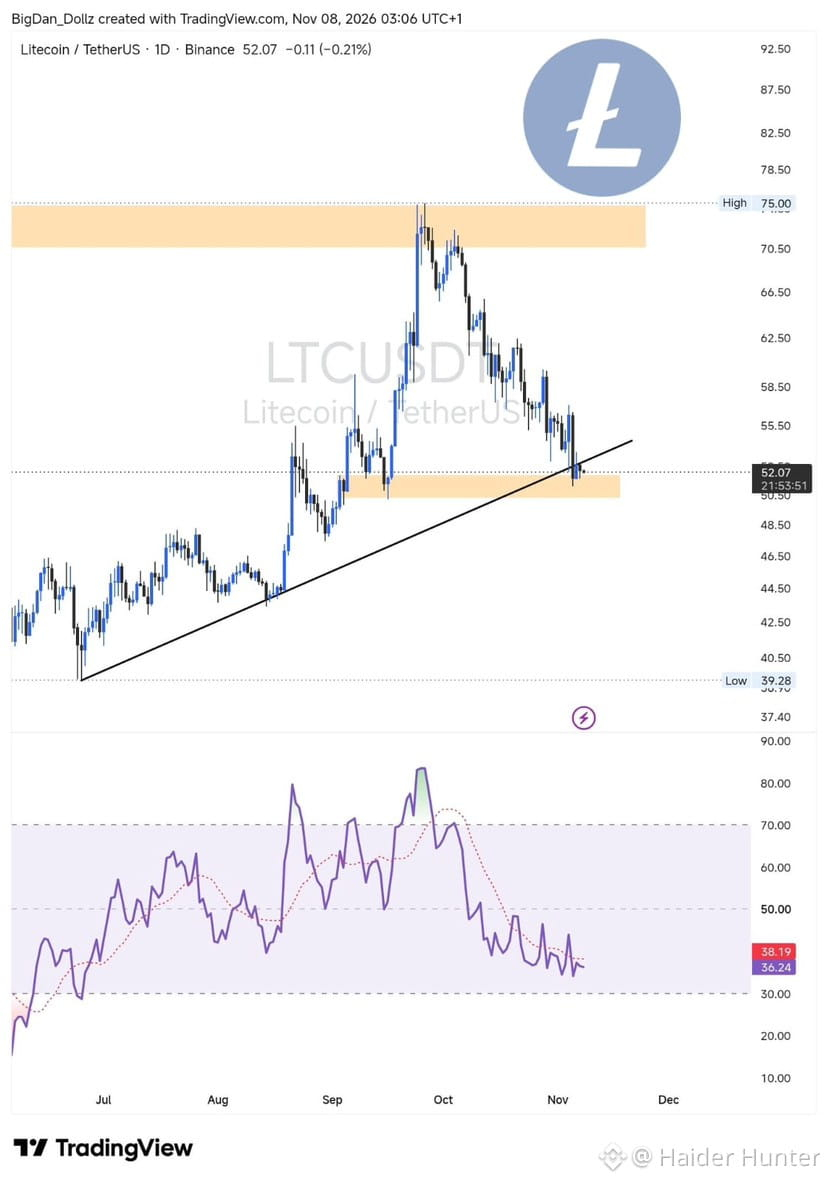
🚨 $LTC SUPPORT HOLDS AS BULLS WAIT FOR A BREAKOUT!
$LTC support is still holding and buyers haven't given up yet RSI is sitting in oversold territory suggesting selling pressure may be stretched But a reversal needs confirmation
A strong close above the trendline could shift momentum in favor of the bulls losing support however could open the door to further downside stay patient and wait for confirmation
🚨 $LTC SUPPORT HOLDS AS BULLS WAIT FOR A BREAKOUT!
$LTC support is still holding and buyers haven't given up yet RSI is sitting in oversold territory suggesting selling pressure may be stretched But a reversal needs confirmation
A strong close above the trendline could shift momentum in favor of the bulls losing support however could open the door to further downside stay patient and wait for confirmation
$LTC support is still holding and buyers haven't given up yet RSI is sitting in oversold territory suggesting selling pressure may be stretched But a reversal needs confirmation
A strong close above the trendline could shift momentum in favor of the bulls losing support however could open the door to further downside stay patient and wait for confirmation
5
3
975
·
--
ສັນຍານກະທິງ
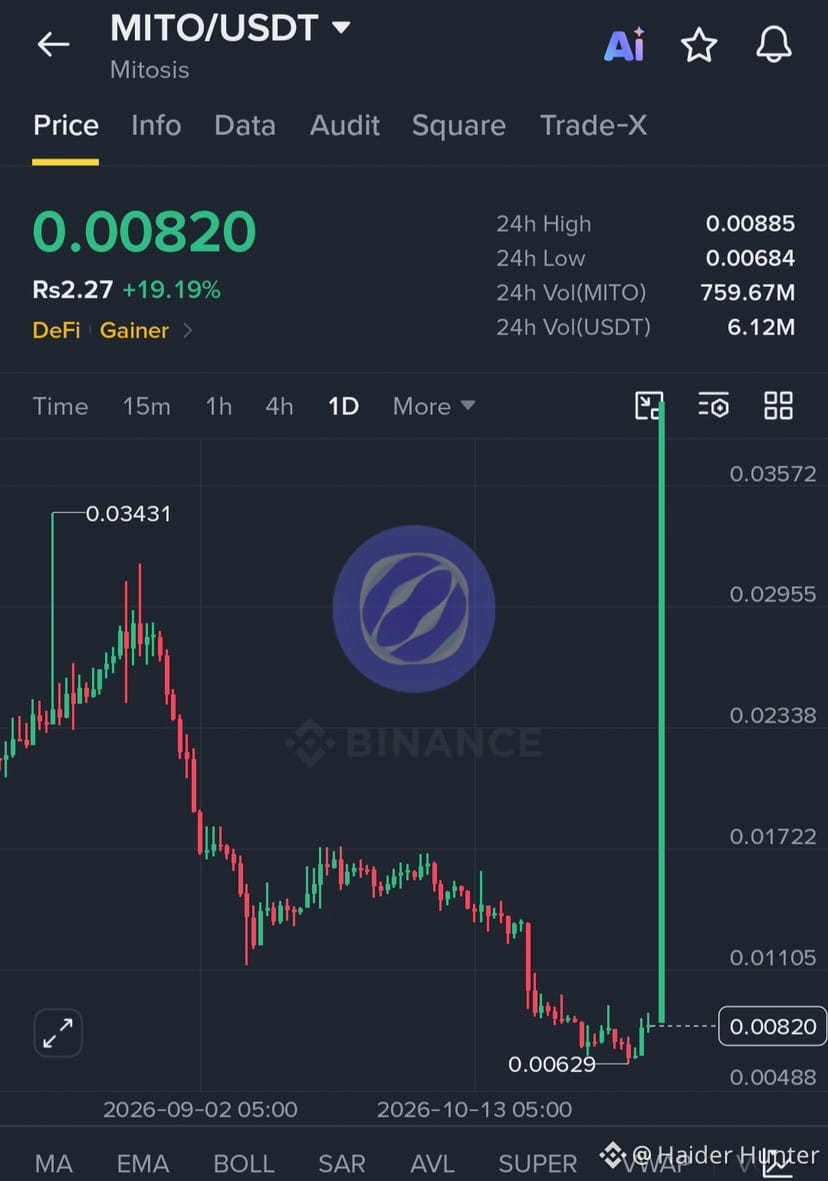
🚀🔥 $MITO ISN'T JUST THE RALLY!
$MITO has bounced strongly from its November lows but the price history tells a bigger story after trading near $0.065 at the end of 2025 and reaching around $0.082 in May 2026 it suffered a roughly 90% decline to $0.0065 before recovering to the $0.008–$0.009 range
The real question is whether ecosystem growth can catch up with market activity a strong bounce is interesting but sustainable recovery needs more than price momentum
🚀🔥 $MITO ISN'T JUST THE RALLY!
$MITO has bounced strongly from its November lows but the price history tells a bigger story after trading near $0.065 at the end of 2025 and reaching around $0.082 in May 2026 it suffered a roughly 90% decline to $0.0065 before recovering to the $0.008–$0.009 range
The real question is whether ecosystem growth can catch up with market activity a strong bounce is interesting but sustainable recovery needs more than price momentum
$MITO has bounced strongly from its November lows but the price history tells a bigger story after trading near $0.065 at the end of 2025 and reaching around $0.082 in May 2026 it suffered a roughly 90% decline to $0.0065 before recovering to the $0.008–$0.009 range
The real question is whether ecosystem growth can catch up with market activity a strong bounce is interesting but sustainable recovery needs more than price momentum
2
4
1.1k
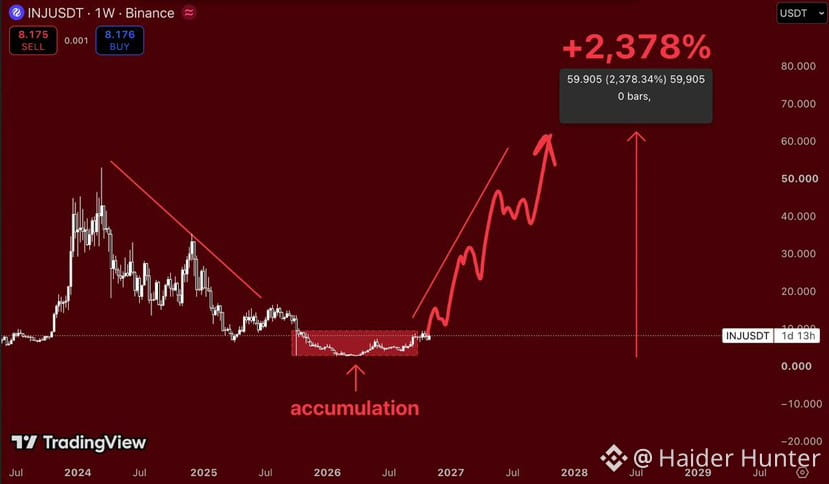
🔥 $INJ AT $8 COULD THIS BE THE START OF A MASSIVE COMEBACK
Once trading above $50 $INJ has spent the past two years forming lower highs and frustrating dip buyers but its weekly chart is showing a potential shift price is holding an accumulation range and challenging its upper boundary.
A clean breakout above $10 could be the first major sign of strength
Targets: $20 → $35 → $50
🔥 $INJ AT $8 COULD THIS BE THE START OF A MASSIVE COMEBACK
Once trading above $50 $INJ has spent the past two years forming lower highs and frustrating dip buyers but its weekly chart is showing a potential shift price is holding an accumulation range and challenging its upper boundary.
A clean breakout above $10 could be the first major sign of strength
Targets: $20 → $35 → $50
Once trading above $50 $INJ has spent the past two years forming lower highs and frustrating dip buyers but its weekly chart is showing a potential shift price is holding an accumulation range and challenging its upper boundary.
A clean breakout above $10 could be the first major sign of strength
Targets: $20 → $35 → $50
2
4
426
·
--
ສັນຍານກະທິງ
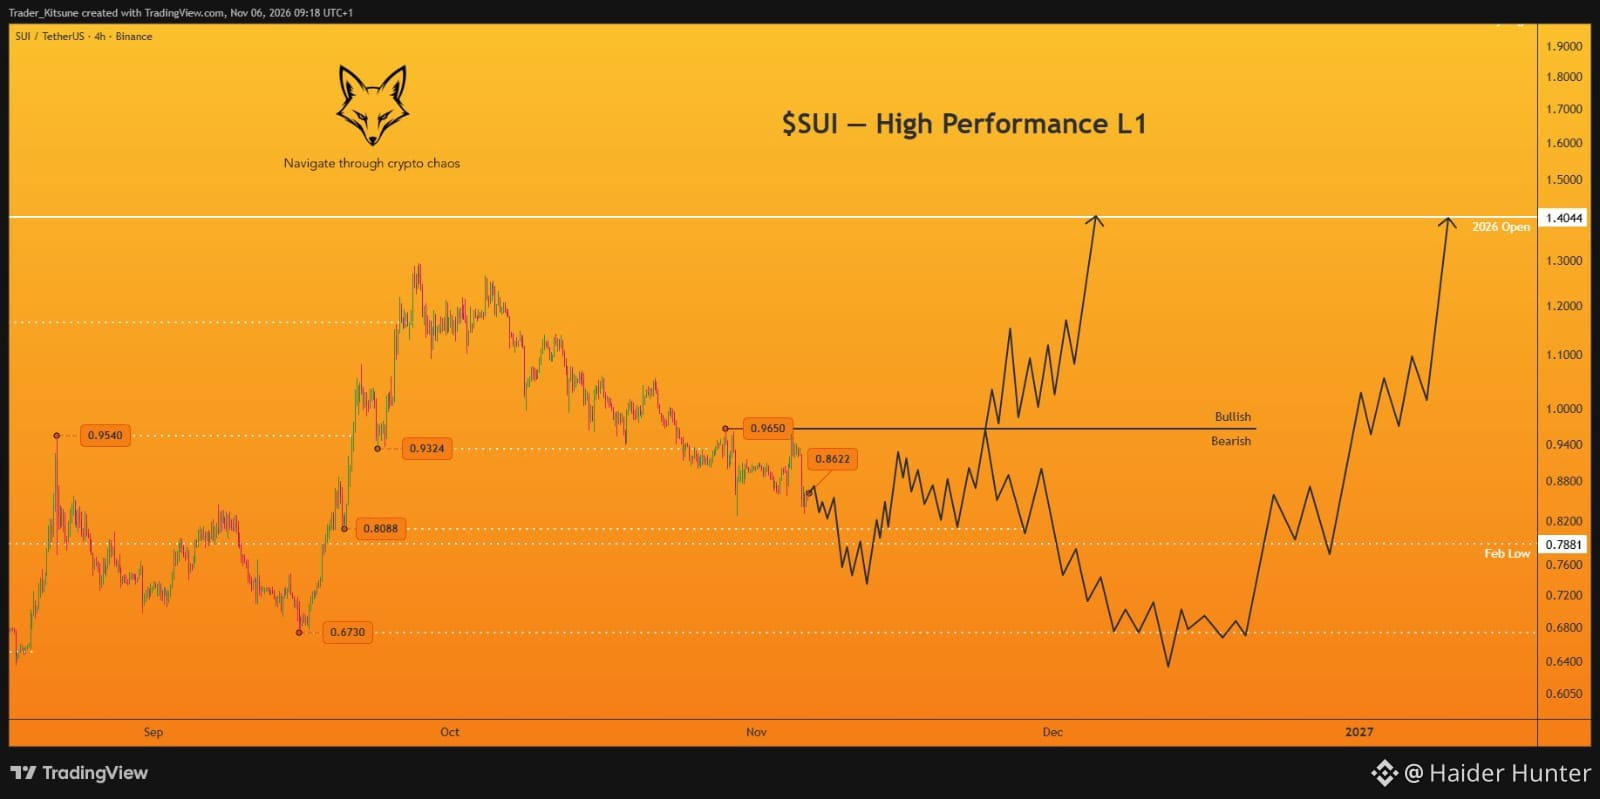
🚨 $SUI TWO POSSIBLE PATHS BUT $1.40 REMAINS THE BIG TARGET!
The $0.93 liquidity sweep happened but buyers failed to follow through. After rejection at $0.965 $SUI has slipped toward $0.86 another dip below $0.809 and a sweep of the February low at $0.788 could come before a retest of $0.965.
Bullish Scenario: Break $0.965, consolidate around $1.00–$1.15 then target $1.4
🚨 $SUI TWO POSSIBLE PATHS BUT $1.40 REMAINS THE BIG TARGET!
The $0.93 liquidity sweep happened but buyers failed to follow through. After rejection at $0.965 $SUI has slipped toward $0.86 another dip below $0.809 and a sweep of the February low at $0.788 could come before a retest of $0.965.
Bullish Scenario: Break $0.965, consolidate around $1.00–$1.15 then target $1.4
The $0.93 liquidity sweep happened but buyers failed to follow through. After rejection at $0.965 $SUI has slipped toward $0.86 another dip below $0.809 and a sweep of the February low at $0.788 could come before a retest of $0.965.
Bullish Scenario: Break $0.965, consolidate around $1.00–$1.15 then target $1.4
4
966
·
--
ສັນຍານກະທິງ
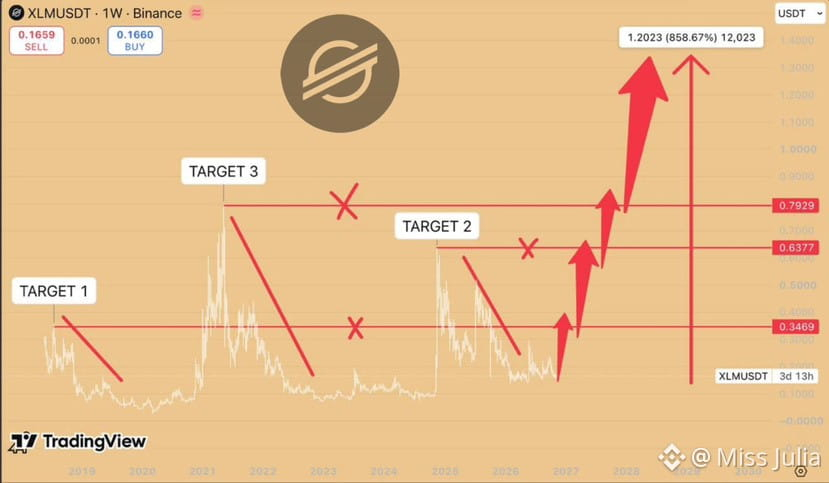
🚨$XLM AT $0.16 THE NEXT MASSIVE COMEBACK
For nearly a decade $XLM has followed a familiar cycle explosive rallies brutal corrections and long periods of silence now around $0.16, the chart is worth watching closely.
Key Levels: $0.35 → $0.64 → $0.79
🚨$XLM AT $0.16 THE NEXT MASSIVE COMEBACK
For nearly a decade $XLM has followed a familiar cycle explosive rallies brutal corrections and long periods of silence now around $0.16, the chart is worth watching closely.
Key Levels: $0.35 → $0.64 → $0.79
For nearly a decade $XLM has followed a familiar cycle explosive rallies brutal corrections and long periods of silence now around $0.16, the chart is worth watching closely.
Key Levels: $0.35 → $0.64 → $0.79
2
802
ເຂົ້າສູ່ລະບົບເພື່ອສຳຫຼວດເນື້ອຫາເພີ່ມເຕີມ
ເຂົ້າຮ່ວມກຸ່ມຜູ້ໃຊ້ຄຣິບໂຕທົ່ວໂລກໃນ Binance Square.
⚡️ ໄດ້ຮັບຂໍ້ມູນຫຼ້າສຸດ ແລະ ທີ່ມີປະໂຫຍດກ່ຽວກັບຄຣິບໂຕ.
💬 ໄດ້ຮັບຄວາມໄວ້ວາງໃຈຈາກຕະຫຼາດແລກປ່ຽນຄຣິບໂຕທີ່ໃຫຍ່ທີ່ສຸດໃນໂລກ.
👍 ຄົ້ນຫາຂໍ້ມູນເຊີງເລິກທີ່ແທ້ຈາກນັກສ້າງທີ່ໄດ້ຮັບການຢືນຢັນ.
ອີເມວ / ເບີໂທລະສັບ
ຫົວຂໍ້ທີ່ກໍາລັງນິຍົມ
NvidiaInvestigatesAfterHuang’sAffairApology
211,415 ຄັ້ງທີ່ເບິ່ງ
1,717 ກຳລັງສົນທະນາ
Nvidia Board Opens Probe Into Whether Huang Was Target of Foreign Intelligence Effort
Binance News
·21 ຖືກໃຈ
·55.1k ຄັ້ງທີ່ເບິ່ງ
CPITestsDecemberRateOutlook
660,926 ຄັ້ງທີ່ເບິ່ງ
2,804 ກຳລັງສົນທະນາ
AnthropicRejectsIPODelayValuationinQuestion
39,492 ຄັ້ງທີ່ເບິ່ງ
410 ກຳລັງສົນທະນາ