DAILY SIGNAL — SOL/USDT
Date: 22 Nov 2026
Timeframe: 1m
Intraday Bias: Consolidation near mid-Fibonacci range → decision zone between 70.71–70.96
📊 MARKET BIAS
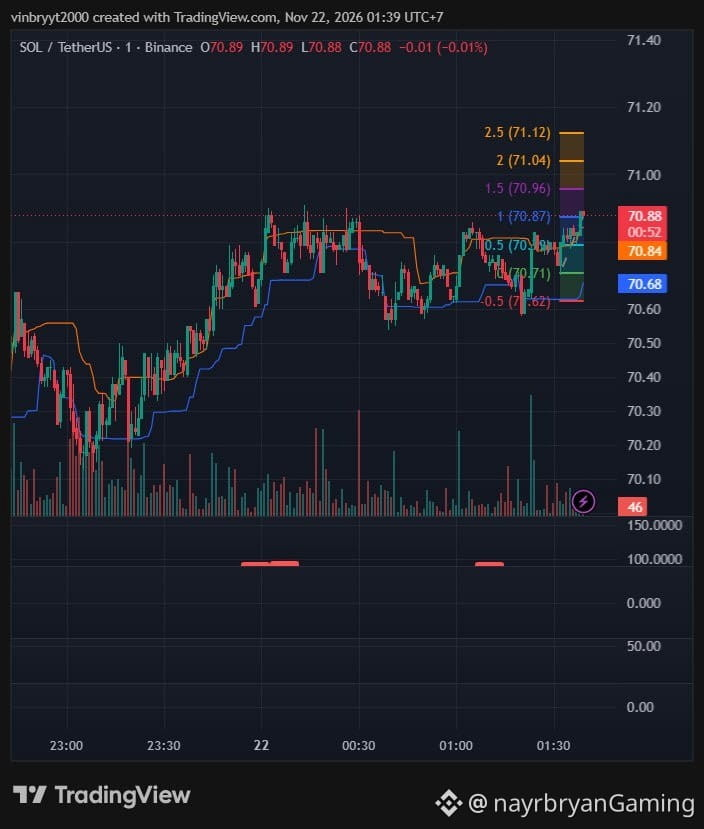
SOL is trading around 70.88 after a period of sideways consolidation.
Price is currently sitting near the 1.0 Fibonacci level (70.87) and just above the blue short-term guide. The orange line is acting as dynamic resistance overhead. The structure shows a series of higher lows from the earlier session low, but upside progress remains capped near 70.96–71.04.
As long as price holds above the 0.5 Fib at 70.71 and the blue line, the short-term bias stays neutral-to-bullish. A clean break above 70.96 would open the higher Fibonacci targets. A drop below 70.71 would shift focus back to the 0 level at 70.62.
🔹 KEY LEVELS FROM CHART
Current Price: 70.88
Immediate Resistance: 70.96 – 71.04 (1.5 / 2.0 Fib)
Major Resistance: 71.12 (2.5 Fib)
Key Support: 70.71 (0.5 Fib) → 70.62 (0 Fib)
🎯 FIBONACCI LEVELS
Potential Upside Levels:
TP1 → 70.96 (1.5 Fib)
TP2 → 71.04 (2.0 Fib)
TP3 → 71.12 (2.5 Fib)
Downside Reference:
70.71 → 70.62
These are chart-derived reference levels, not guaranteed targets.
📈 TECHNICAL BREAKDOWN
1. Price Structure
Price is coiling between the 0.5 and 1.5 Fibonacci levels after an earlier recovery. Higher lows remain intact for now.
2. Dynamic Levels
The blue line is providing short-term support, while the orange line is capping upside attempts.
🧠 QUICK INSIGHT
“Mid-range consolidations are decision zones — the break usually matters more than the chop.”
⚠️ DISCLAIMER
This is personal chart analysis for educational purposes only, not financial advice.
Always DYOR / DYODD, manage risk responsibly, and wait for confirmation before making trading decisions.
— @nayrbryanGaming
#SOL #SOLUSDT #Binance #CryptoTrading #TechnicalAnalysis #PriceAction #Fibonacci #TradingView #DYOR #NFA #NoFOMO
Date: 22 Nov 2026
Timeframe: 1m
Intraday Bias: Consolidation near mid-Fibonacci range → decision zone between 70.71–70.96
📊 MARKET BIAS
SOL is trading around 70.88 after a period of sideways consolidation.
Price is currently sitting near the 1.0 Fibonacci level (70.87) and just above the blue short-term guide. The orange line is acting as dynamic resistance overhead. The structure shows a series of higher lows from the earlier session low, but upside progress remains capped near 70.96–71.04.
As long as price holds above the 0.5 Fib at 70.71 and the blue line, the short-term bias stays neutral-to-bullish. A clean break above 70.96 would open the higher Fibonacci targets. A drop below 70.71 would shift focus back to the 0 level at 70.62.
🔹 KEY LEVELS FROM CHART
Current Price: 70.88
Immediate Resistance: 70.96 – 71.04 (1.5 / 2.0 Fib)
Major Resistance: 71.12 (2.5 Fib)
Key Support: 70.71 (0.5 Fib) → 70.62 (0 Fib)
🎯 FIBONACCI LEVELS
Potential Upside Levels:
TP1 → 70.96 (1.5 Fib)
TP2 → 71.04 (2.0 Fib)
TP3 → 71.12 (2.5 Fib)
Downside Reference:
70.71 → 70.62
These are chart-derived reference levels, not guaranteed targets.
📈 TECHNICAL BREAKDOWN
1. Price Structure
Price is coiling between the 0.5 and 1.5 Fibonacci levels after an earlier recovery. Higher lows remain intact for now.
2. Dynamic Levels
The blue line is providing short-term support, while the orange line is capping upside attempts.
🧠 QUICK INSIGHT
“Mid-range consolidations are decision zones — the break usually matters more than the chop.”
⚠️ DISCLAIMER
This is personal chart analysis for educational purposes only, not financial advice.
Always DYOR / DYODD, manage risk responsibly, and wait for confirmation before making trading decisions.
— @nayrbryanGaming
#SOL #SOLUSDT #Binance #CryptoTrading #TechnicalAnalysis #PriceAction #Fibonacci #TradingView #DYOR #NFA #NoFOMO