


Bitcoin looks damaged, but the sell-off has not yet answered the most important question: is this forced liquidation near a short-term exhaustion point, or a repricing with more room to run?
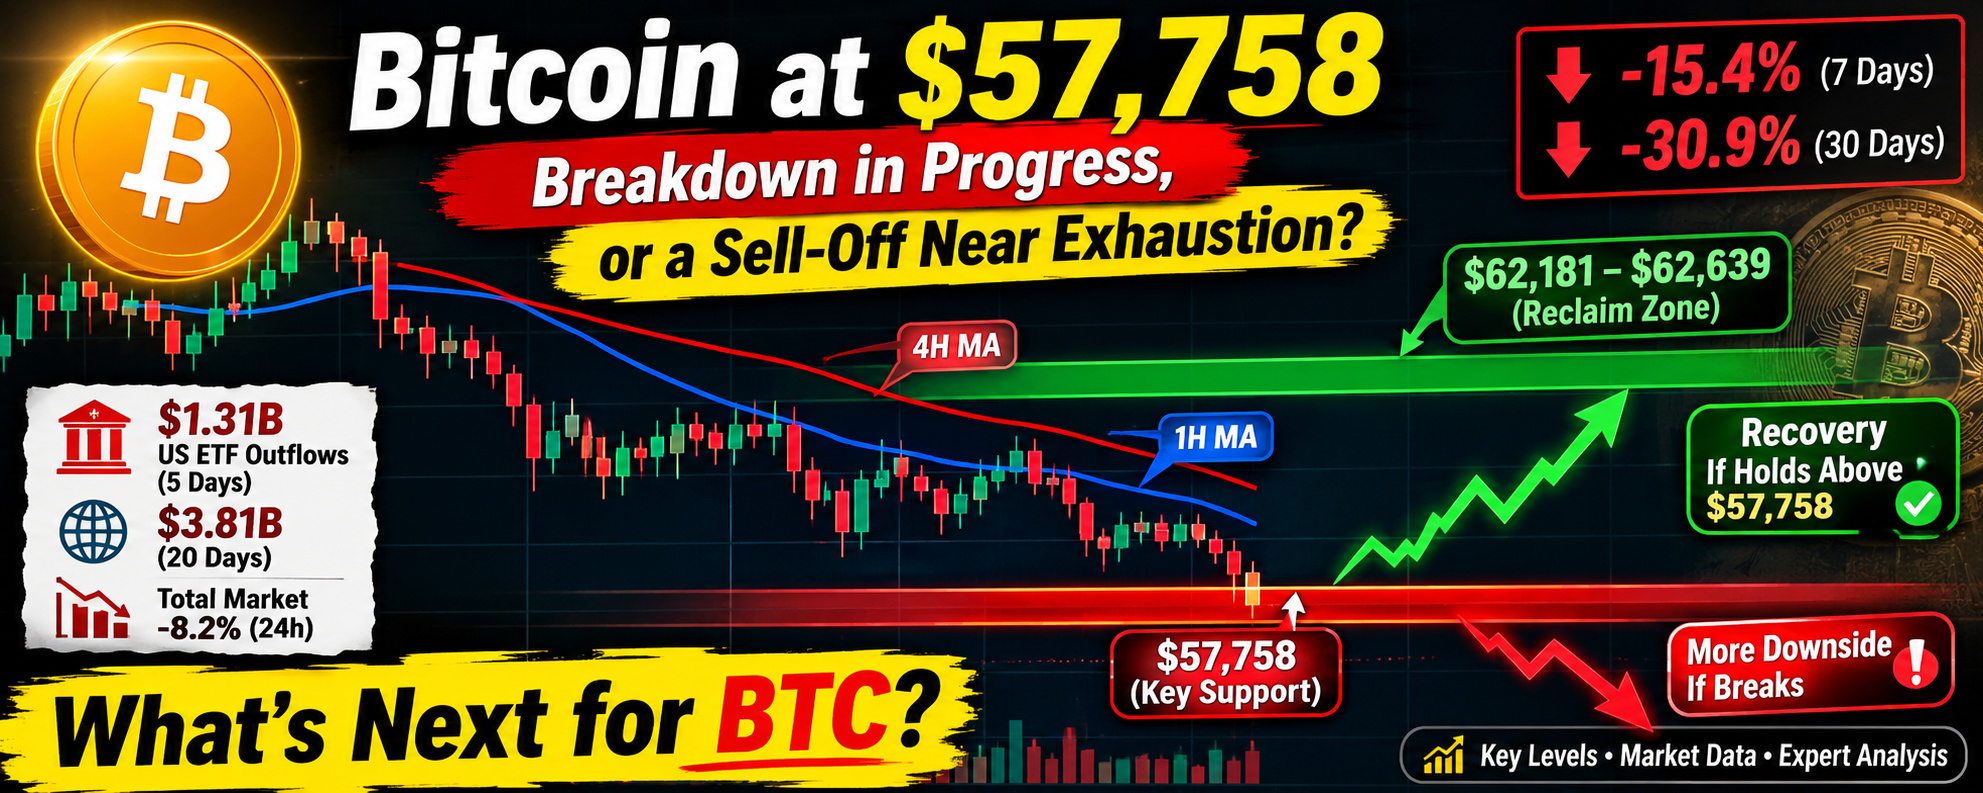
The verified picture is heavy. BTC is around $58,613, down 15.4% over 7 days and 30.9% over 30 days. It fell from the low-$62,000s to $57,758 before a small hourly recovery. That bounce is not much evidence of demand yet: the latest completed hourly candle closed at $58,559, still below the previous close at $59,474. Price remains below the 1-hour and 4-hour moving averages, and the daily trend is decisively down.
The nearby test is $57,758. It is the recent low and the clearest immediate support reference, not a guaranteed floor. A brief dip below it followed by a quick reclaim would look different from a sustained break with continued selling. The data available does not show where liquidation orders are clustered, so it would be a mistake to treat that level as a known liquidation “magnet.” Above, $62,181–$62,639 is the first meaningful reclaim zone from recent price action. A move back through it and a hold would improve the short-term picture; it would not, by itself, reverse the larger downtrend.
What seems to be driving the pressure? The clearest confirmed demand headwind is US spot ETF redemptions: $1.31B over 5 days, including $582M on November 19, and $3.81B over 20 days. That coincides with the price decline, but the figures do not tell us whether ETF selling led the move or followed it. The broader market is also weak, with total crypto market value down 8.2% in 24 hours. Recent reporting points to institutional risk aversion and a possible rotation toward AI investments, but that explanation is not independently demonstrated by the trading data.
There are counterweights. Advisers and wealth platforms reportedly held record amounts of Bitcoin ETPs in Q3, and one report says institutions added 49,229 BTC during that quarter. Those are longer-horizon holdings, though—not evidence of fresh buying into this week’s decline. A report of public companies selling Bitcoin is also concerning, but it aggregates sales across 2026 and does not establish that those sales caused the current move. Likewise, the reported 966 BTC transfer from Kraken to Abraxas does not prove an exchange deposit or a sale.
Derivatives look more like a warning than a clear contrarian signal. Funding across major perpetual markets is almost flat, at a weighted −0.001% per 8 hours. Shorts are only marginally paying longs. OKX open interest is down 15.5% over 7 days, which suggests leverage has eased on that venue; it cannot establish a market-wide flush. OKX accounts are net long by count, but account ratios do not reveal position size or prove those longs are vulnerable. Crypto-wide liquidations were reported at roughly $1.5B over 24 hours, but BTC’s share, the long/short split, and the price levels involved are unknown. We have no reliable spot CVD or order-book imbalance to say whether aggressive buyers are absorbing supply.
My reading is that the bearish case still has the stronger evidence: a lower low, weak short-term reclaim, persistent ETF outflows, and a broad risk-off backdrop. But oversold readings—daily RSI is 17.1—and extreme fear leave real room for a sharp relief bounce. Oversold is a condition, not a turning signal. The bullish case would gain credibility if BTC holds above $57,758, reclaims $62,181–$62,639, and spot demand and ETF flows improve. A sustained loss of the low, especially alongside continued outflows, would argue that sellers still control the tape.
The unresolved issue is whether selling is being absorbed or merely pausing. Do ETF redemptions continue? Does open interest decline across venues, or start rising as price falls? And can buyers defend the low with actual spot demand rather than a temporary short-covering bounce? Those answers matter more than any single oversold reading.
