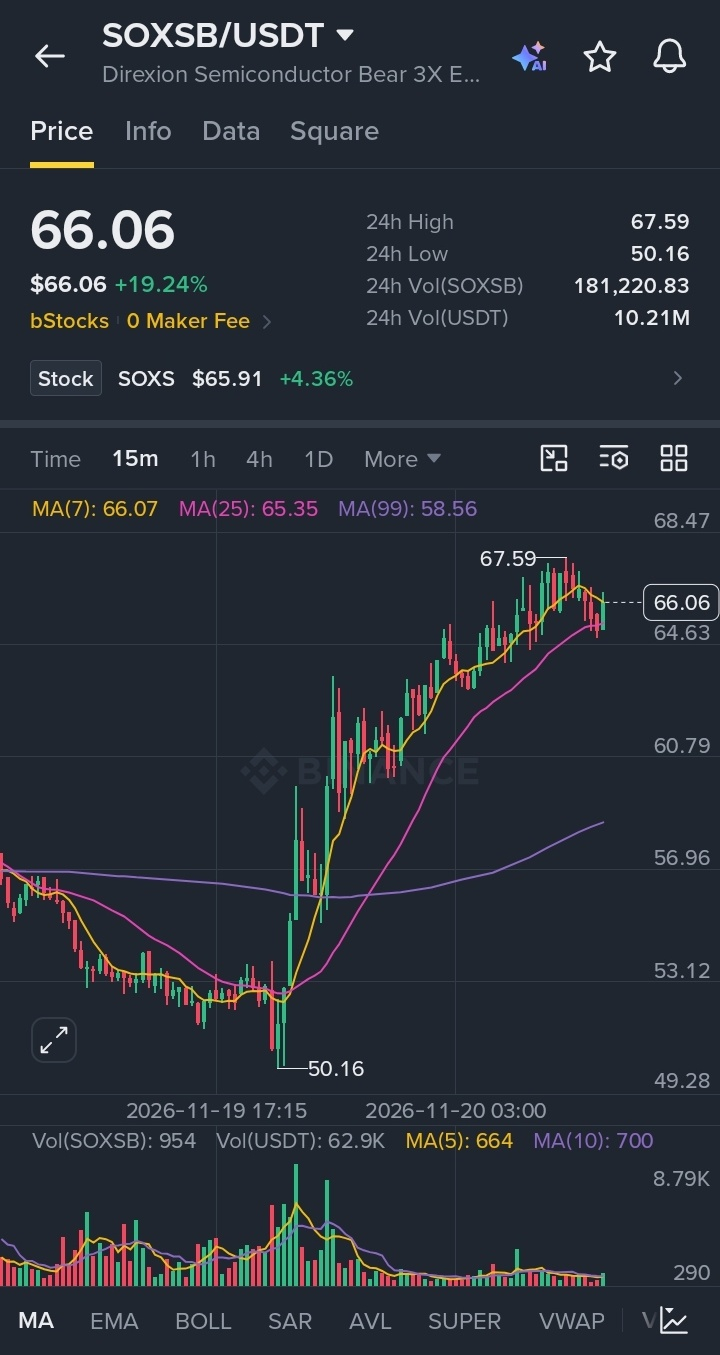

$SOXSB Coin – Latest Analysis (20 November 2026)
Market overview
Indicator Latest data
Price $52.92
Market cap $2.39M
24h volume $27.86M
7-day change +9.7%
30-day change +9.1%
ATH $85.22
Distance from ATH -37.9%
Technical analysis
Short term: Mixed, with recent selling pressure.
7-day trend: Bullish overall.
Momentum: Needs confirmation from sustained buying.
Risk: Very high because of 3x daily leveraged exposure.
Important price levels
These are watch levels, not confirmed technical support or resistance.
Price Significance
$50 Psychological support
$53 Current price area
$60 Potential resistance
$65 Stronger resistance area
$75–85 Higher recovery zone
prediction
Bullish scenario
If semiconductor stocks weaken, SOXSB could move towards $60–65.
Bearish scenario
If semiconductor stocks rally, SOXSB could fall towards $50 or lower.
Important: This is not an ordinary cryptocurrency. Daily leveraged ETF exposure can lose value through compounding and volatility, even when the underlying market eventually moves in your expected direction.
#LedgerProbesTamperedWalletsInBerlinAndDubai #13FInstitutionsBitcoinSpotETPHoldingsHitRecord