
🚨 ANTB/USDT — Bearish Pressure | Rebound Attempt
LONG SETUP 🟢 (Counter-Trend / High Risk)
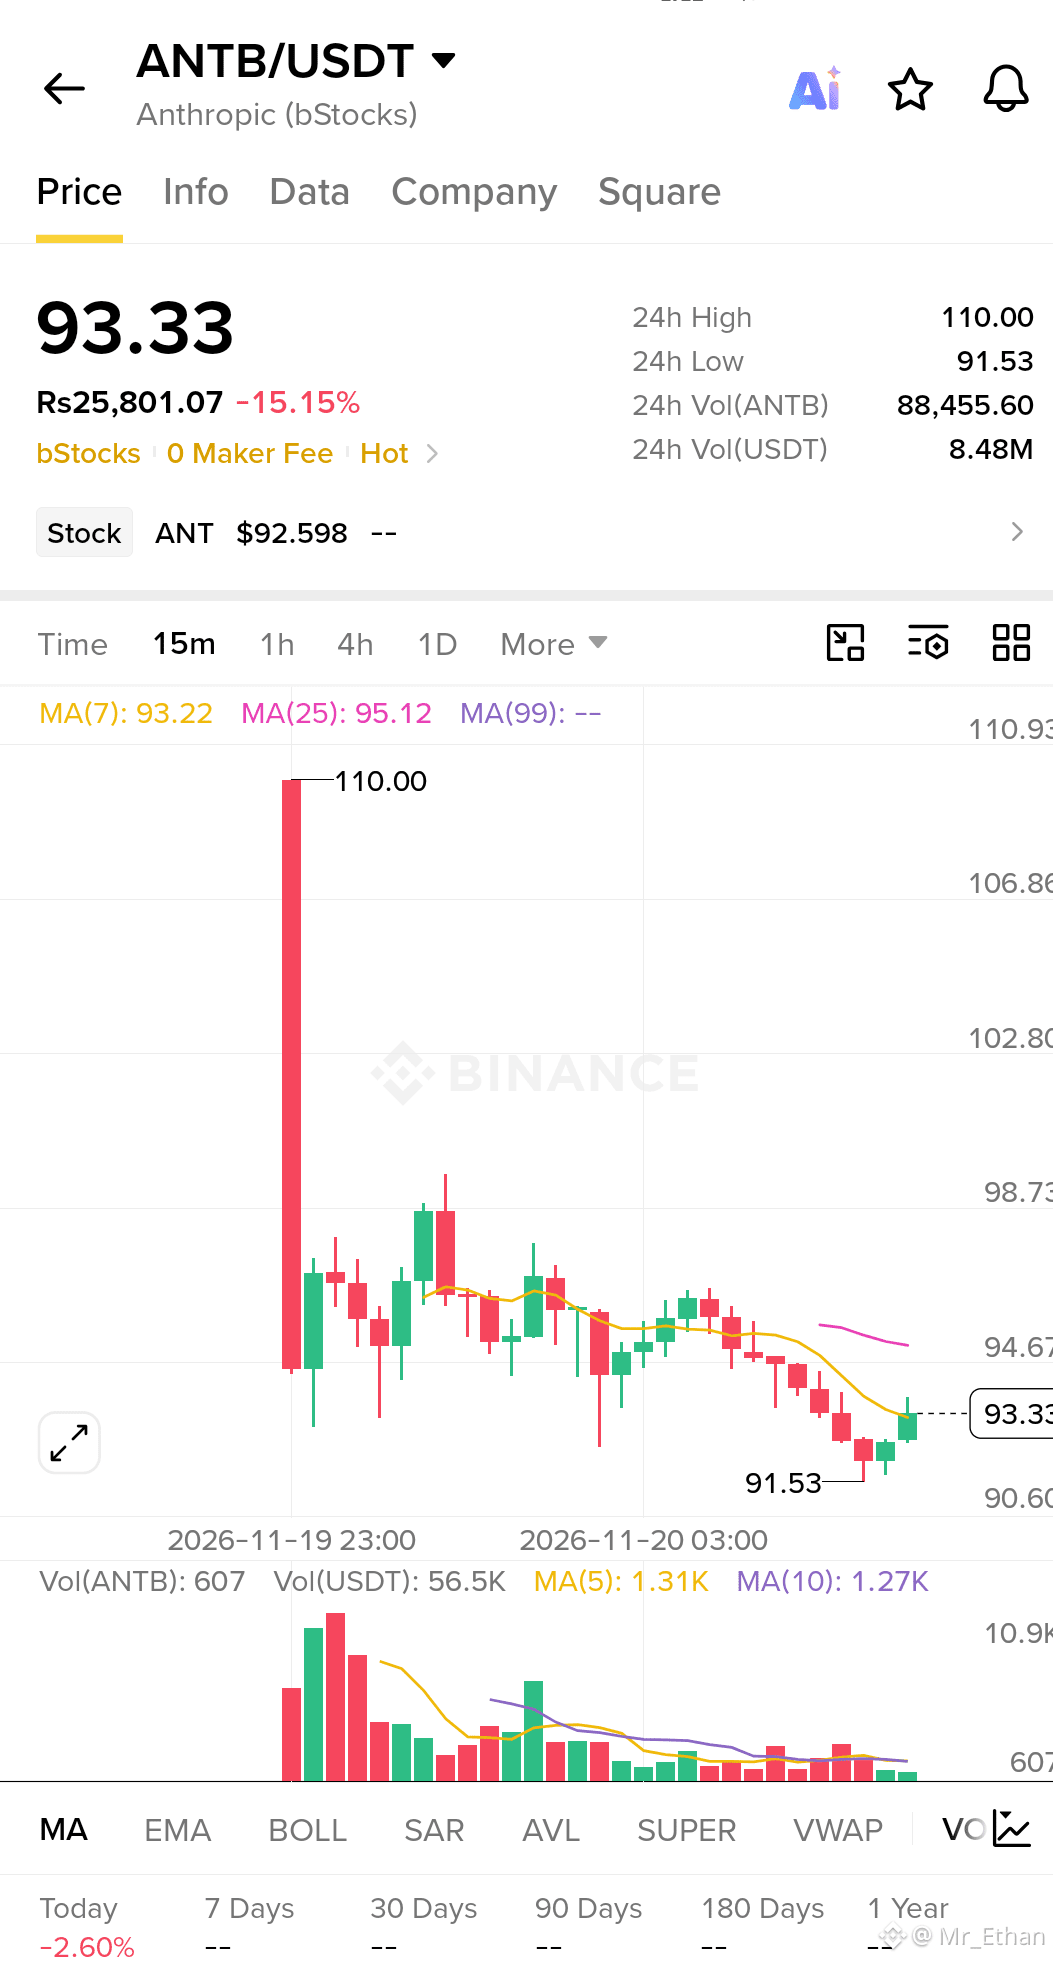
ANTB has dropped sharply -15.15% in 24H, with price currently at $93.33. The 15-minute chart shows a slight bounce from the $91.53 support, but price remains below the MA(25) at $95.12, keeping the short-term trend weak.
📍 Entry Range: $94.20 – $95.10 🎯 TP1: $92.50 🎯 TP2: $91.53 🚀 Final Target: $90.60 🛑 Stop Loss: $96.20
The $94.60–$95.10 zone acts as immediate resistance, with the MA(25) adding further selling pressure. A rejection from this zone could trigger another move toward $91.53 support, while a breakdown below support may extend losses toward $90.60.
⚠️ Risk Management: Avoid entering after an extended red candle. Wait for a confirmed rejection at resistance, use a stop loss, and keep position size conservative.
Trade on $ANTB
$AVGOB
$NUB
#nubit #Solana2027RoadmapTargetsDoubleComputeCapacity
LONG SETUP 🟢 (Counter-Trend / High Risk)
ANTB has dropped sharply -15.15% in 24H, with price currently at $93.33. The 15-minute chart shows a slight bounce from the $91.53 support, but price remains below the MA(25) at $95.12, keeping the short-term trend weak.
📍 Entry Range: $94.20 – $95.10 🎯 TP1: $92.50 🎯 TP2: $91.53 🚀 Final Target: $90.60 🛑 Stop Loss: $96.20
The $94.60–$95.10 zone acts as immediate resistance, with the MA(25) adding further selling pressure. A rejection from this zone could trigger another move toward $91.53 support, while a breakdown below support may extend losses toward $90.60.
⚠️ Risk Management: Avoid entering after an extended red candle. Wait for a confirmed rejection at resistance, use a stop loss, and keep position size conservative.
Trade on $ANTB
$AVGOB
$NUB
#nubit #Solana2027RoadmapTargetsDoubleComputeCapacity