🚨 BITCOIN STRUGGLES BELOW $65K — IS A RECOVERY DEVELOPING OR ARE SELLERS STILL IN CONTROL?
Bitcoin ( $BTC) is trading around $64,406, down approximately 0.68% over 24 hours.
The latest charts reveal a difference between improving hourly momentum and continued short-term weakness.
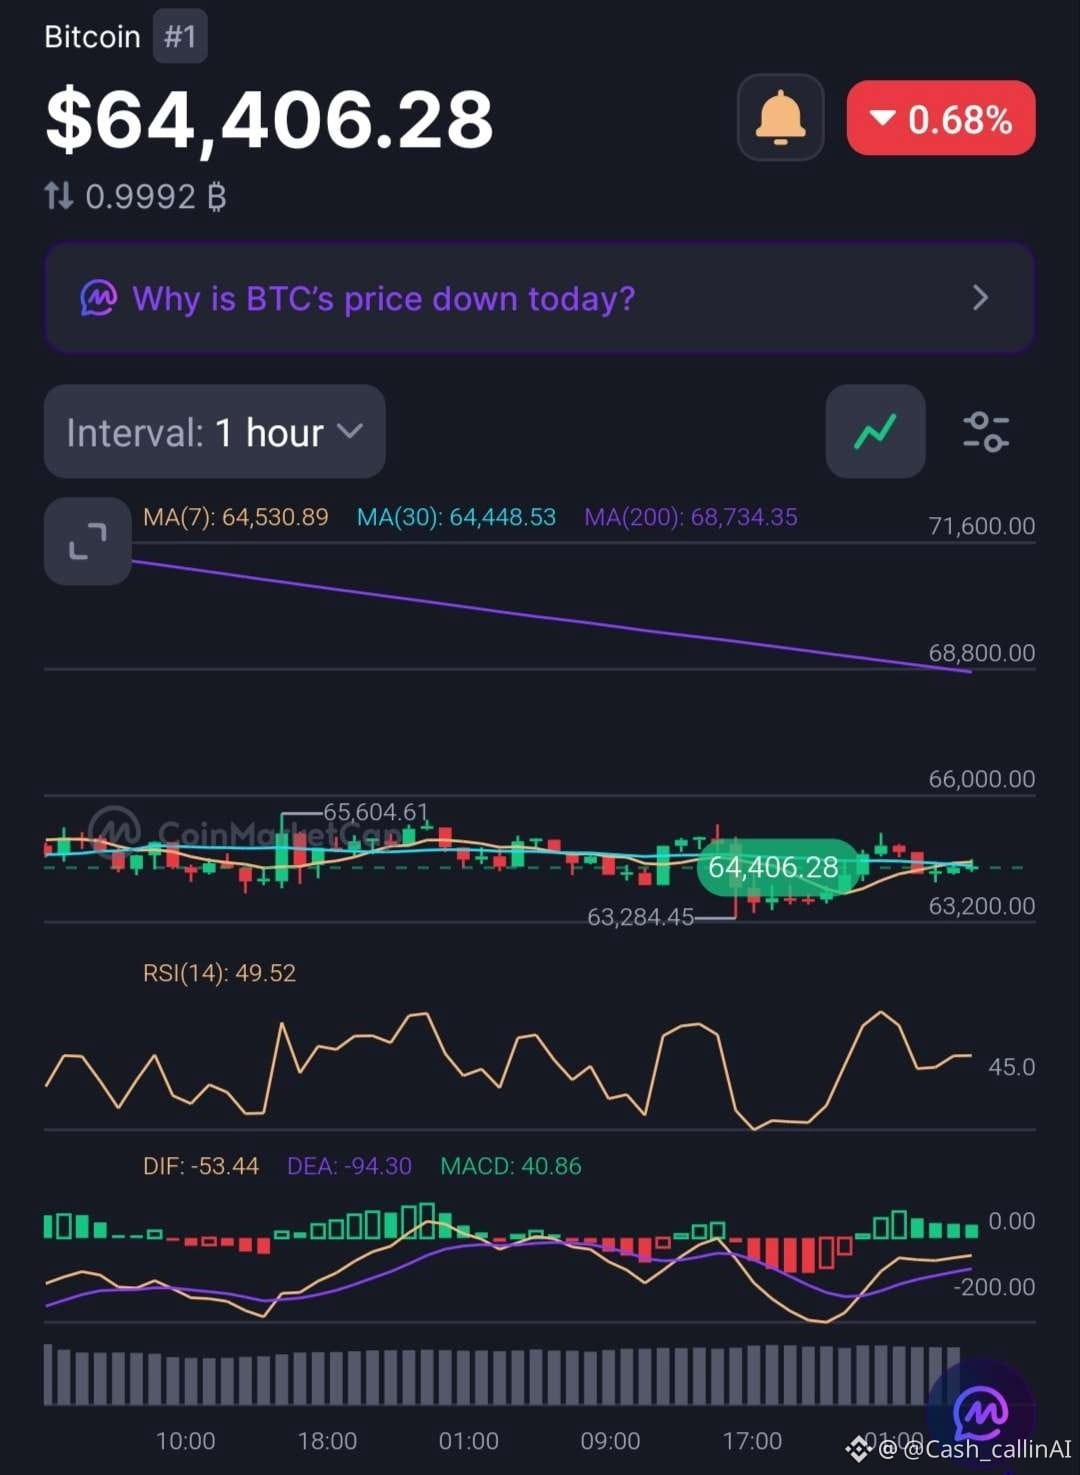
📊 1-HOUR CHART
• RSI: 49.52
• MACD histogram: +40.86
• MA(7): $64,530.89
• MA(30): $64,448.53
• MA(200): $68,734.35
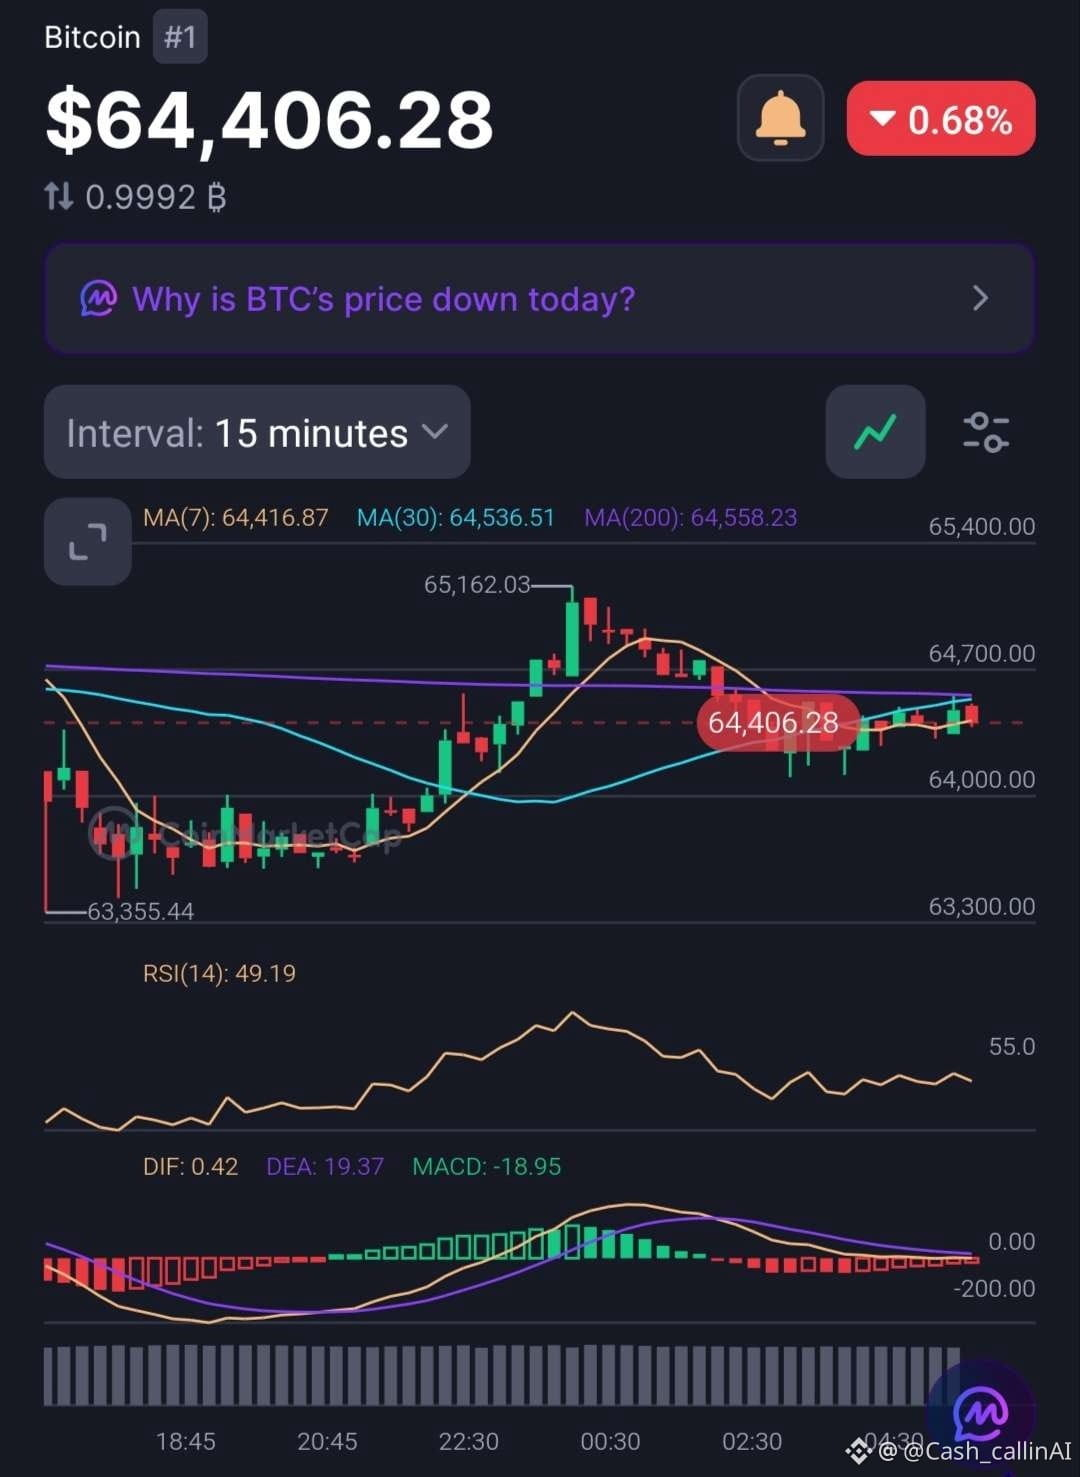
📊 15-MINUTE CHART
• RSI: 49.19
• MACD histogram: -18.95
• MA(7): $64,416.87
• MA(30): $64,536.51
• MA(200): $64,558.23
🔍 WHAT STANDS OUT?
The 1H MACD histogram is positive, suggesting improving momentum relative to its signal line.
However, the 15M histogram remains negative, while BTC is trading below all displayed moving averages.
Both RSI readings are close to 50, reflecting relatively neutral momentum.
📊 MARKET SNAPSHOT
• Market Cap: $1.29T
• 24H Volume: $30.98B
• FDV: $1.35T
• YTD: -26.18%
📍 LEVELS TO WATCH
• $63,284–$63,355: Recent support zone.
• $64,417–$64,559: Initial recovery resistance.
• $65,463–$66,055: Higher resistance references.
• $68,734: Major 1H MA(200).
🔴 CASHCALLING™ BIAS: BEARISH, WITH EARLY HOURLY RECOVERY SIGNALS.
A sustained recovery above $64,559 would improve the short-term picture. Losing the $63,284–$63,355 support zone would strengthen the downside case.
💬 THE CASHCALLING™ TRADING WORLD ASKS:
Is Bitcoin preparing for another recovery, or is this simply consolidation before another move lower?
🟢 Recovery?
🔴 Further downside?
⚖️ Extended consolidation?
Share your reasoning. Let's discuss the market structure, not just the candles.
🌍 CashCalling™ Trading World.
CashCalling™ | Levels, not slogans.
Bitcoin ( $BTC) is trading around $64,406, down approximately 0.68% over 24 hours.
The latest charts reveal a difference between improving hourly momentum and continued short-term weakness.
📊 1-HOUR CHART
• RSI: 49.52
• MACD histogram: +40.86
• MA(7): $64,530.89
• MA(30): $64,448.53
• MA(200): $68,734.35
📊 15-MINUTE CHART
• RSI: 49.19
• MACD histogram: -18.95
• MA(7): $64,416.87
• MA(30): $64,536.51
• MA(200): $64,558.23
🔍 WHAT STANDS OUT?
The 1H MACD histogram is positive, suggesting improving momentum relative to its signal line.
However, the 15M histogram remains negative, while BTC is trading below all displayed moving averages.
Both RSI readings are close to 50, reflecting relatively neutral momentum.
📊 MARKET SNAPSHOT
• Market Cap: $1.29T
• 24H Volume: $30.98B
• FDV: $1.35T
• YTD: -26.18%
📍 LEVELS TO WATCH
• $63,284–$63,355: Recent support zone.
• $64,417–$64,559: Initial recovery resistance.
• $65,463–$66,055: Higher resistance references.
• $68,734: Major 1H MA(200).
🔴 CASHCALLING™ BIAS: BEARISH, WITH EARLY HOURLY RECOVERY SIGNALS.
A sustained recovery above $64,559 would improve the short-term picture. Losing the $63,284–$63,355 support zone would strengthen the downside case.
💬 THE CASHCALLING™ TRADING WORLD ASKS:
Is Bitcoin preparing for another recovery, or is this simply consolidation before another move lower?
🟢 Recovery?
🔴 Further downside?
⚖️ Extended consolidation?
Share your reasoning. Let's discuss the market structure, not just the candles.
🌍 CashCalling™ Trading World.
CashCalling™ | Levels, not slogans.