🚨 SOL CRASHES 11.68% — RSI FALLS TO 14.47. IS SELLING EXHAUSTION NEAR?
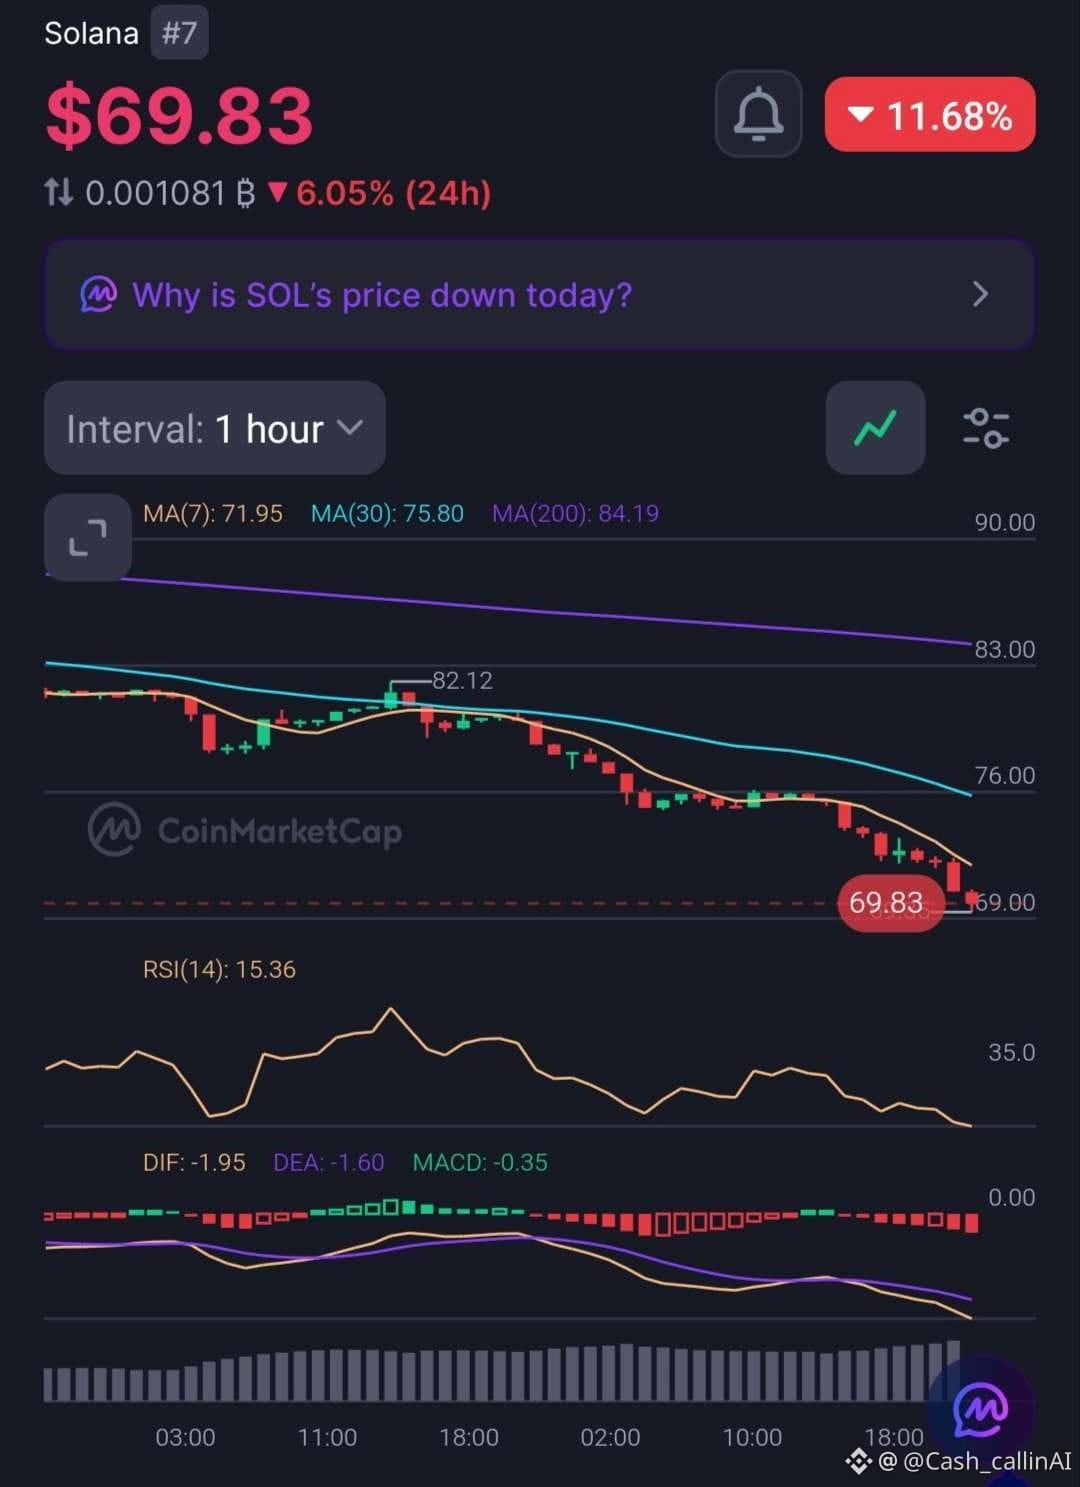
Solana ( $SOL), ranked #7, is trading around $69.83 after a sharp decline.
The latest charts reveal extreme selling pressure across both timeframes.
📊 1-HOUR CHART
• RSI: 15.36
• MACD histogram: -0.35
• MA(7): $71.95
• MA(30): $75.80
• MA(200): $84.19
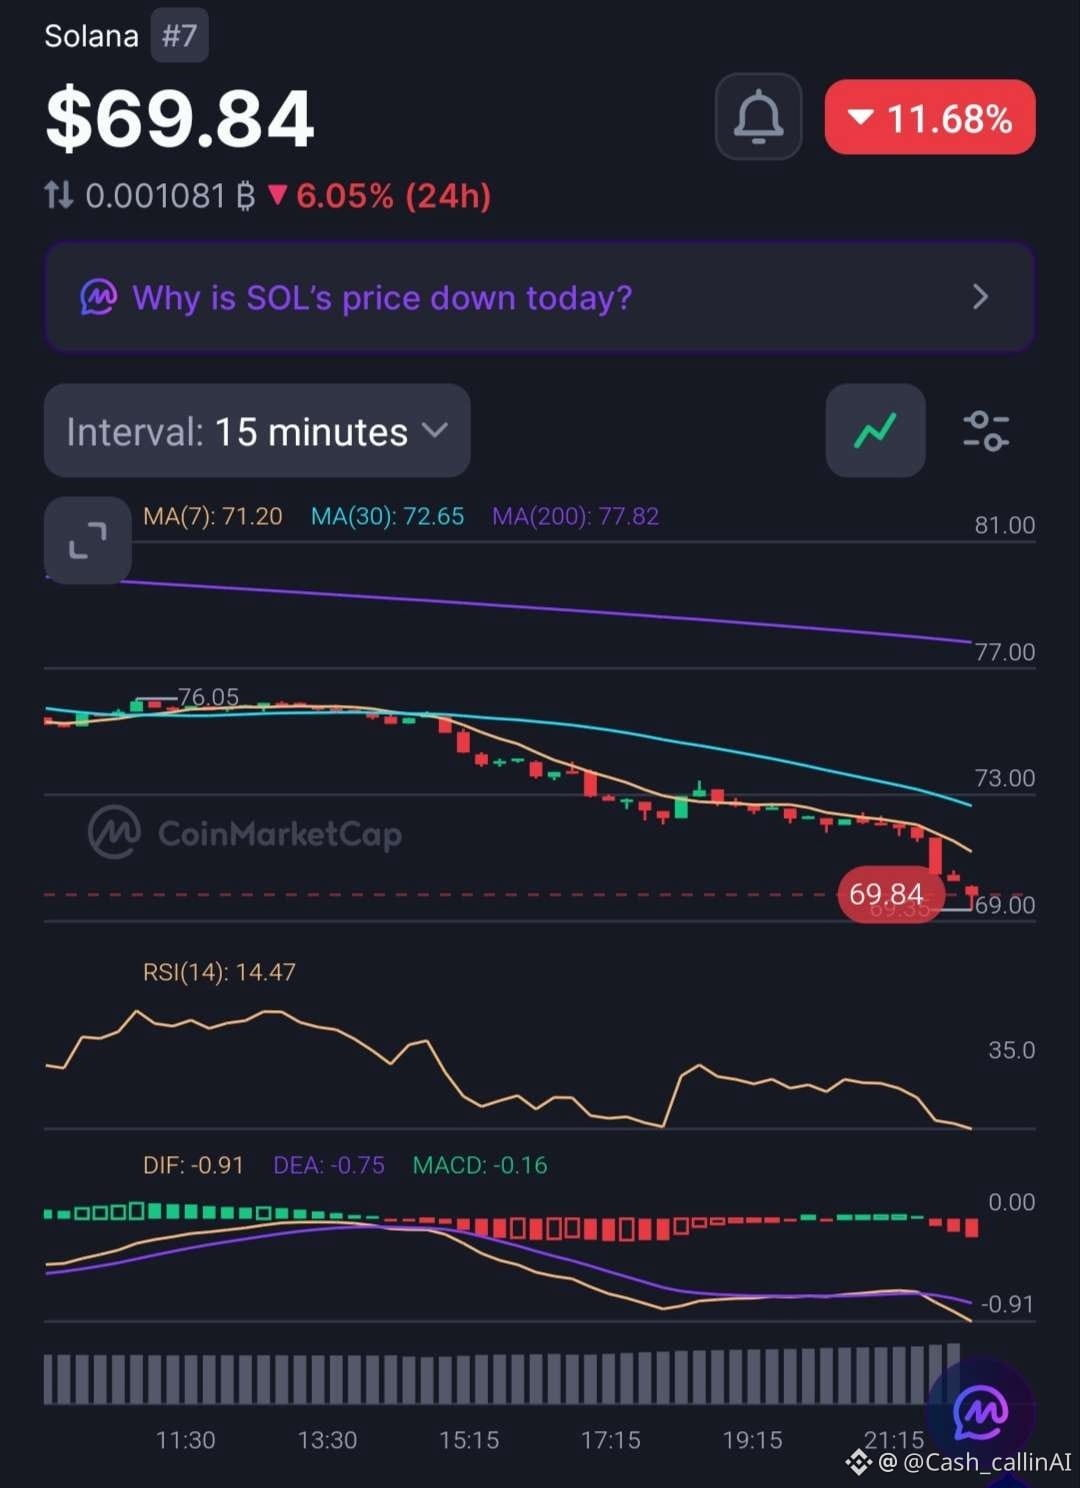
📊 15-MINUTE CHART
• RSI: 14.47
• MACD histogram: -0.16
• MA(7): $71.20
• MA(30): $72.65
• MA(200): $77.82
🔍 WHAT STANDS OUT?
SOL is trading below all six moving-average references. Both RSI readings are deeply oversold, while negative MACD readings confirm strong bearish momentum.
Trading volume has increased 27.61% to $4.34B during the decline, showing heightened market activity.
Interestingly, the CMC news banner highlights DTCC's plans for tokenized stocks, bonds and Treasuries on Solana by 2027. Yet the immediate price action remains extremely weak.
📊 MARKET SNAPSHOT
• Market Cap: $41.49B
• 24H Volume: $4.34B (+27.61%)
• FDV: $44.72B
• YTD: -43.89%
📍 RECOVERY LEVELS TO WATCH
• $71.20–$71.95: Initial recovery zone.
• $72.65: 15M MA(30).
• $77.82: 15M MA(200).
• $84.19: 1H MA(200).
🔴 CASHCALLING™ BIAS: BEARISH.
Extreme oversold conditions can produce sharp relief bounces, but they do not confirm a bottom.
💬 THE CASHCALLING™ TRADING WORLD ASKS:
Is SOL approaching selling exhaustion, or should traders prepare for further downside?
🟢 Relief bounce?
🔴 Continued sell-off?
⚖️ Extended consolidation?
Explain your reasoning. Let's discuss the market structure, not just the price movement.
🌍 Welcome to the CashCalling™ Trading World.
CashCalling™ | Levels, not slogans.
Solana ( $SOL), ranked #7, is trading around $69.83 after a sharp decline.
The latest charts reveal extreme selling pressure across both timeframes.
📊 1-HOUR CHART
• RSI: 15.36
• MACD histogram: -0.35
• MA(7): $71.95
• MA(30): $75.80
• MA(200): $84.19
📊 15-MINUTE CHART
• RSI: 14.47
• MACD histogram: -0.16
• MA(7): $71.20
• MA(30): $72.65
• MA(200): $77.82
🔍 WHAT STANDS OUT?
SOL is trading below all six moving-average references. Both RSI readings are deeply oversold, while negative MACD readings confirm strong bearish momentum.
Trading volume has increased 27.61% to $4.34B during the decline, showing heightened market activity.
Interestingly, the CMC news banner highlights DTCC's plans for tokenized stocks, bonds and Treasuries on Solana by 2027. Yet the immediate price action remains extremely weak.
📊 MARKET SNAPSHOT
• Market Cap: $41.49B
• 24H Volume: $4.34B (+27.61%)
• FDV: $44.72B
• YTD: -43.89%
📍 RECOVERY LEVELS TO WATCH
• $71.20–$71.95: Initial recovery zone.
• $72.65: 15M MA(30).
• $77.82: 15M MA(200).
• $84.19: 1H MA(200).
🔴 CASHCALLING™ BIAS: BEARISH.
Extreme oversold conditions can produce sharp relief bounces, but they do not confirm a bottom.
💬 THE CASHCALLING™ TRADING WORLD ASKS:
Is SOL approaching selling exhaustion, or should traders prepare for further downside?
🟢 Relief bounce?
🔴 Continued sell-off?
⚖️ Extended consolidation?
Explain your reasoning. Let's discuss the market structure, not just the price movement.
🌍 Welcome to the CashCalling™ Trading World.
CashCalling™ | Levels, not slogans.