🚨 BITCOIN FLASH CRASH📉🩸: BREAKING BELOW $70K & MASSIVE LONG LIQUIDATIONS! 📉
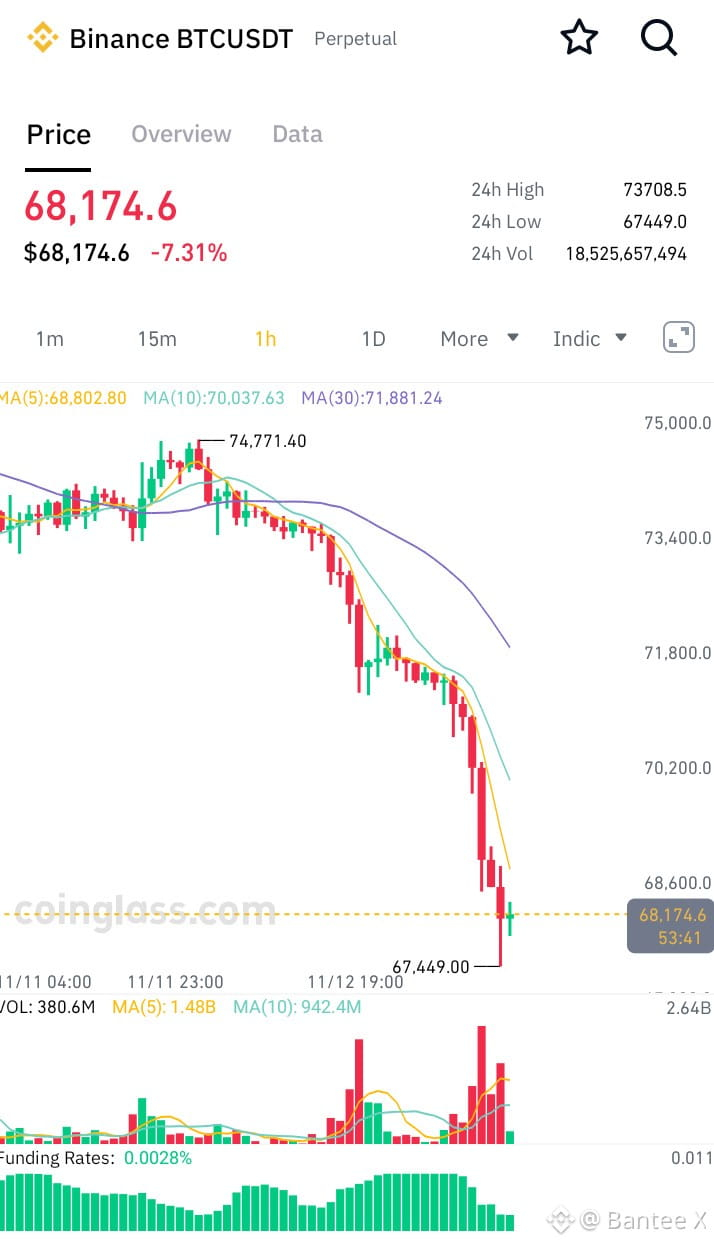
The market just experienced a brutal correction as Bitcoin sliced through the psychological $70,000 level for the first time since August, plunging down to a local low near $67,449 before attempting to stabilize around $68,174 -7.31% on the day🌐.
The cascading sell off triggered a massive flush in the derivatives market, wiping out over $750 million in long liquidations over the past 24 hours 📊.
What the Chart Tells Us 🔍
After failing to sustain momentum near the $74,771 high, price action broke down violently, slicing straight through moving average supports.
Volume Spike: The 1h chart shows massive red volume bars accompanying the flush, indicating panic selling and forced margin closures.
Current Status: Price is trying to bounce off the $67,449 swing low, but moving averages are steep overhead resistance.
🎯 Key Levels to Watch👀
Immediate Resistance: $70,000 – $70,037 Former support flipped to major supply 🧱
Dynamic MA(5) Resistance: ~$68,800 🛑
* Current Price Action Zone: $68,174 ⚡
* Critical Support Floor: $67,449 Recent flash crash low 🟢
🔥 When liquidations cascade past $750M, short-term volatility spikes significantly. While an oversold relief bounce is always possible after such a steep drop, the immediate market structure favors caution 🌐📉.
Are we seeing the ultimate flush before a reversal, or is a deeper test of support incoming? Drop your read below! 👇
$BTC
#HuangExitNvidiaStrategyInFocus #btcdown
#BANTEEX
The market just experienced a brutal correction as Bitcoin sliced through the psychological $70,000 level for the first time since August, plunging down to a local low near $67,449 before attempting to stabilize around $68,174 -7.31% on the day🌐.
The cascading sell off triggered a massive flush in the derivatives market, wiping out over $750 million in long liquidations over the past 24 hours 📊.
What the Chart Tells Us 🔍
After failing to sustain momentum near the $74,771 high, price action broke down violently, slicing straight through moving average supports.
Volume Spike: The 1h chart shows massive red volume bars accompanying the flush, indicating panic selling and forced margin closures.
Current Status: Price is trying to bounce off the $67,449 swing low, but moving averages are steep overhead resistance.
🎯 Key Levels to Watch👀
Immediate Resistance: $70,000 – $70,037 Former support flipped to major supply 🧱
Dynamic MA(5) Resistance: ~$68,800 🛑
* Current Price Action Zone: $68,174 ⚡
* Critical Support Floor: $67,449 Recent flash crash low 🟢
🔥 When liquidations cascade past $750M, short-term volatility spikes significantly. While an oversold relief bounce is always possible after such a steep drop, the immediate market structure favors caution 🌐📉.
Are we seeing the ultimate flush before a reversal, or is a deeper test of support incoming? Drop your read below! 👇
$BTC
#HuangExitNvidiaStrategyInFocus #btcdown
#BANTEEX