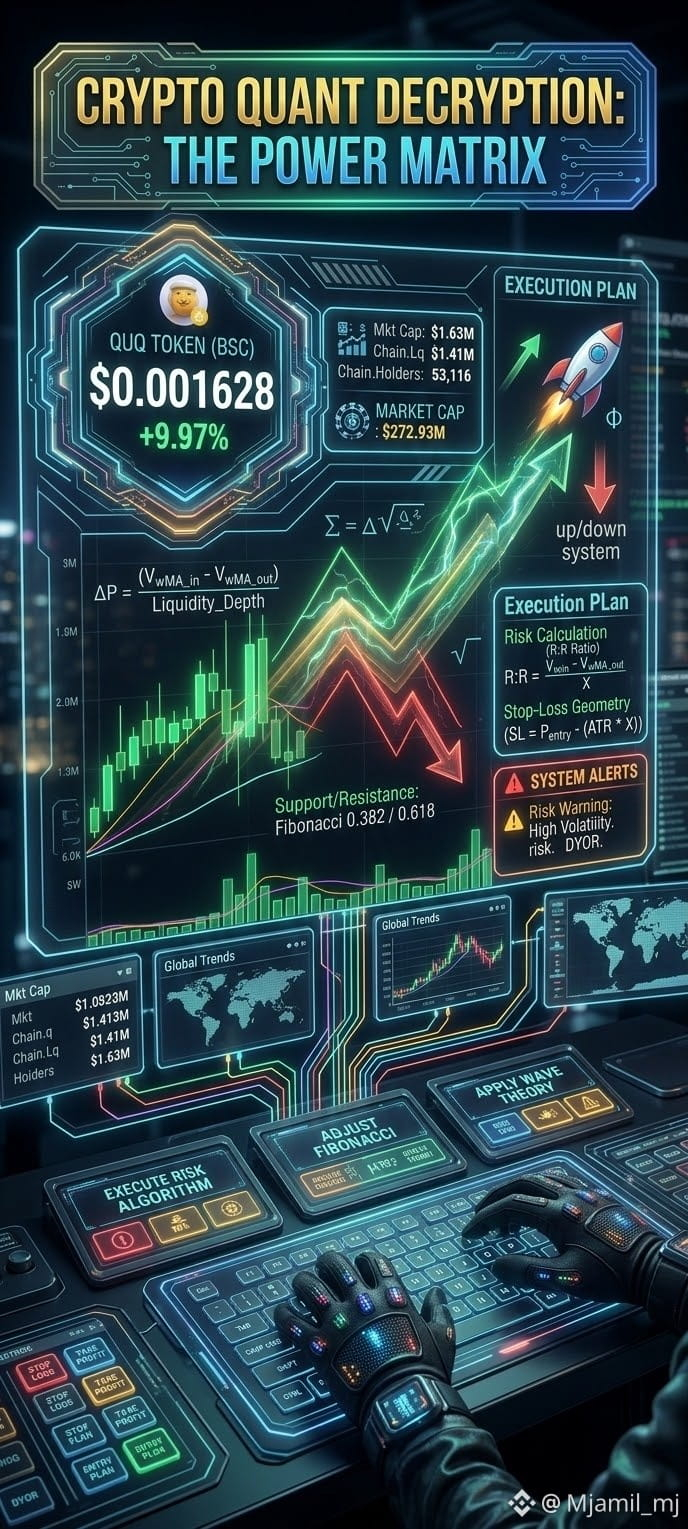
📊 The Mathematics of Momentum: Mastering the Up/Down Market Matrix 📊
When looking at a live trading chart—such as the QUQ token sitting at $0.001628 with a +9.97% uptick on the BSC network—amateurs see random green and red candles. Professionals see equations, probabilities, and momentum vectors.
Markets do not move by emotion alone; they operate on a strict mathematical up/down system governed by volume, liquidity depth, and moving averages.
1. The Mathematical Engine Behind the Price Action
Every price shift is calculated through real-time variables. To survive the volatility, you must understand the core mathematics driving the charts:
* Volume Weighted Moving Averages (VWMA & MA Crossovers): Notice how the MA(7), MA(25), and MA(99) interact. The crossover points represent the exact mathematical inflection where buyer momentum (\Delta P) outweighs seller resistance.
* The Up/Down Liquidity Ratio: With a market cap of $1.63M and chain liquidity at $1.41M, the math dictates how violently the price can swing. High trading volume coupled with tight liquidity creates an amplified multiplier effect—meaning prices can spike up or crash down in seconds.
2. The 4-Step Execution Matrix
Never enter a high-volume trade without a mathematical risk matrix. Protect your capital using this strict operational framework:
* Entry Calculation (\Sigma_{in}): Do not chase green candles blindly. Calculate your entry based on support zones, not FOMO.
* The Exit Horizon (\Delta_{out}): Establish a predefined profit ceiling. In high-volatility tokens, pumps are time-sensitive; secure your gains before the down-cycle begins.
#CryptoTrading #MarketMath #TradingStrategy #BSC #RiskManagement #QUQ #Volatility #SmartInvesting #dyor $quq
When looking at a live trading chart—such as the QUQ token sitting at $0.001628 with a +9.97% uptick on the BSC network—amateurs see random green and red candles. Professionals see equations, probabilities, and momentum vectors.
Markets do not move by emotion alone; they operate on a strict mathematical up/down system governed by volume, liquidity depth, and moving averages.
1. The Mathematical Engine Behind the Price Action
Every price shift is calculated through real-time variables. To survive the volatility, you must understand the core mathematics driving the charts:
* Volume Weighted Moving Averages (VWMA & MA Crossovers): Notice how the MA(7), MA(25), and MA(99) interact. The crossover points represent the exact mathematical inflection where buyer momentum (\Delta P) outweighs seller resistance.
* The Up/Down Liquidity Ratio: With a market cap of $1.63M and chain liquidity at $1.41M, the math dictates how violently the price can swing. High trading volume coupled with tight liquidity creates an amplified multiplier effect—meaning prices can spike up or crash down in seconds.
2. The 4-Step Execution Matrix
Never enter a high-volume trade without a mathematical risk matrix. Protect your capital using this strict operational framework:
* Entry Calculation (\Sigma_{in}): Do not chase green candles blindly. Calculate your entry based on support zones, not FOMO.
* The Exit Horizon (\Delta_{out}): Establish a predefined profit ceiling. In high-volatility tokens, pumps are time-sensitive; secure your gains before the down-cycle begins.
#CryptoTrading #MarketMath #TradingStrategy #BSC #RiskManagement #QUQ #Volatility #SmartInvesting #dyor $quq