

Ethereum (ETH/USDT) Technical Brief — November 12, 2026
Ethereum (ETH) is trading between $2,050 and $2,080, struggling to establish strong buying momentum after pulling back from its early November attempt at $2,420. The broader structural bias remains defensive across daily timeframes, with price action continuing to trade below all key moving averages.
1. Key Technical Levels
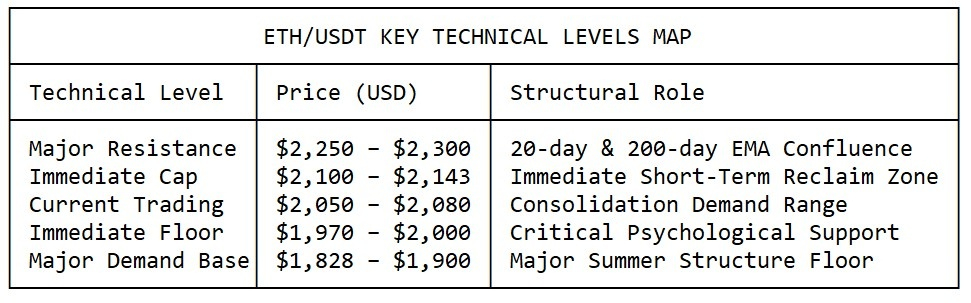
2. Technical & Indicator Breakdown
Price Action & Trend: ETH remains in a short-term bearish market structure. The recent rejection at the $2,420 zone confirmed former breakout support as strong overhead resistance.
Exponential Moving Averages (EMAs): ETH is trading under the 20-day EMA ($2,251), 100-day EMA ($2,327), and 50-day EMA ($2,348). Reclaiming $2,100–$2,143 is required first to pause short-term selling pressure.
Momentum Indicators (RSI & Stochastics): The daily RSI-14 hovers near ~33 with the Stochastic Oscillator near ~18. While this signals deeply oversold conditions (frequently leading to short-covering bounces), a sustained trend reversal requires daily volume confirmation.
3. Trade Scenarios & Strategic Outlook
A. Bullish Reversal Scenario (Trigger: Reclaim $2,100)
Condition: A daily close above $2,100.
Target: Upside retest of $2,204 to $2,250 (20-day EMA barrier).
Confirmation: RSI moving back above 40 alongside an expansion in spot buying volume.
B. Bearish Breakdown Scenario (Trigger: Lose $2,000)
Condition: A decisive daily close below $1,970 – $2,000.
Target: Liquidity sweep toward $1,828 – $1,900.
Risk Control: Keep tight stop-losses above $2,100 on defensive position management.