
#
🚨 Bitcoin ($BTC ) Holding The Line At $73,800
While short-term panic shakes out weak hands, Bitcoin ($BTC ) is testing one of the most important macro support zones on the entire chart around $73,500–$73,900.
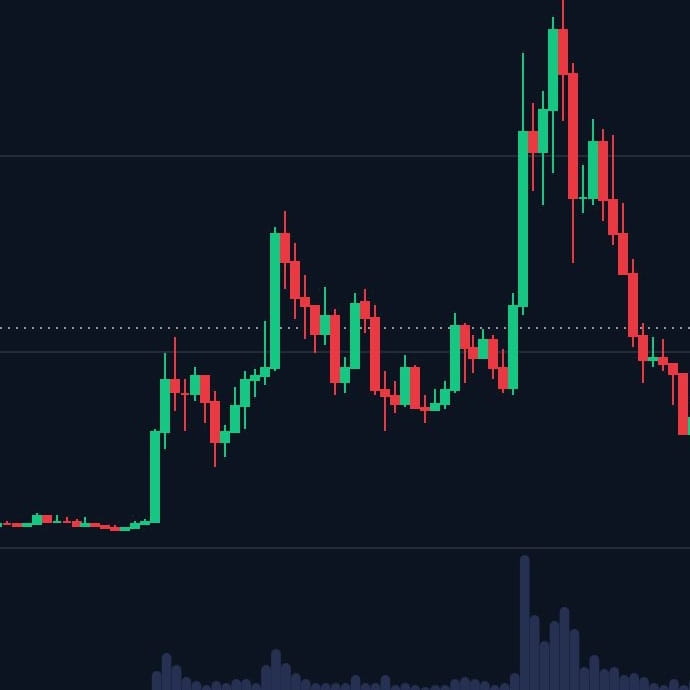
Here is the exact breakdown of what is happening on the $BTC chart right now!
🔍 The Technical Setup
• Testing Major Macro Support: After losing the psychological $80,000 handle earlier this month, BTC pulled back into the $73,000–$73,800 demand zone—a critical confluence area combining the 200-day moving average and the 20-week simple moving average.
• Momentum Reset: The daily RSI has cooled off below the 50 neutral line, wiping out overheated long leverage and resetting the market for a healthier, more sustainable move.
🗺️ Key Price Levels to Watch
• 🛡️ The Ultimate Floor ($73,000–$73,500): This is the line in the sand for bulls. Defending this zone keeps the broader multi-month bullish structure intact. A clean breakdown below $73,000 exposes the major psychological $70,000 support next.
• ⚡ Immediate Hurdle ($76,800–$78,000): Reclaiming the 21-week EMA near $76,875 is the first signal that buyers are stepping back in with conviction.
• 🚀 Bullish Confirmation ($80,000+): A strong daily close back above $80,000 invalidates the short-term bearish pressure and reopens the path toward $84,500–$88,600.
💡 The Game Plan
Macro headwinds and tech-stock volatility have weighed on risk assets lately, making patience your biggest edge.
• Spot Investors: Gradual DCA entries inside the $70,000–$73,800 macro support band offer strong long-term value compared to buying local tops.
• Breakout Traders: Wait for a confirmed reclaim of $76,800 or $80,000 with rising volume before aggressively sizing into long positions.
Are you buying this $73K dip on $BTC or waiting for a test of $70,000? Drop your game plan below! 👇
#Bitcoin #BTC #CryptoAnalysis #TradingStrategy #TechnicalAnalysis #BinanceSquare
🚨 Bitcoin ($BTC ) Holding The Line At $73,800
While short-term panic shakes out weak hands, Bitcoin ($BTC ) is testing one of the most important macro support zones on the entire chart around $73,500–$73,900.
Here is the exact breakdown of what is happening on the $BTC chart right now!
🔍 The Technical Setup
• Testing Major Macro Support: After losing the psychological $80,000 handle earlier this month, BTC pulled back into the $73,000–$73,800 demand zone—a critical confluence area combining the 200-day moving average and the 20-week simple moving average.
• Momentum Reset: The daily RSI has cooled off below the 50 neutral line, wiping out overheated long leverage and resetting the market for a healthier, more sustainable move.
🗺️ Key Price Levels to Watch
• 🛡️ The Ultimate Floor ($73,000–$73,500): This is the line in the sand for bulls. Defending this zone keeps the broader multi-month bullish structure intact. A clean breakdown below $73,000 exposes the major psychological $70,000 support next.
• ⚡ Immediate Hurdle ($76,800–$78,000): Reclaiming the 21-week EMA near $76,875 is the first signal that buyers are stepping back in with conviction.
• 🚀 Bullish Confirmation ($80,000+): A strong daily close back above $80,000 invalidates the short-term bearish pressure and reopens the path toward $84,500–$88,600.
💡 The Game Plan
Macro headwinds and tech-stock volatility have weighed on risk assets lately, making patience your biggest edge.
• Spot Investors: Gradual DCA entries inside the $70,000–$73,800 macro support band offer strong long-term value compared to buying local tops.
• Breakout Traders: Wait for a confirmed reclaim of $76,800 or $80,000 with rising volume before aggressively sizing into long positions.
Are you buying this $73K dip on $BTC or waiting for a test of $70,000? Drop your game plan below! 👇
#Bitcoin #BTC #CryptoAnalysis #TradingStrategy #TechnicalAnalysis #BinanceSquare