🚨 $BTC LIQUIDITY MAP: WHERE IS THE NEXT BIG MOVE? 👀
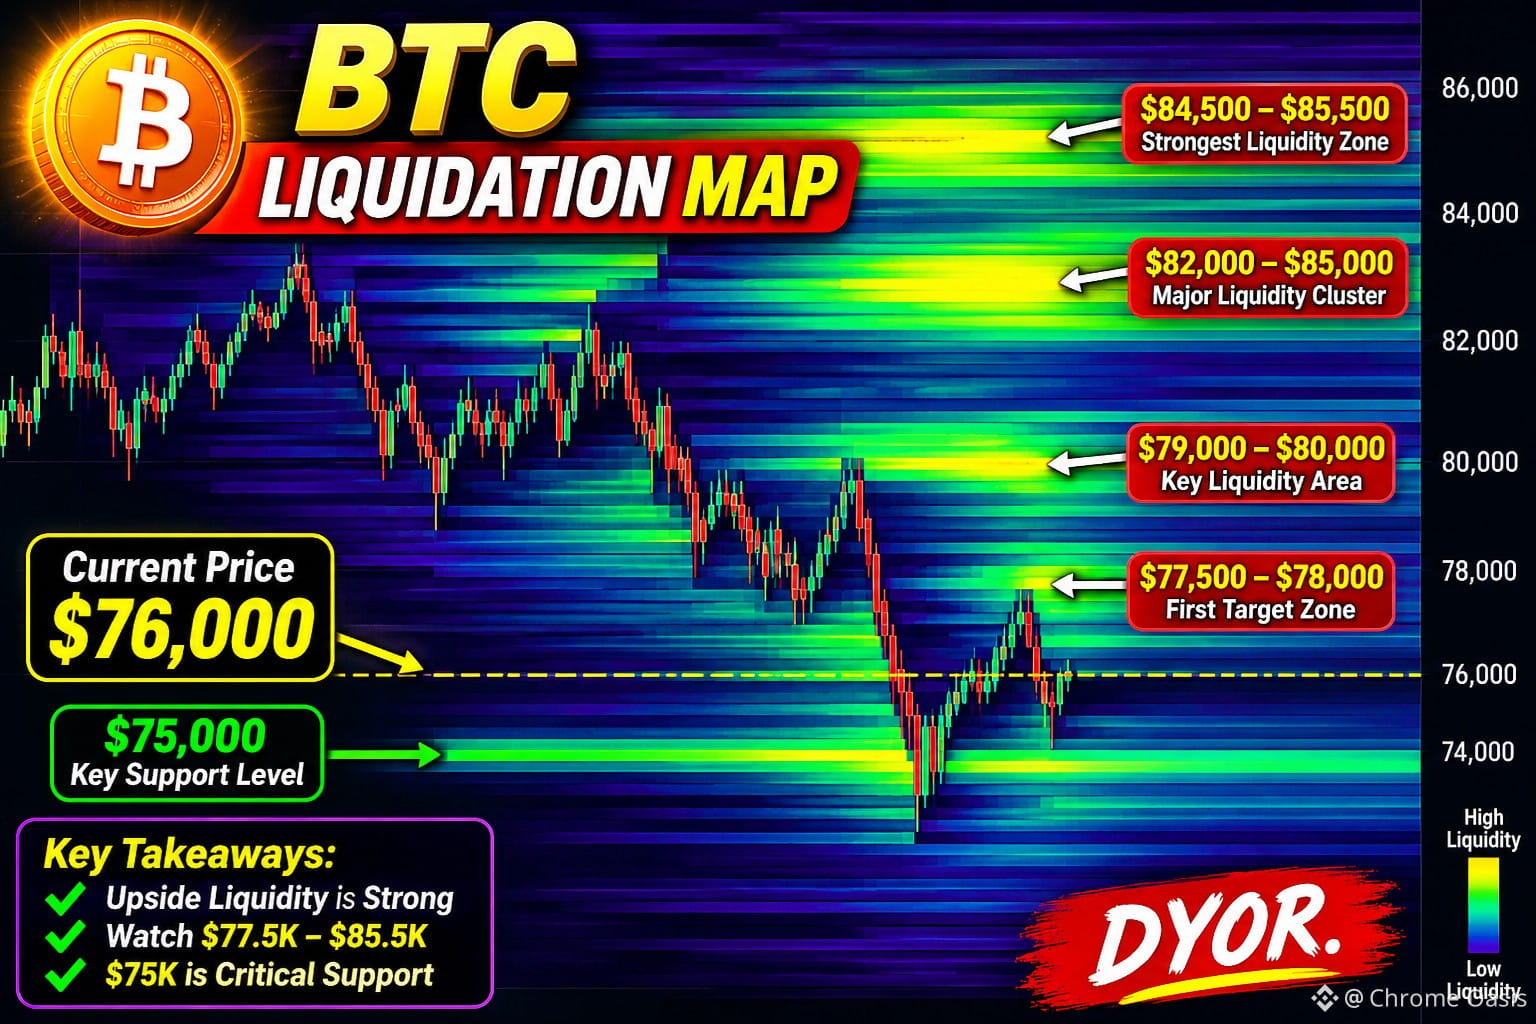
Bitcoin is hovering around the $76K region, but the liquidation map is showing some interesting opportunities above the current price.
Here are the key liquidity zones I'm keeping an eye on:
🔹 $77.5K–$78K: First potential upside target.
🔹 $79K–$80K: Another important liquidity area that could attract price.
🔹 $82K–$85K: A much larger liquidity cluster, making this zone particularly interesting.
🔹 $84.5K–$85.5K: One of the strongest concentration areas on the map.
If buyers manage to push $BTC higher, short liquidations could create additional buying pressure and potentially accelerate the recovery.
But don't ignore the downside! ⚠️
$75K is an important support level. If Bitcoin loses this zone, further selling pressure could open the door to lower prices.
My focus right now is on the liquidity sitting above $BTC . Will the market hunt those short positions first, or will sellers take control again?
The next move could be interesting. Stay patient and watch the key levels!
DYOR.
#Bitcoin #BTCLiquidation #LiquidityMap #BTCAnalysis #CryptoTrading
Bitcoin is hovering around the $76K region, but the liquidation map is showing some interesting opportunities above the current price.
Here are the key liquidity zones I'm keeping an eye on:
🔹 $77.5K–$78K: First potential upside target.
🔹 $79K–$80K: Another important liquidity area that could attract price.
🔹 $82K–$85K: A much larger liquidity cluster, making this zone particularly interesting.
🔹 $84.5K–$85.5K: One of the strongest concentration areas on the map.
If buyers manage to push $BTC higher, short liquidations could create additional buying pressure and potentially accelerate the recovery.
But don't ignore the downside! ⚠️
$75K is an important support level. If Bitcoin loses this zone, further selling pressure could open the door to lower prices.
My focus right now is on the liquidity sitting above $BTC . Will the market hunt those short positions first, or will sellers take control again?
The next move could be interesting. Stay patient and watch the key levels!
DYOR.
#Bitcoin #BTCLiquidation #LiquidityMap #BTCAnalysis #CryptoTrading