📈 BTC — SHARP RECOVERY & TESTING THE MA CLUSTER RESISTANCE! 🚀
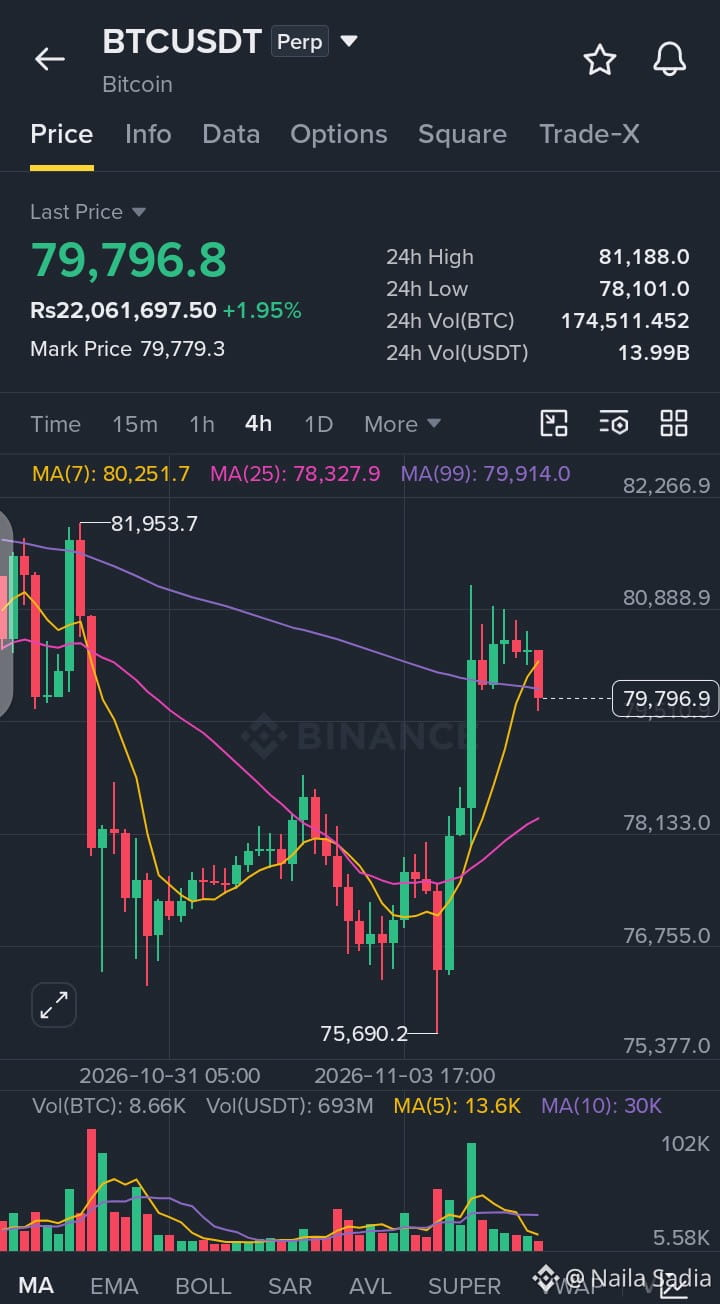
$BTC is trading higher at 79,796.8 (+1.95%, or roughly Rs22,061,697.50), moving within an active 24-hour range between a high of 81,188.0 and a low of 78,101.0. Price action on this 4-hour chart displays a strong impulsive recovery following the flush down to the 75,690.2 capitulation low, pushing right back up to test the overlapping fast MA(7) (80,251.7) and macro structural MA(99) (79,914.0) resistance bands while sitting above the MA(25) (78,327.9).
📊 QUICK TRADE PLAN — 4H
🟢 LONG ENTRY: 77,500.0–79,000.0 (on healthy intraday retests of structural support or successful MA base consolidation)
🛑 STOP LOSS: 76,400.0
🎯 TP1: 81,500.0
🎯 TP2: 83,200.0
❓Are you watching for Bitcoin to break cleanly through the MA(99) and MA(7) resistance cluster to continue the rally toward $81.5K+, or expecting a short-term rejection?
Let's discuss below! 👇
👉 Trade: $BTC
#bitcoin #BTC #cryptotrading #BinanceSquare #TradingSignal
$BTC is trading higher at 79,796.8 (+1.95%, or roughly Rs22,061,697.50), moving within an active 24-hour range between a high of 81,188.0 and a low of 78,101.0. Price action on this 4-hour chart displays a strong impulsive recovery following the flush down to the 75,690.2 capitulation low, pushing right back up to test the overlapping fast MA(7) (80,251.7) and macro structural MA(99) (79,914.0) resistance bands while sitting above the MA(25) (78,327.9).
📊 QUICK TRADE PLAN — 4H
🟢 LONG ENTRY: 77,500.0–79,000.0 (on healthy intraday retests of structural support or successful MA base consolidation)
🛑 STOP LOSS: 76,400.0
🎯 TP1: 81,500.0
🎯 TP2: 83,200.0
❓Are you watching for Bitcoin to break cleanly through the MA(99) and MA(7) resistance cluster to continue the rally toward $81.5K+, or expecting a short-term rejection?
Let's discuss below! 👇
👉 Trade: $BTC
#bitcoin #BTC #cryptotrading #BinanceSquare #TradingSignal