#BinanceReopensWithdrawalsForMoreAssets #BTCRebounds80K #Binance98PercentReplenished $ETH Ethereum (ETH) vs. Solana (SOL) Comparative Analysis
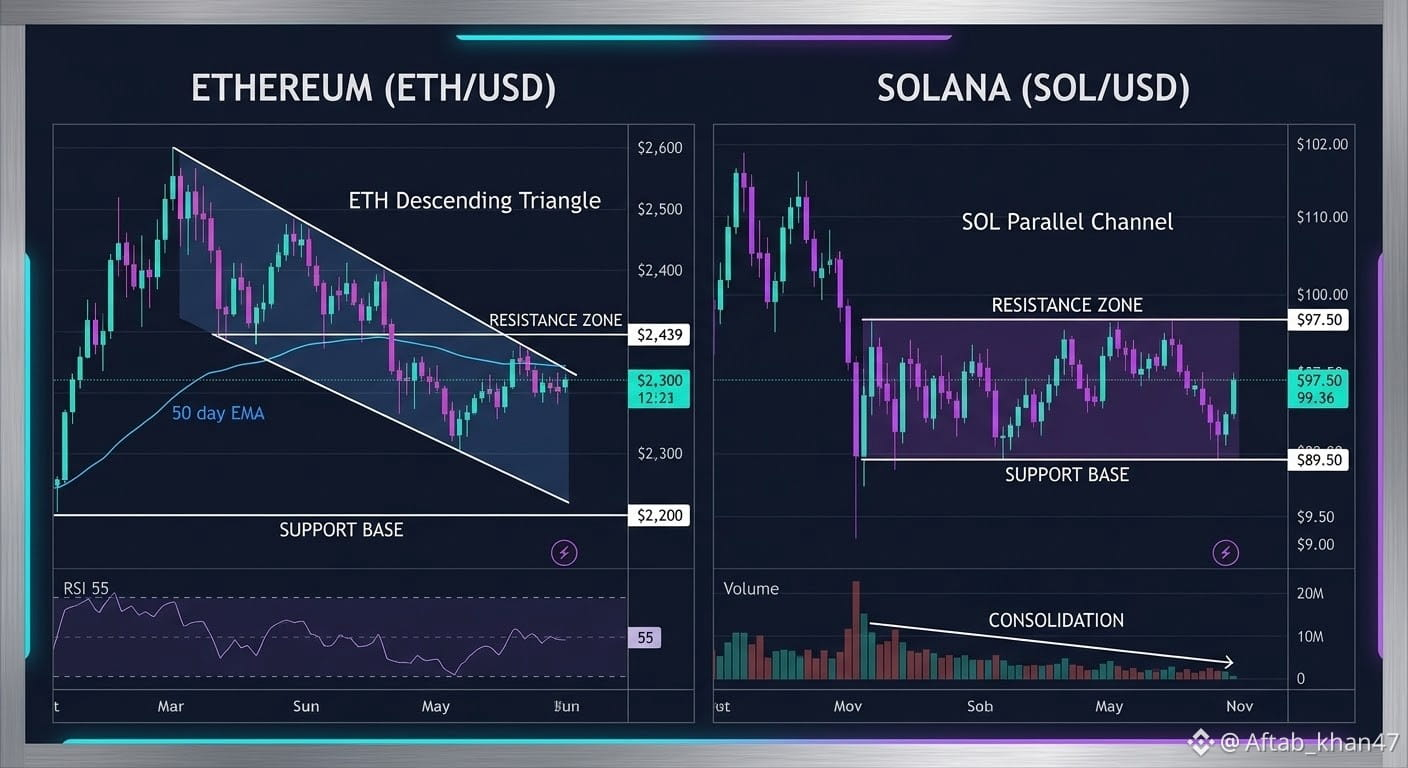
This comparative analysis focuses on the technical chart structures and primary support/resistance levels for the two leading smart contract platforms, Ethereum and Solana, highlighting their distinct trading patterns as identified in the accompanying visualization.
Ethereum (ETH/USD): The Descending Channel
The chart for Ethereum illustrates a persistent, medium-term defensive posture. ETH is navigating a Descending Channel, defined by sequential lower highs and lower lows.
Technical Interpretation: The price has been contained within a clear downward sloping corridor. The dominant strategy of the market has been "selling the rallies."
Primary Resistance Zone ($2,548 – $2,636):
This comparative analysis focuses on the technical chart structures and primary support/resistance levels for the two leading smart contract platforms, Ethereum and Solana, highlighting their distinct trading patterns as identified in the accompanying visualization.
Ethereum (ETH/USD): The Descending Channel
The chart for Ethereum illustrates a persistent, medium-term defensive posture. ETH is navigating a Descending Channel, defined by sequential lower highs and lower lows.
Technical Interpretation: The price has been contained within a clear downward sloping corridor. The dominant strategy of the market has been "selling the rallies."
Primary Resistance Zone ($2,548 – $2,636):