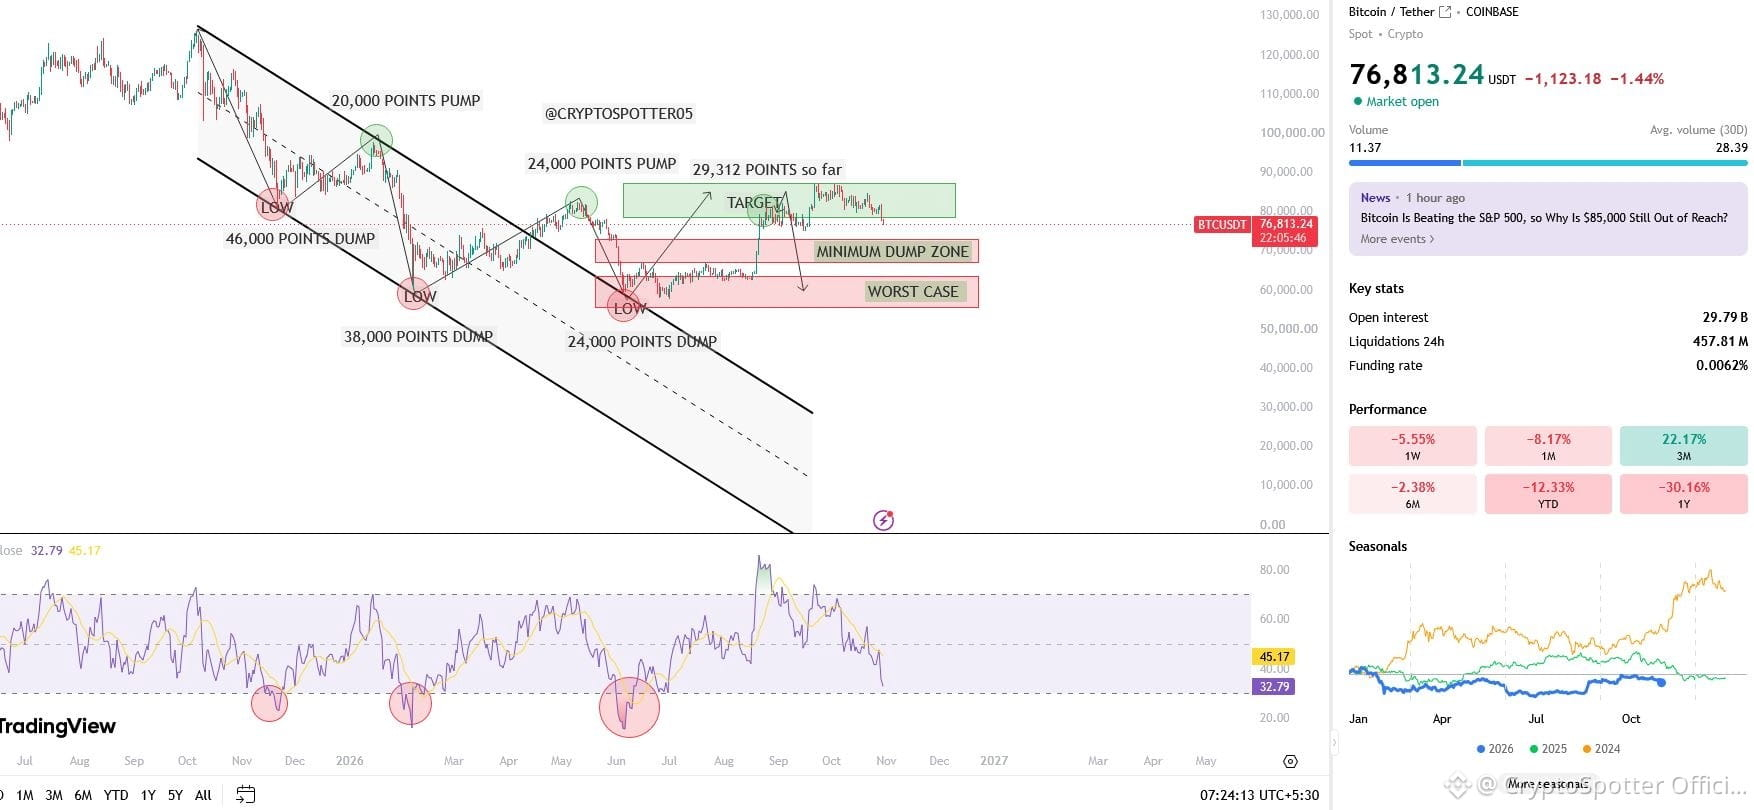
🚨This is why I'm trusting the $BTC chart I created using mathematical point analysis and watching it very closely.
I first shared this chart back in June, Unfortunately i am not allowed to share the Link here bcuz it was shared on X, but i have shared all the proofs on my social media pages, and you can see how closely it has followed our projections so far:
The logic is simple: Our first three pumps were 20K, 24K and roughly 29K points, matching our projections almost perfectly.
Now, based on the same 1-year data, the next move should be downside.
Previous Lows: 1st: 48K | 2nd: 38K | 3rd: 24K 4th: 14K–20K points (estimated)
This puts our next projected $BTC drop zone around $67K–$73K, with a move below $72K highly probable.
Remember, I follow probabilities backed by mathematics, not emotions. That's why math plays such a big role in my analysis.
Follow me @CryptoSpotter Official for unbiased analysis
#bitcoin #BitcoinDunyamiz