🚨 BNB UNDER THE MICROSCOPE: IS A REBOUND COMING, OR WILL SELLING PRESSURE CONTINUE? 📊
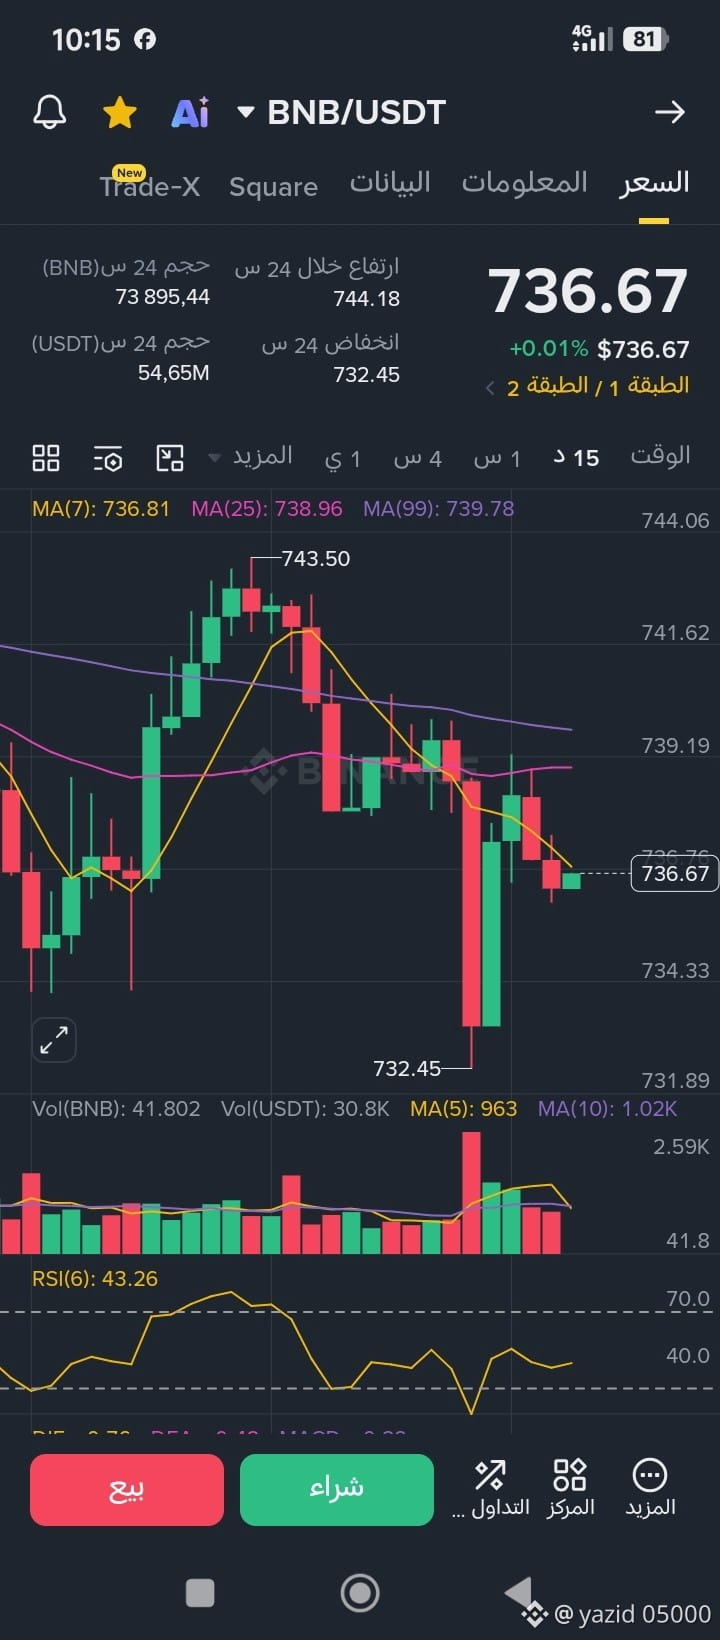
BNB is trading around $736.67, following a pullback from $743.50 and a recent low of $732.45 on the 15-minute chart.
🔍 What Are the Indicators Telling Us?
📉 Moving Averages: The price is trading below MA(7) at $736.81, MA(25) at $738.96, and MA(99) at $739.78, suggesting short-term bearish pressure.
📊 RSI (6): Currently at 43.26, indicating weak momentum without reaching oversold territory.
🟢 Key Support Levels:
• $734.30
• $732.45
🔴 Key Resistance Levels:
• $738.95–$739.80
• $741.60
🎯 Two Possible Scenarios:
🟢 Bullish Scenario: If BNB breaks above $739.80 and holds that level, the price could attempt a move toward $741.60.
🔴 Bearish Scenario: If the price breaks below $734.30, a retest of the $732.45 low becomes possible.
⚖️ My Strategy: I would avoid rushing into a trade before confirmation. Watching for a clear breakout or breakdown, with proper risk management and a predefined stop-loss, may be the more cautious approach.
💬 YOUR TURN!
Do you think BNB will climb back above $740, or will it test $732 again?
Share your analysis in the comments! 👇
#BNB #BinanceSquare #CryptoAnalysis #TechnicalAnalysis #cryptotrading
BNBUSDT CryptoTrading Binance Altcoins