


By Crypto Data AI Lens | Market Data • AI Insights • Smarter Research

A crypto chart can show seven green candles and still leave you with the wrong conclusion.
Why? Because candle colour alone does not explain the full price movement. It does not tell you how much price travelled within each session, where the session closed relative to its high and low, whether trading volume changed, or whether the chart’s data is complete and correctly timestamped.
That is where chart reading stops being guesswork and starts becoming analysis.
In this technical walkthrough, we break a seven-candle chart into its underlying data: Open, High, Low, Close (OHLC), candle-body size, wick structure, trading volume, period return, and data-quality checks.
We will also separate three things that are often confused online:
✓ What the data actually shows
✓ What the data may suggest
✓ What the data cannot prove
Using BTC , ETH and BNB as example assets, this guide builds a reproducible framework for examining seven daily candles without turning chart patterns into unsupported predictions.
No magic indicators. No invented numbers. No claims that a candle can predict the future.
Just structured market-data analysis, transparent calculations, and a clear distinction between evidence and interpretation.
Read beyond the candle colour. Audit the data behind it.
1. First, Define the Dataset
Before interpreting a chart, establish exactly what it represents.
A valid seven-day analysis should document:
- Asset and market: the exact trading pair and exchange.
- Timeframe: one-day candles, not seven arbitrary intraday intervals.
- Date range: the precise start and end timestamps, including timezone.
- Data source: the exchange API or another identifiable historical-data source.
- Retrieval time: when the dataset was collected.
- Candle status: whether the final candle is complete or still forming.
Without these details, two charts labelled “seven-day analysis” may not be directly comparable.
2. Understand the Four Core Values
Every standard candlestick summarises four prices:
- Open (O): the first recorded price in the selected interval.
- High (H): the highest recorded price in that interval.
- Low (L): the lowest recorded price in that interval.
- Close (C): the last recorded price in the interval.
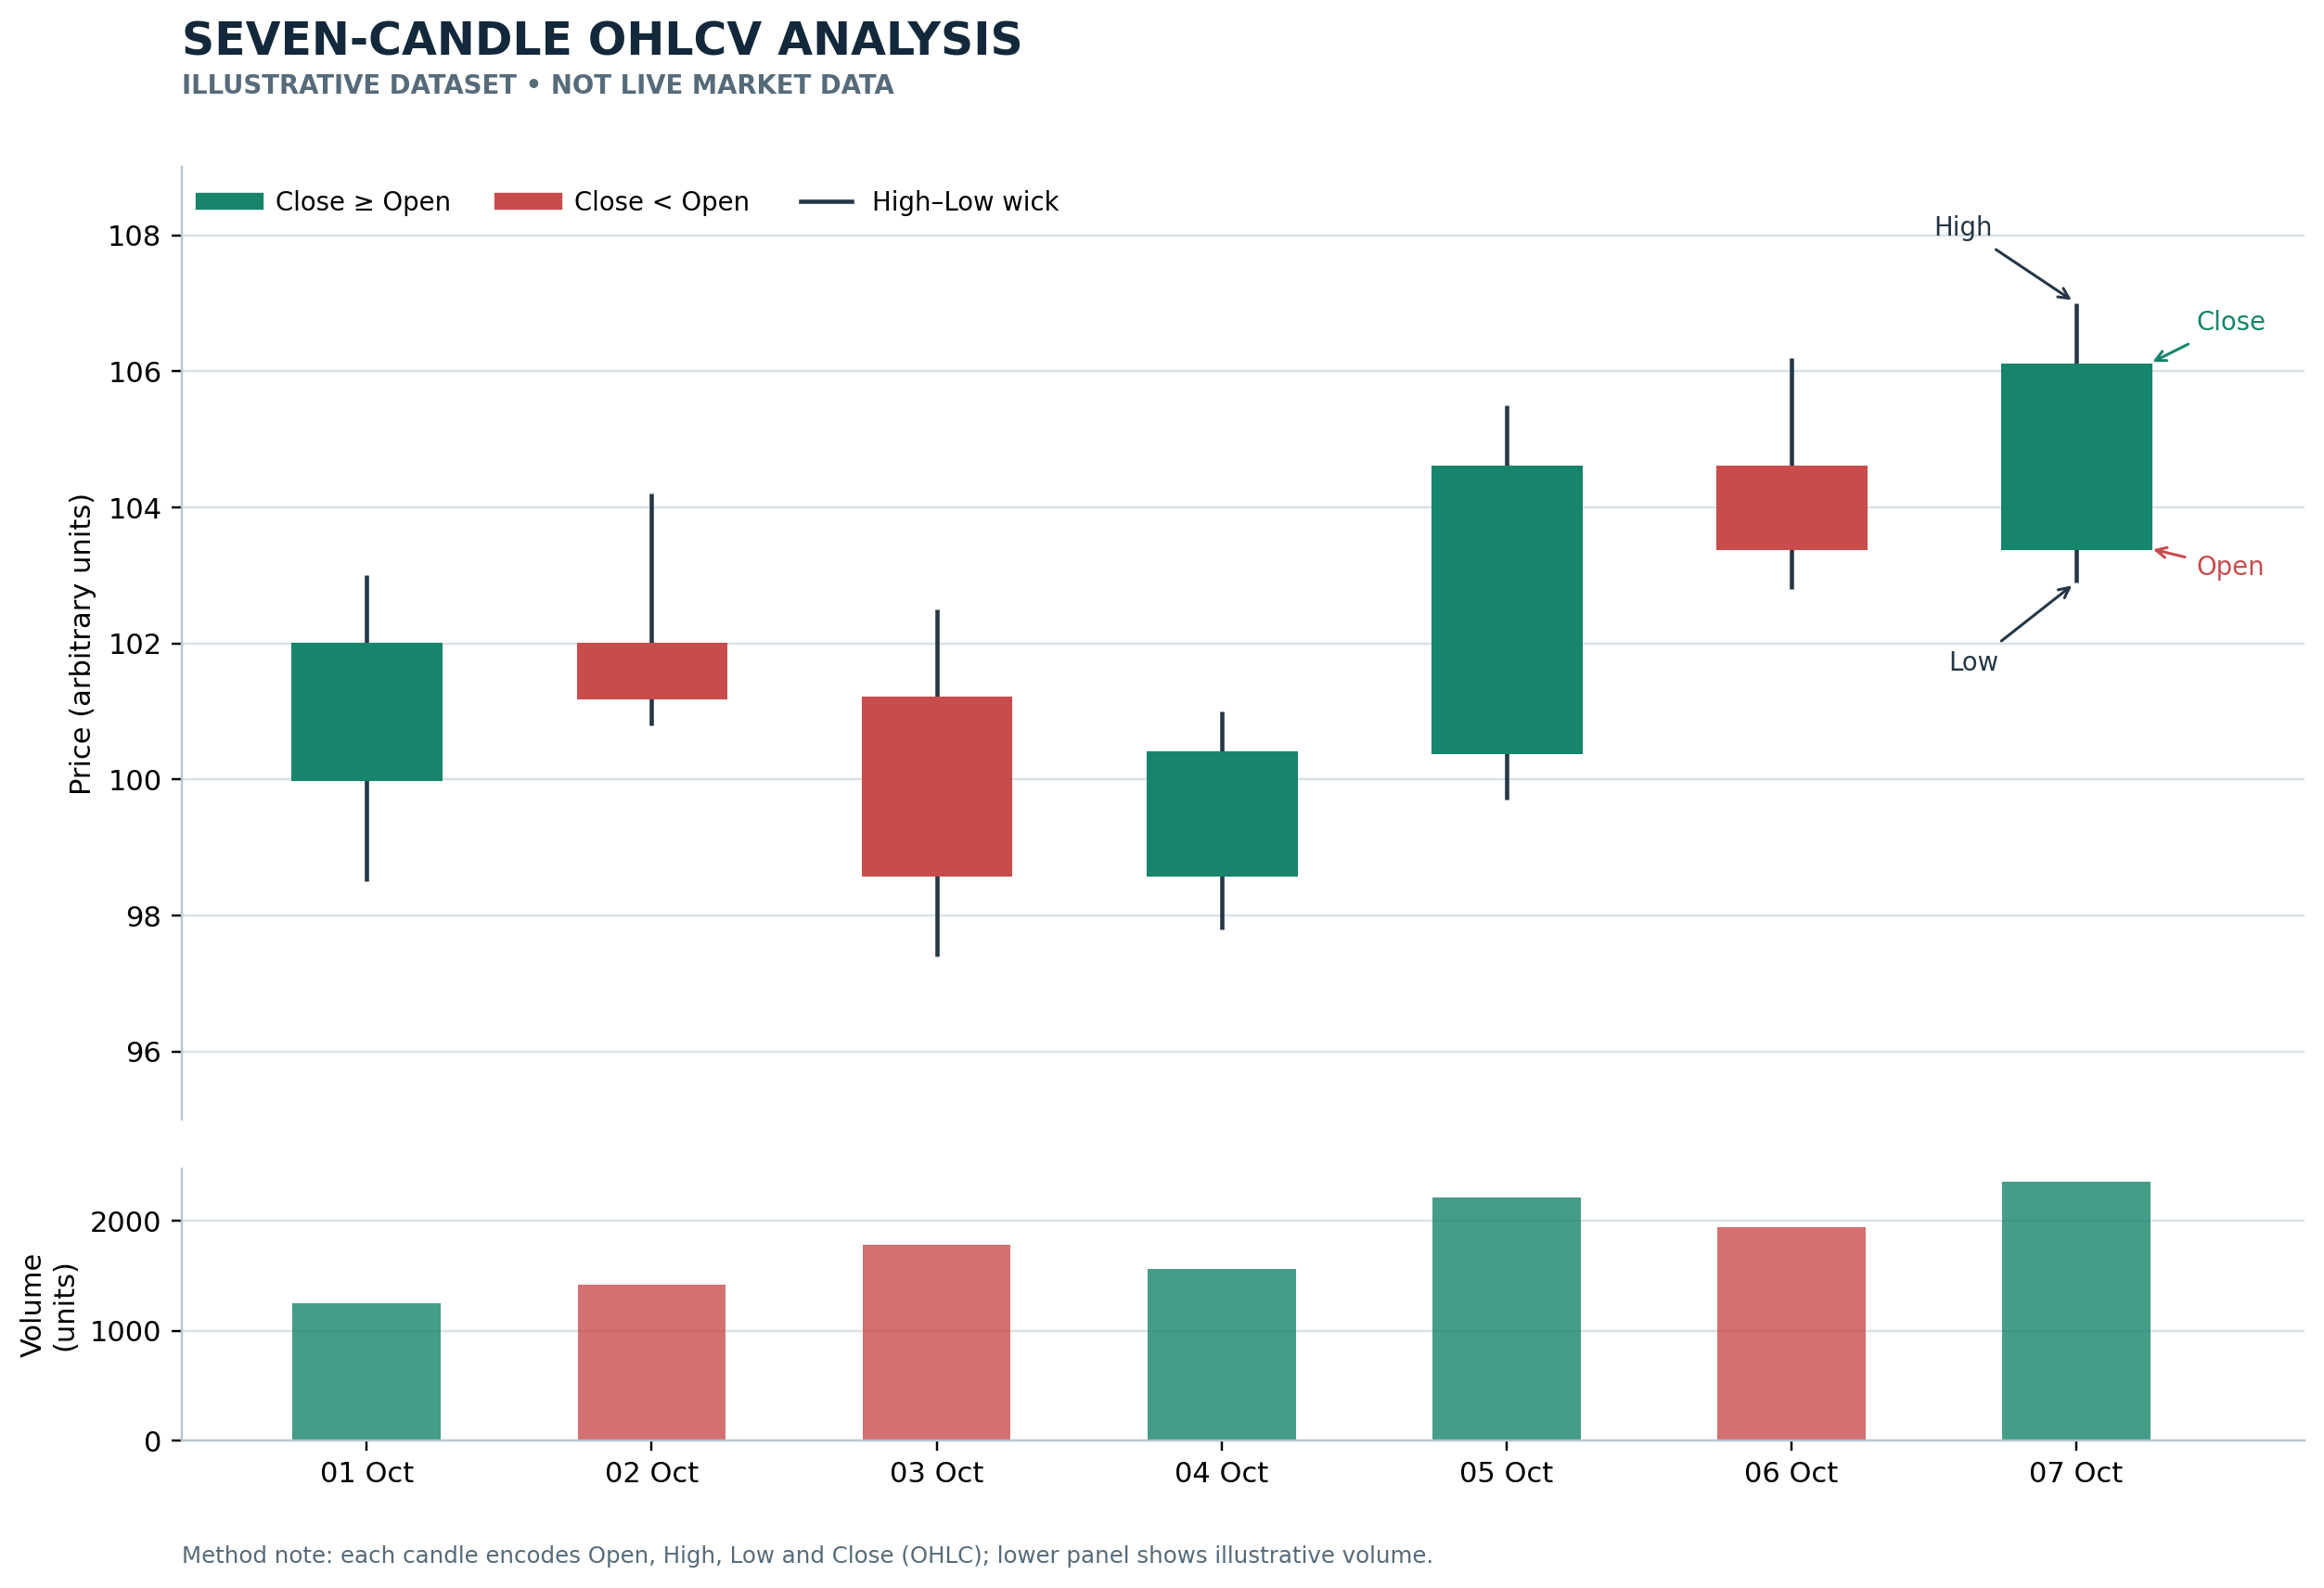
The candle body represents the difference between open and close. The wicks show how far the observed high and low extend beyond the body.
A candle is a compressed summary of price activity, not a complete record of every trade or every event that influenced the market.
3. Measure the Candle Instead of Guessing
For each candle, calculate:
Body size
[
B=|C-O|
]
Full price range
[
R=H-L
]
Upper wick
[
W_u=H-\max(O,C)
]
Lower wick
[
W_l=\min(O,C)-L
]
These measurements help describe the candle’s structure consistently.
For example, a long upper wick means the session’s high was considerably above the higher of its opening and closing prices. It does not, by itself, prove that the market will fall next.
That distinction matters: a measurable observation is not the same as a reliable forecast.
4. Calculate the Seven-Day Return Correctly
If the objective is to measure the return across seven complete daily intervals, use the opening price of the first interval and the closing price of the last interval:
[
\text{Period Return}=
\left(\frac{C_{\text{last}}}{O_{\text{first}}}-1\right)\times100%
]
If you instead compare the first candle’s close with the last candle’s close, you are measuring a close-to-close change. Both calculations can be useful, but they answer different questions.
A professional report should state which calculation it uses.
5. Add Volume and Validate the Data
Price alone is only one part of the dataset. Where reliable volume data is available, compare volume across the seven intervals and document how it is measured.
Before publishing any chart, check for:
- Missing or duplicated candle timestamps.
- Incomplete daily intervals.
- Invalid OHLC relationships.
- Inconsistent timezones or interval boundaries.
- Differences between reported volume fields.
- Rounding that changes the apparent values.
A chart can look polished and still be analytically unreliable if its underlying data has not been checked.
6. Separate Evidence from Interpretation
A rigorous analysis labels its conclusions carefully.
Observed: what the verified OHLCV records show.
Calculated: values produced by documented formulas.
Interpreted: a possible explanation consistent with the evidence.
Unknown: what the available data cannot establish.
Seven daily candles cannot independently reveal the entire market context, establish the cause of a price move, or guarantee what happens next. Broader context may require additional data, and even then, uncertainty remains.
The Final Standard: Make Every Claim Auditable
At Crypto Data AI Lens, a chart should be more than an attractive graphic. A reader should be able to identify its source, understand its timeframe, reproduce its calculations, and distinguish measured facts from interpretation.
That is the difference between simply looking at a crypto chart and examining the data behind it.
Save this framework for your next chart review. Before asking what a candle means, ask whether the data behind it has been verified.
Educational content only. $BTC , $ETH and $BNB are used as examples, not as buy or sell recommendations. This article does not predict future prices.