

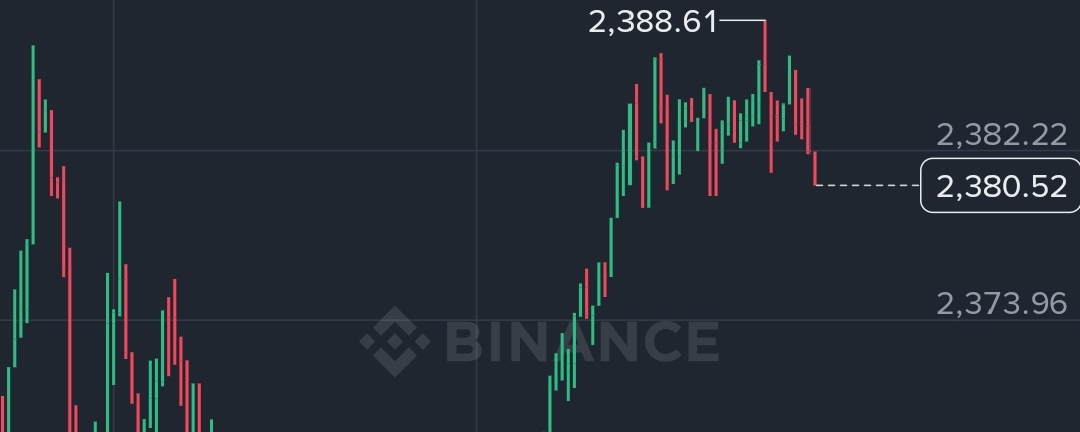

Ethereum (ETH) is trading around $2,366.50, experiencing a -5.56% daily slide and a cumulative weekly decline of roughly 7.1%. The second-largest cryptocurrency slipped below the key psychological $2,500 threshold following macroeconomic headwinds. A hotter-than-expected U.S. CPI print has elevated Treasury yields and fueled anxieties regarding aggressive Federal Reserve monetary policy.
Technical Indicators & Structural Levels
Price Compression: Currently fluctuating within a volatile daily low of $2,320.55 and high of $2,526.07.
Support Floor: Immediate critical defense rests at $2,300–$2,320. If this invalidates, a deeper correction toward $2,250 is highly likely.
Resistance Barriers: Bulls face dense overhead friction starting at the $2,450 pivot and strengthening at $2,548.
Market Sentiment: Bearish short-term momentum, amplified by over $183 million in leveraged long liquidations.
Ecosystem Resiliency & Capital Flows
ETF Rebound: In a major positive reversal, U.S. spot Ethereum ETFs successfully snapped a brutal 10-day outflow streak by logging $24.84 million in net inflows, led by Grayscale's mini ETF and Fidelity's FETH.
Network Expansion: Underlying on-chain metrics show sharp developer divergence. While the price cools off, active deployed smart contracts on Ethereum have steadily grown from 60 million in January to over 72 million, proving active building is accelerating despite market volatility.
#Ethereum✅ #ETH #CryptoAnalysis📈📉🐋📅🚀 #EthereumETFs #TechnicalAnalysiss #Altcoins