


NEAR Protocol (NEAR) is trading around $4.678, with a 24-hour gain of approximately 2.12% in the Binance screenshot.
While the daily chart maintains a constructive broader structure, the 1-hour chart shows short-term weakness. This creates an important question: can buyers regain momentum, or will NEAR test lower support levels first?
Let's break down both timeframes. 👇
📊 1H CHART ANALYSIS — Short-Term Weakness
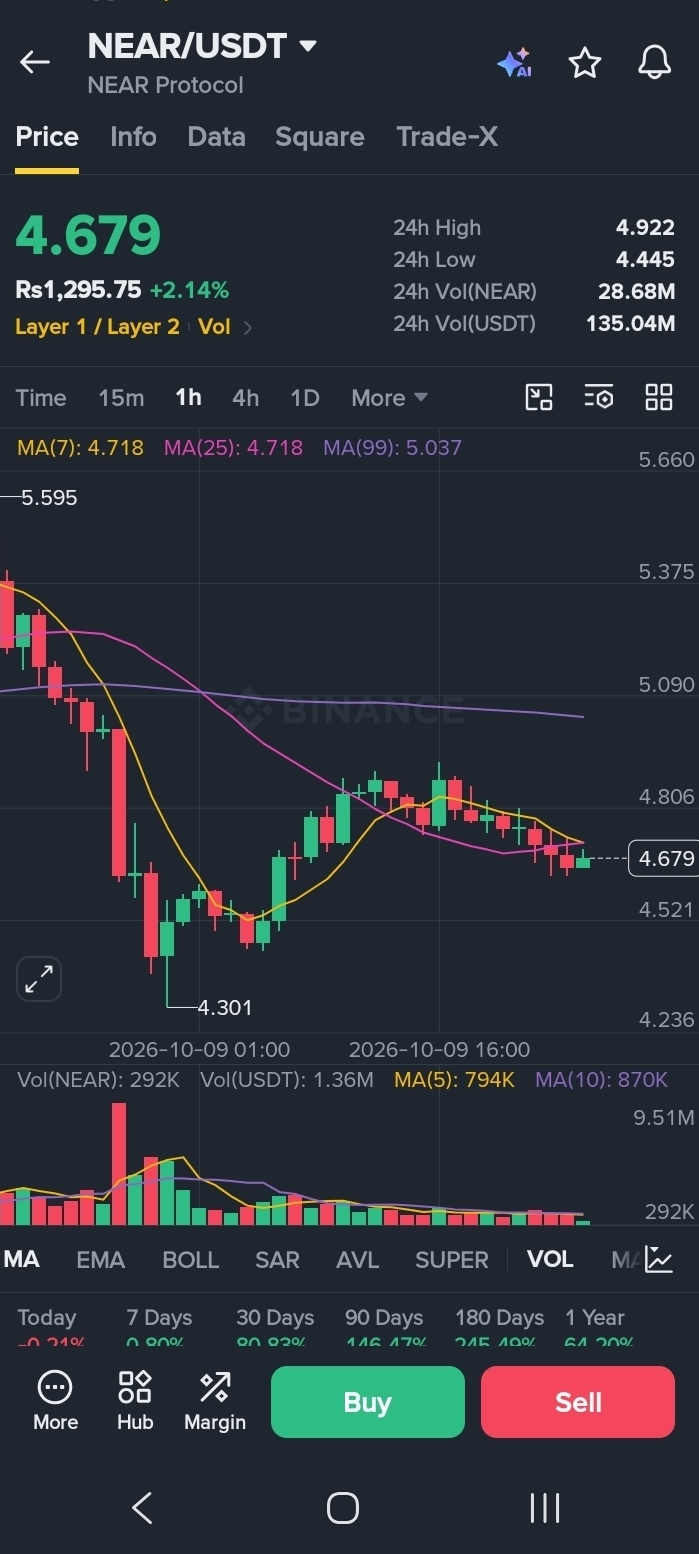
Current price: $4.678
The 1H chart shows these moving averages:
MA(7): $4.718
MA(25): $4.718
MA(99): $5.037
NEAR is trading below all three displayed moving averages, suggesting that short-term momentum remains under pressure.
Key 1H levels:
Immediate resistance: $4.718
Major resistance: $5.037
Near support: $4.521–$4.445
Lower support: Around $4.30
A recovery above $4.718 would be an initial sign of improving momentum. A stronger move toward $5.037 would require further confirmation.
If support around $4.445 fails, downside pressure could increase.
📈 1D CHART ANALYSIS — Broader Trend Remains Constructive
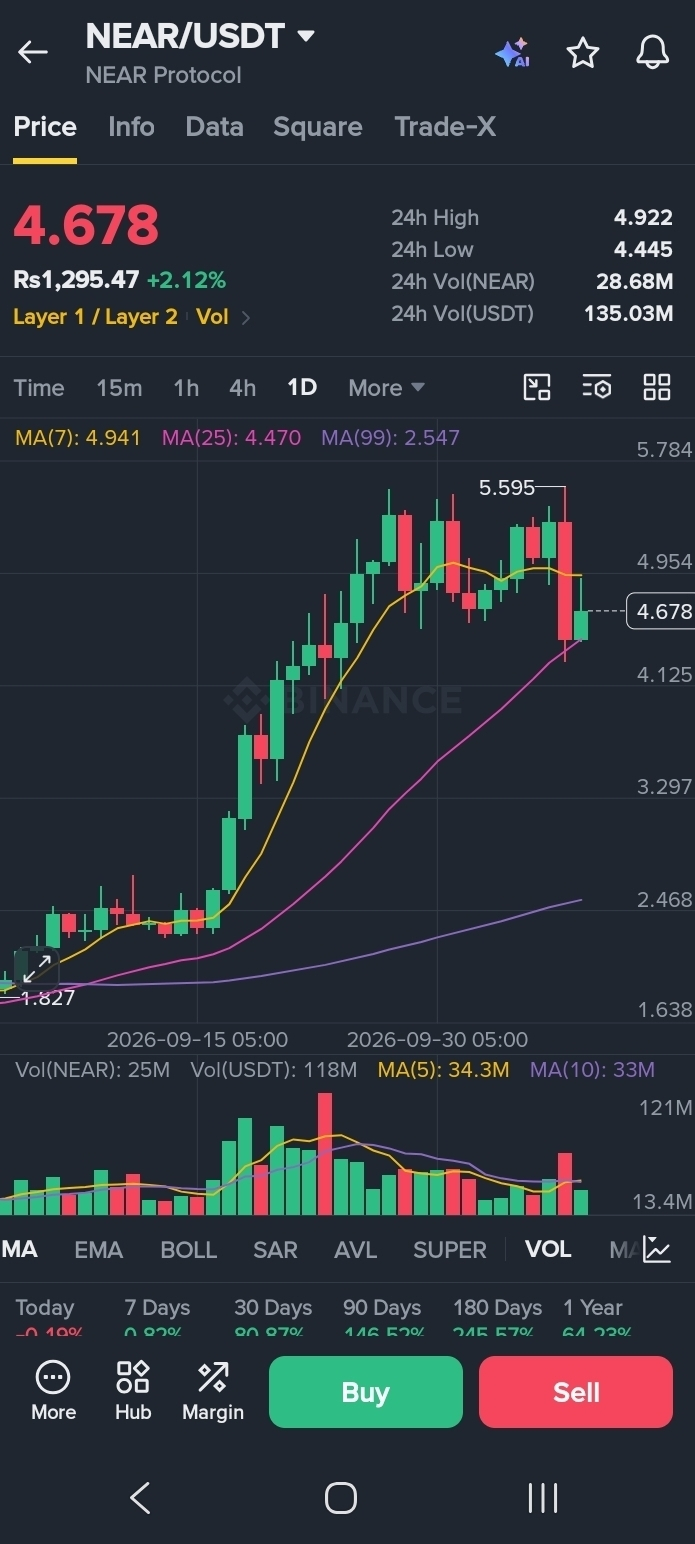
The daily chart presents a different picture:
MA(7): $4.941
MA(25): $4.470
MA(99): $2.547
NEAR is currently below its 7-period moving average but remains above its 25-period and 99-period moving averages.
This suggests that the broader trend structure remains constructive, even though the recent price action shows a short-term cooldown.
Key 1D levels:
Resistance: $4.922–$4.941
Next resistance: $5.037
Support: Around $4.470
Deeper support: Around $4.30
A sustained move above $4.941 could strengthen the recovery scenario. If price loses the $4.470 area, the broader setup would need to be reassessed.
🐂 BULLISH SCENARIO
If NEAR reclaims $4.718 and subsequently breaks above $4.922–$4.941, traders may watch $5.037 as the next resistance area.
Volume and sustained price action will be important for confirmation.
🐻 BEARISH SCENARIO
If NEAR remains below its short-term moving averages, price could retest $4.521–$4.445. A breakdown below this zone may bring $4.30 into focus.
🔍 FINAL TAKE
The 1H chart signals short-term weakness, while the 1D chart retains a constructive broader structure.
Rather than chasing the price, watch whether NEAR can reclaim resistance and hold its support zones.
What's your view? 👇
Will NEAR recover above $4.94, or will sellers push it toward $4.45 first?
Share your analysis in the comments.
Disclaimer: This post is for educational purposes only and is based on the supplied Binance screenshots. It is not financial advice or a buy/sell recommendation. Cryptocurrency prices are volatile. Always conduct your own research before making financial decisions.
#NEAR #NEARProtocol #CryptoAnalysis #TechnicalAnalysis #BinanceSquare #altcoins