
parsnal hok I'm watching $BEAMX /USDT closely right now. This chart has definitely caught my attention. 👀🔥
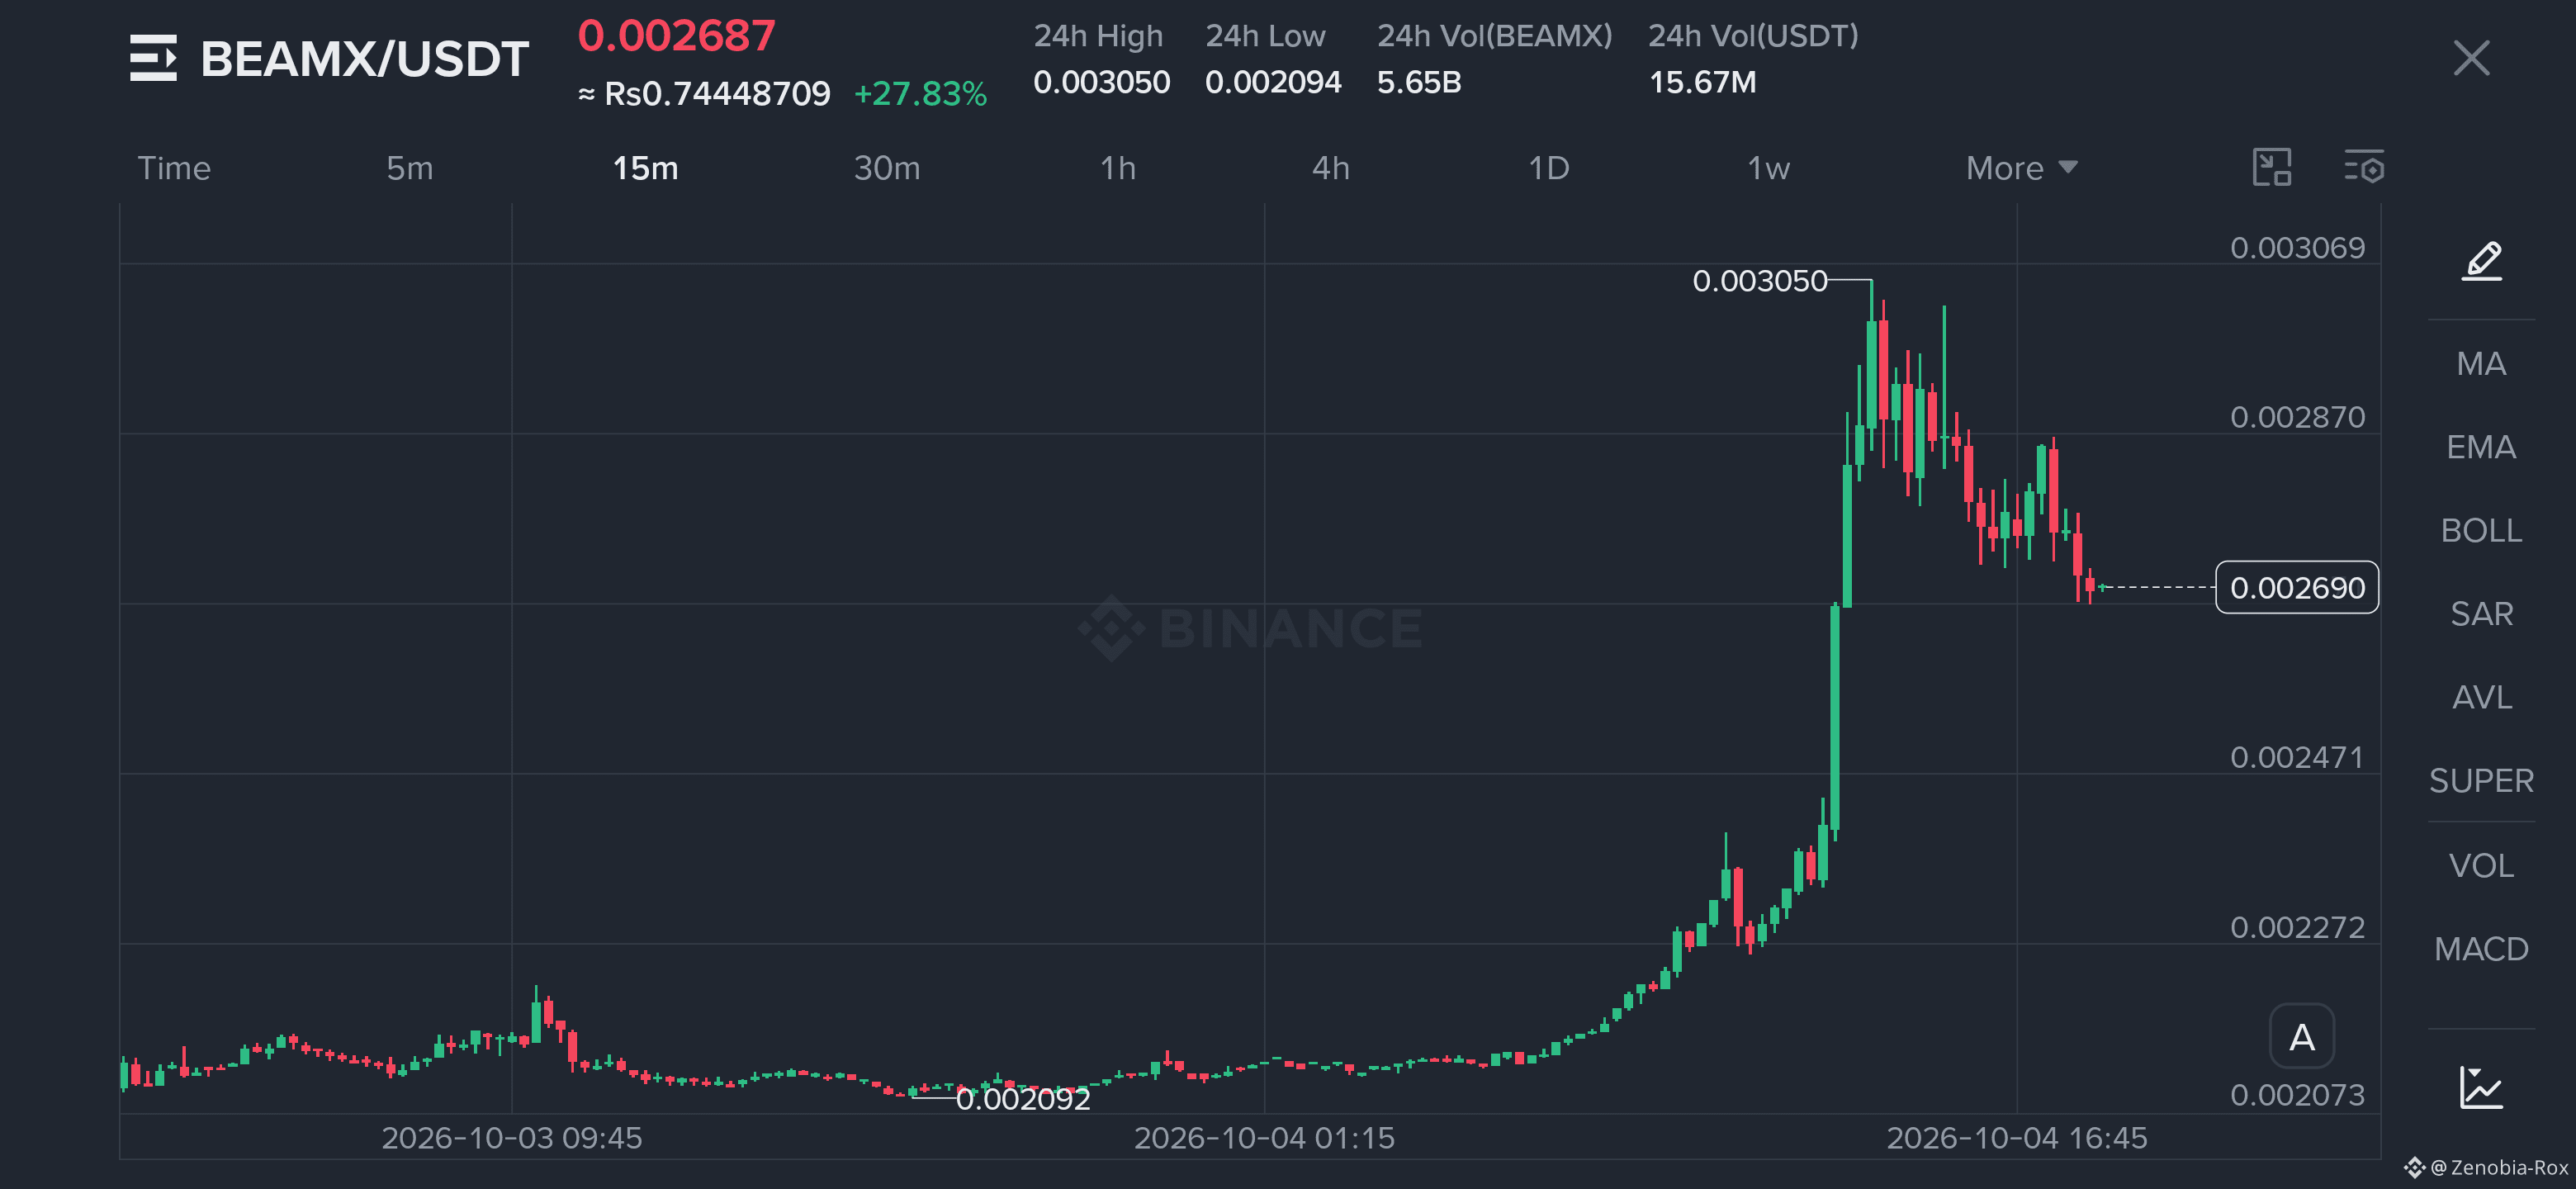
BEAMX just delivered a serious breakout on the 15M chart, ripping from the 0.0022 area toward 0.003050 before cooling off. The move is already around +27.83%, so I’m not chasing the green candles here.
What I like is that price is still holding around 0.00269 after the initial explosion. That pullback matters. After a move this aggressive, I want to see whether buyers can defend the current zone and rebuild momentum instead of simply watching another vertical candle.
The key area for me is around 0.00265–0.00272. If buyers defend this region and BEAMX starts pushing back above 0.00280, the previous high around 0.00305 comes back into focus.
But there’s another side to this chart: after such a sharp pump, volatility can become brutal. A clean breakdown below support could quickly change the structure, so risk management matters more than excitement here.
📍 BEAMX/USDT Setup
Entry Level: 0.00265 – 0.00272
TP1: 0.00280
TP2: 0.00295
TP3: 0.00305
🛑 STOP LOSS: 0.00250
The interesting part is simple: hold the breakout zone, and the chart can attempt another push toward the highs. Lose it, and I’d rather step back than force the trade.
This is the kind of chart where patience can be more valuable than chasing momentum. I’m watching the reaction around the entry zone and especially the volume behind any move back toward 0.00280+.
Not financial advice. This setup is based only on the chart structure shown and can fail quickly, especially after a sharp move. Always manage your own risk and never risk more than you can afford to lose.
DISCLAIMER: This post is for educational and informational purposes only. Crypto trading is highly volatile and carries significant risk. Do your own research before making any trading decision.
BEAMX just delivered a serious breakout on the 15M chart, ripping from the 0.0022 area toward 0.003050 before cooling off. The move is already around +27.83%, so I’m not chasing the green candles here.
What I like is that price is still holding around 0.00269 after the initial explosion. That pullback matters. After a move this aggressive, I want to see whether buyers can defend the current zone and rebuild momentum instead of simply watching another vertical candle.
The key area for me is around 0.00265–0.00272. If buyers defend this region and BEAMX starts pushing back above 0.00280, the previous high around 0.00305 comes back into focus.
But there’s another side to this chart: after such a sharp pump, volatility can become brutal. A clean breakdown below support could quickly change the structure, so risk management matters more than excitement here.
📍 BEAMX/USDT Setup
Entry Level: 0.00265 – 0.00272
TP1: 0.00280
TP2: 0.00295
TP3: 0.00305
🛑 STOP LOSS: 0.00250
The interesting part is simple: hold the breakout zone, and the chart can attempt another push toward the highs. Lose it, and I’d rather step back than force the trade.
This is the kind of chart where patience can be more valuable than chasing momentum. I’m watching the reaction around the entry zone and especially the volume behind any move back toward 0.00280+.
Not financial advice. This setup is based only on the chart structure shown and can fail quickly, especially after a sharp move. Always manage your own risk and never risk more than you can afford to lose.
DISCLAIMER: This post is for educational and informational purposes only. Crypto trading is highly volatile and carries significant risk. Do your own research before making any trading decision.