DAILY SIGNAL — SOL/USDT
Date: 03 Oct 2026 Timeframe: 1m Intraday Bias: Resistance rejection → potential downside continuation
📊 Market Bias
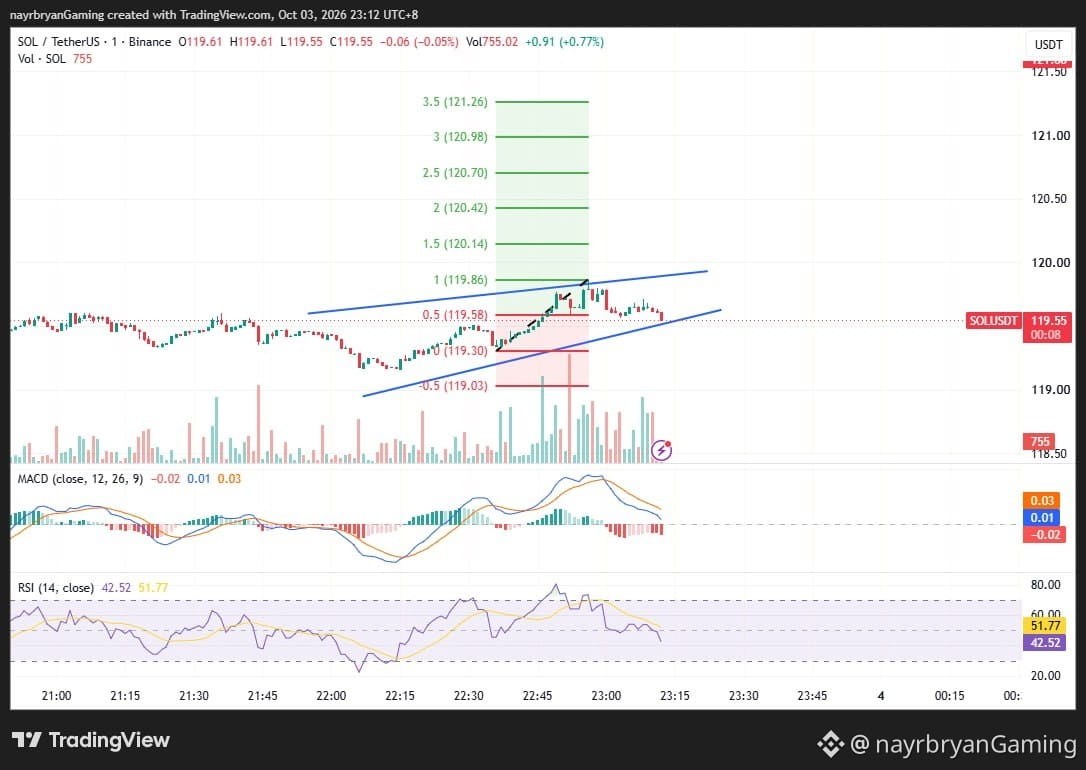
SOL is consolidating around the 119.50–119.58 resistance area after a sharp recovery from the lower structure.
Price briefly pushed toward the 119.86 Fibonacci level before pulling back toward the purple resistance zone.
The latest candles show weakening short-term momentum, with price currently around 119.55.
🔹 Key Levels From Chart
Current Price: 119.55
Resistance Zone: 119.50 – 119.58
Key Reclaim: 119.86
Upper Fibonacci Resistance: 120.14 → 120.42
Key Support: 119.30
Lower Support: 119.03
🎯 Fibonacci Levels
TP1 → 119.30 (0 Fib) TP2 → 119.03 (-0.5 Fib)
Upside levels:
119.58 → 119.86 → 120.14 → 120.42 → 120.70 → 120.98 → 121.26
📈 Technical Breakdown
SOL remains inside a broader consolidation structure supported by the rising blue trendline.
Price recently bounced strongly from the lower area and pushed above the 119.58 zone, reaching toward 119.86.
However, the latest candles show a pullback from that high.
MACD has turned weaker, with the histogram moving negative.
RSI is around 42.45, below its moving average near 50.06, indicating short-term momentum has cooled.
A sustained rejection around 119.58–119.86 followed by a break below 119.30 would expose the 119.03 area.
A reclaim above 119.86 would weaken the immediate bearish scenario and bring 120.14 → 120.42 into focus.
🧠 Quick Insight
“Resistance becomes meaningful when momentum fails to hold above it.”
⚠️ Disclaimer
This is personal market analysis, not financial advice. This chart framework is for educational purposes only.
Always DYOR / DYODD, manage risk properly, and avoid emotional trading.
— @nayrbryanGaming #SOL #SOLUSDT #Crypto #Trading #TechnicalAnalysis #PriceAction #Fibonacci #Binance #DYOR #NFA #NoFOMO
Date: 03 Oct 2026 Timeframe: 1m Intraday Bias: Resistance rejection → potential downside continuation
📊 Market Bias
SOL is consolidating around the 119.50–119.58 resistance area after a sharp recovery from the lower structure.
Price briefly pushed toward the 119.86 Fibonacci level before pulling back toward the purple resistance zone.
The latest candles show weakening short-term momentum, with price currently around 119.55.
🔹 Key Levels From Chart
Current Price: 119.55
Resistance Zone: 119.50 – 119.58
Key Reclaim: 119.86
Upper Fibonacci Resistance: 120.14 → 120.42
Key Support: 119.30
Lower Support: 119.03
🎯 Fibonacci Levels
TP1 → 119.30 (0 Fib) TP2 → 119.03 (-0.5 Fib)
Upside levels:
119.58 → 119.86 → 120.14 → 120.42 → 120.70 → 120.98 → 121.26
📈 Technical Breakdown
SOL remains inside a broader consolidation structure supported by the rising blue trendline.
Price recently bounced strongly from the lower area and pushed above the 119.58 zone, reaching toward 119.86.
However, the latest candles show a pullback from that high.
MACD has turned weaker, with the histogram moving negative.
RSI is around 42.45, below its moving average near 50.06, indicating short-term momentum has cooled.
A sustained rejection around 119.58–119.86 followed by a break below 119.30 would expose the 119.03 area.
A reclaim above 119.86 would weaken the immediate bearish scenario and bring 120.14 → 120.42 into focus.
🧠 Quick Insight
“Resistance becomes meaningful when momentum fails to hold above it.”
⚠️ Disclaimer
This is personal market analysis, not financial advice. This chart framework is for educational purposes only.
Always DYOR / DYODD, manage risk properly, and avoid emotional trading.
— @nayrbryanGaming #SOL #SOLUSDT #Crypto #Trading #TechnicalAnalysis #PriceAction #Fibonacci #Binance #DYOR #NFA #NoFOMO