$BTC
BTC/USD — Fundamental & Technical Analysis
Technical Analysis
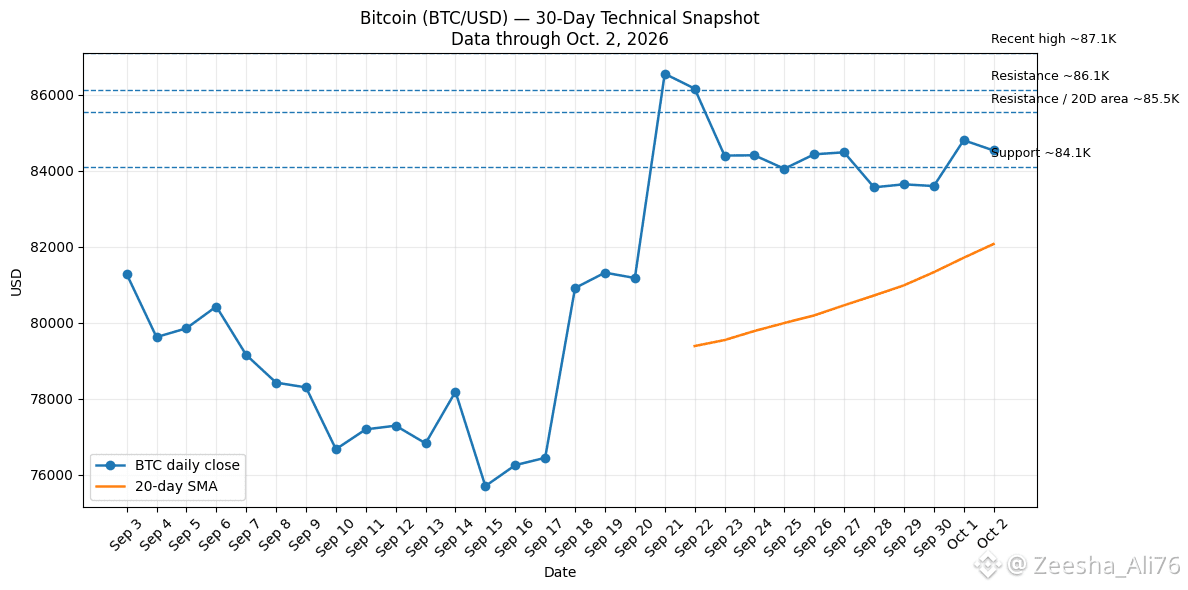
BTC is currently around $84.3K–$84.7K. The recent 30-day data shows a strong recovery from the $75–76K area, followed by consolidation around $84K–$86K.
Key levels:
Support: ~$84.1K
Next support: ~$82.5K–$83K
Resistance: ~$85.5K
Major resistance: ~$86.1K
Recent high: ~$87.1K
Current indicators are mixed. One BTC/USD technical snapshot shows RSI around 46, while the short moving averages are above price and the 50/100/200-day averages are lower. This indicates short-term consolidation rather than a clean one-directional setup.
Fundamental Analysis
Bitcoin's fundamental structure remains based on:
Fixed maximum supply of 21 million BTC
Current block subsidy of 3.125 BTC
Next halving is estimated for 2028, reducing the subsidy to 1.5625 BTC.
Network security remains substantial: recent estimates put Bitcoin's hashrate roughly around 900–1,000 EH/s.
Institutional/ETF demand is an important market factor. Reuters reported renewed ETF inflows as one reason cited by Citi for its October 2026 revision to its Bitcoin outlook.
Market Structure
The chart shows a sharp move from approximately $76K → $87K, followed by a pullback/consolidation around $84K–$85K.
Important levels to watch:
84.1K → 85.5K → 86.1K → 87.1K
A sustained move above a resistance level would change the technical structure; conversely, losing the $84K area would make the lower support zones more relevant. These are technical scenarios, not guaranteed price predictions.
#NFPWatch
#BitcoinFundingRateTriplesTo10%
#BTC☀️
#USSeptemberPayrollsAdd29KUnemploymentRises4.2%
BTC/USD — Fundamental & Technical Analysis
Technical Analysis
BTC is currently around $84.3K–$84.7K. The recent 30-day data shows a strong recovery from the $75–76K area, followed by consolidation around $84K–$86K.
Key levels:
Support: ~$84.1K
Next support: ~$82.5K–$83K
Resistance: ~$85.5K
Major resistance: ~$86.1K
Recent high: ~$87.1K
Current indicators are mixed. One BTC/USD technical snapshot shows RSI around 46, while the short moving averages are above price and the 50/100/200-day averages are lower. This indicates short-term consolidation rather than a clean one-directional setup.
Fundamental Analysis
Bitcoin's fundamental structure remains based on:
Fixed maximum supply of 21 million BTC
Current block subsidy of 3.125 BTC
Next halving is estimated for 2028, reducing the subsidy to 1.5625 BTC.
Network security remains substantial: recent estimates put Bitcoin's hashrate roughly around 900–1,000 EH/s.
Institutional/ETF demand is an important market factor. Reuters reported renewed ETF inflows as one reason cited by Citi for its October 2026 revision to its Bitcoin outlook.
Market Structure
The chart shows a sharp move from approximately $76K → $87K, followed by a pullback/consolidation around $84K–$85K.
Important levels to watch:
84.1K → 85.5K → 86.1K → 87.1K
A sustained move above a resistance level would change the technical structure; conversely, losing the $84K area would make the lower support zones more relevant. These are technical scenarios, not guaranteed price predictions.
#NFPWatch
#BitcoinFundingRateTriplesTo10%
#BTC☀️
#USSeptemberPayrollsAdd29KUnemploymentRises4.2%