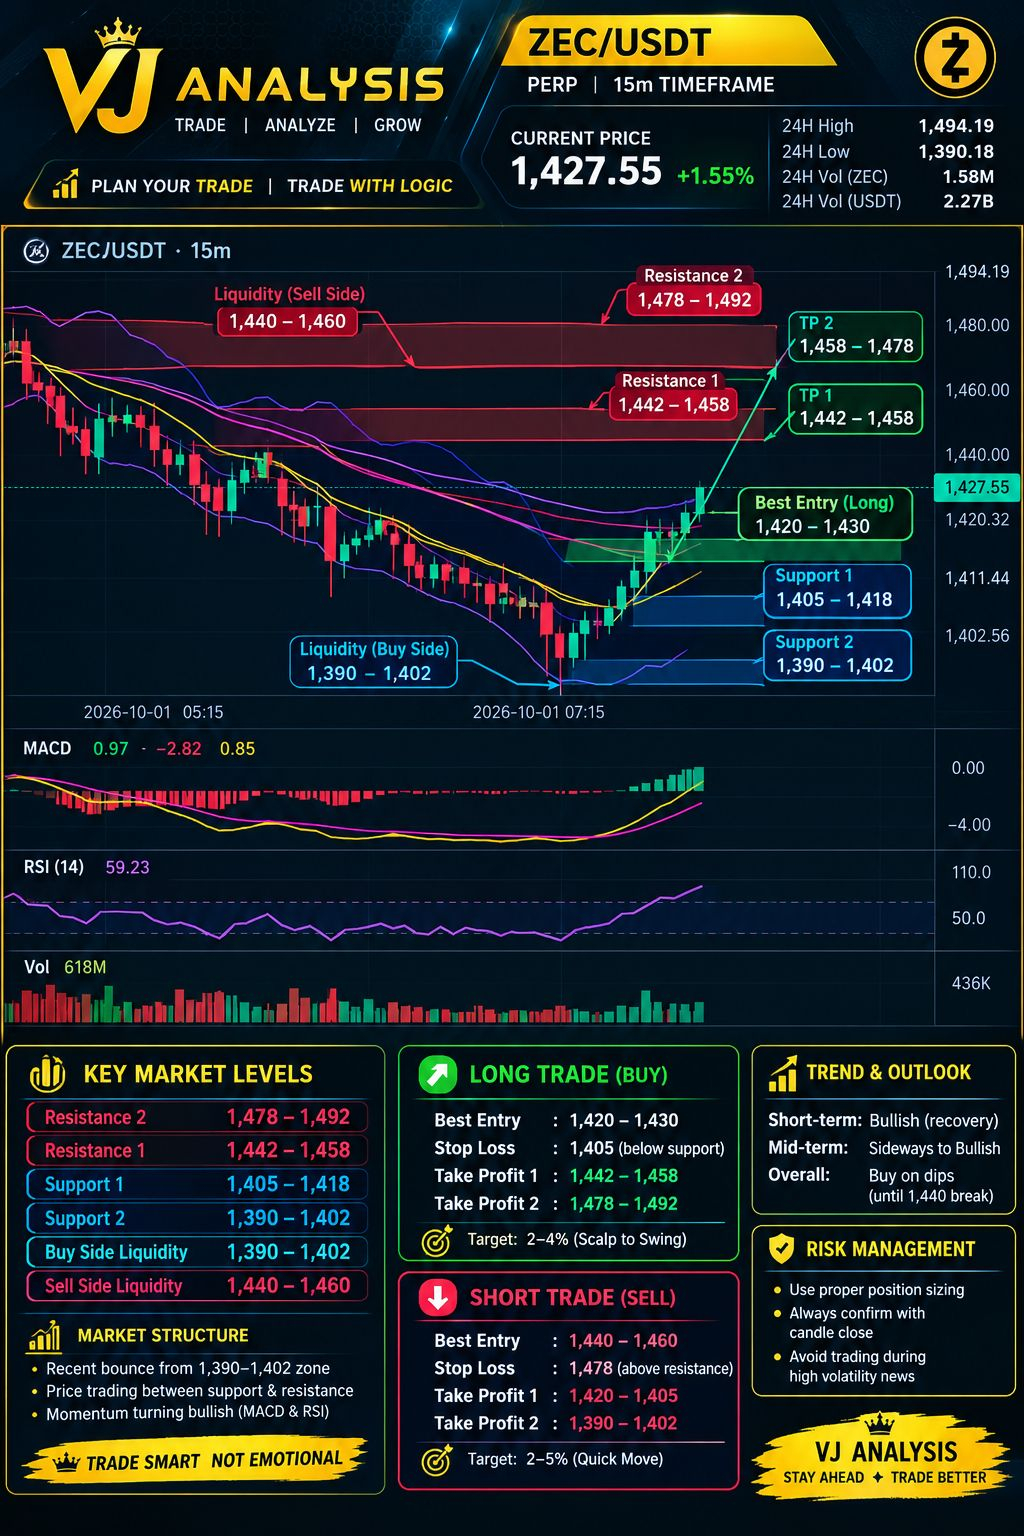
🔥 #ZECUSDT — 15M TECHNICAL ANALYSIS #zec
⚡ VJ ANALYSIS | INTRADAY TRADE PLAN
ZEC is trading around 1,427.55 after a strong recovery from the 1,405.32 low. The 15M structure is showing improving bullish momentum, with MACD turning positive and price reclaiming key moving-average zones.
📍 KEY LEVELS
🟢 Support 1: 1,405–1,418
🟢 Support 2: 1,390–1,402
🔴 Resistance 1: 1,442–1,458
🔴 Resistance 2: 1,478–1,492
💧 LIQUIDITY
Buy-side liquidity is concentrated around 1,390–1,402, while sell-side liquidity appears around 1,440–1,460. These zones can attract volatility and liquidity sweeps before the next directional move.
🚀 LONG SETUP
Best entry: 1,420–1,430
Stop Loss: 1,405
TP1: 1,442–1,458
TP2: 1,478–1,492
If price holds above 1,420 and confirms with a 15M candle close, buyers may attempt another push toward the resistance zones.
🔻 SHORT SETUP
Potential short zone: 1,440–1,460
Stop Loss: 1,478
TP1: 1,420–1,405
TP2: 1,390–1,402
Watch the 1,440 breakout carefully: a confirmed close above it could strengthen the recovery structure, while rejection there may send price back toward support. Avoid chasing candles during sudden volatility.
⚠️ Wait for confirmation, manage leverage carefully, and protect capital with disciplined risk management.
📊 VJ ANALYSIS
Trade smart. Stay patient. Follow price action, not emotions.
#ZEC #ZECUSDT #Crypto_Jobs🎯 #Trading #TechnicalAnalysis #VJAnalysis
⚡ VJ ANALYSIS | INTRADAY TRADE PLAN
ZEC is trading around 1,427.55 after a strong recovery from the 1,405.32 low. The 15M structure is showing improving bullish momentum, with MACD turning positive and price reclaiming key moving-average zones.
📍 KEY LEVELS
🟢 Support 1: 1,405–1,418
🟢 Support 2: 1,390–1,402
🔴 Resistance 1: 1,442–1,458
🔴 Resistance 2: 1,478–1,492
💧 LIQUIDITY
Buy-side liquidity is concentrated around 1,390–1,402, while sell-side liquidity appears around 1,440–1,460. These zones can attract volatility and liquidity sweeps before the next directional move.
🚀 LONG SETUP
Best entry: 1,420–1,430
Stop Loss: 1,405
TP1: 1,442–1,458
TP2: 1,478–1,492
If price holds above 1,420 and confirms with a 15M candle close, buyers may attempt another push toward the resistance zones.
🔻 SHORT SETUP
Potential short zone: 1,440–1,460
Stop Loss: 1,478
TP1: 1,420–1,405
TP2: 1,390–1,402
Watch the 1,440 breakout carefully: a confirmed close above it could strengthen the recovery structure, while rejection there may send price back toward support. Avoid chasing candles during sudden volatility.
⚠️ Wait for confirmation, manage leverage carefully, and protect capital with disciplined risk management.
📊 VJ ANALYSIS
Trade smart. Stay patient. Follow price action, not emotions.
#ZEC #ZECUSDT #Crypto_Jobs🎯 #Trading #TechnicalAnalysis #VJAnalysis