🚨 Be careful about the current rise of $HBAR … Liquidity at the bottom may be more important than you expect.
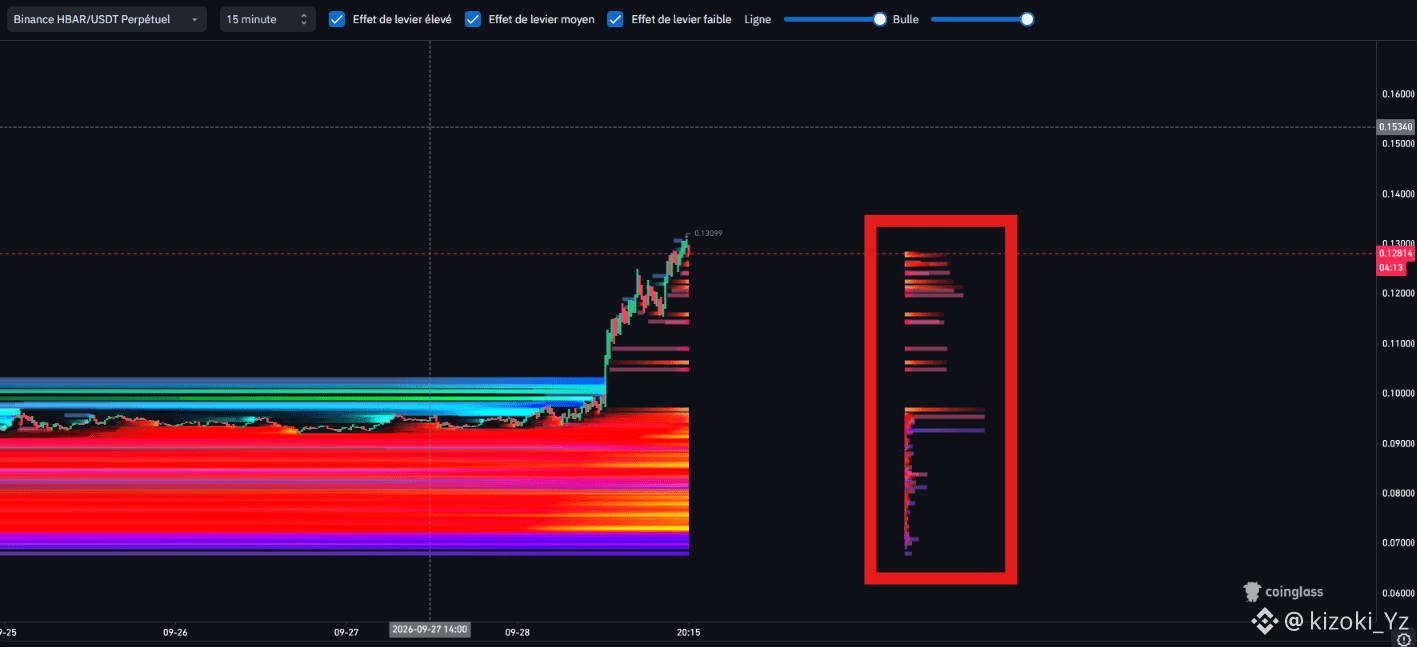
Despite the clear positivity in the market and traders crowding into Long positions, the liquidity map shows a completely different picture.
📉 First: a clear gap in liquidity
The range between $0.1000 – $0.1250 looks very weak in terms of liquidity, while larger volumes are concentrated below the price, especially between $0.0900 – $0.0750.
This means that breaking $0.1000 could open the way for a fast downward move, because the price is moving within a range that lacks strong support and liquidity zones.
⚠️ Second: contracts are getting crowded with Long
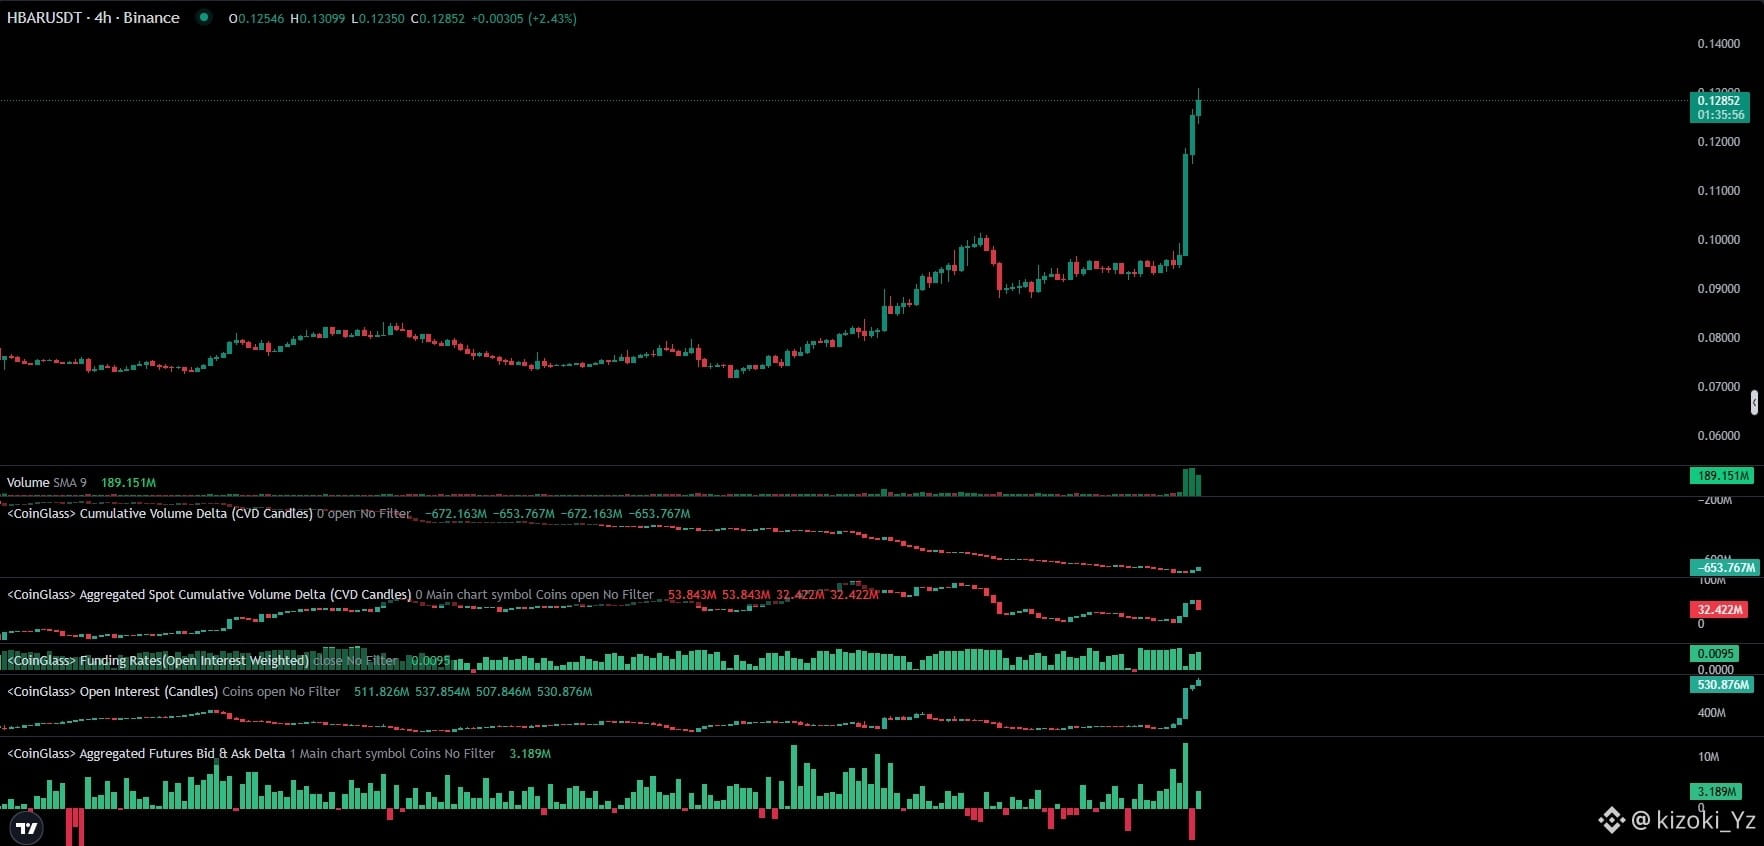
Open Interest is around 530.87M, with a positive Funding Rate of 0.0095%.
In other words, there is a clear positioning toward bullishness. And with leverage increasing, any opposite move becomes more dangerous, because it may trigger a chain of Long Liquidations.
Most importantly, the price rally isn’t matched by the same momentum in Spot CVD, which makes me even more cautious about chasing the price at these levels.
🎯 What am I watching?
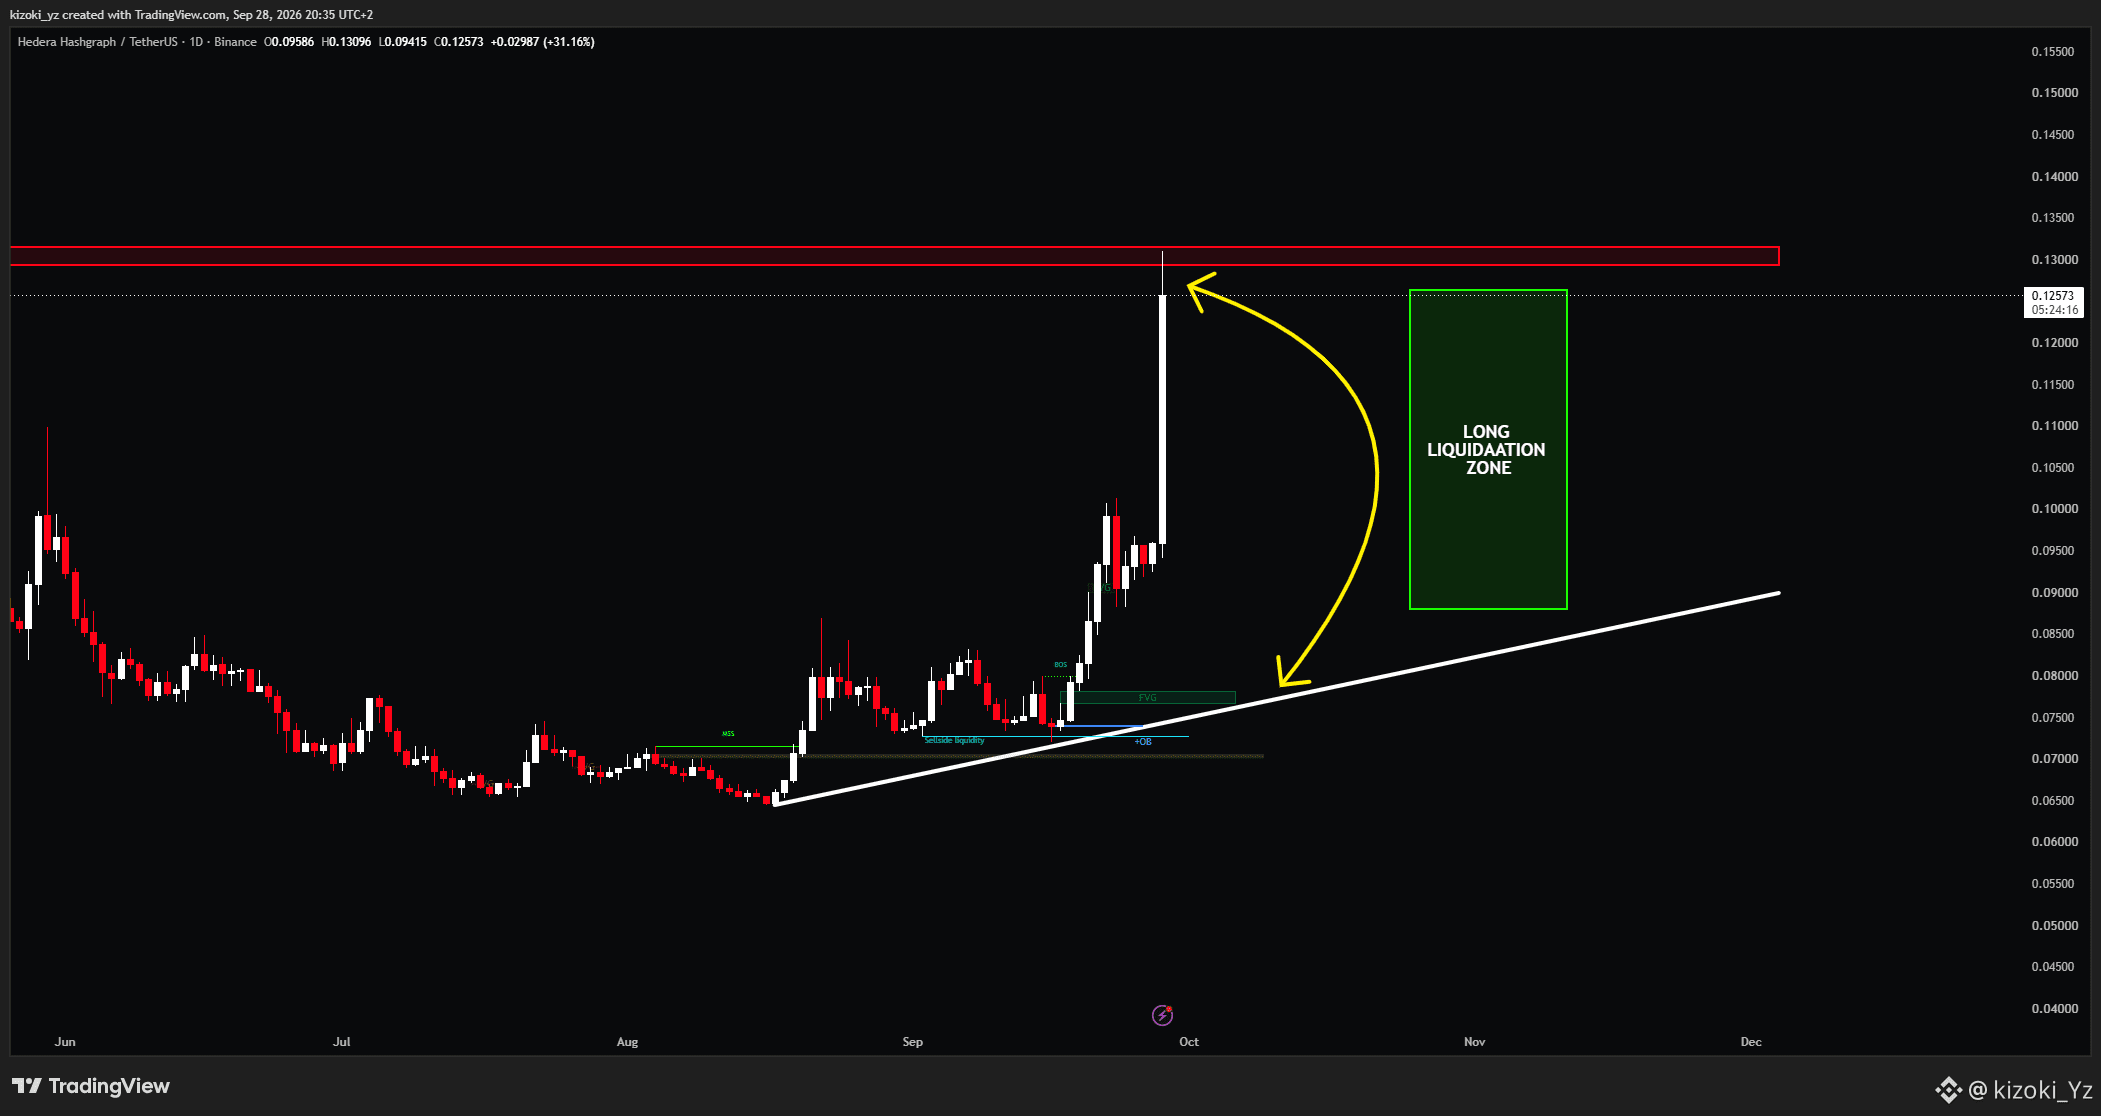
The price has reached an important resistance area near $0.1300, so I don’t think chasing the upside from here is the best idea.
If a correction starts and $0.1000 breaks, we may see acceleration toward the bigger liquidity zones:
$0.0900 → $0.0750
Don’t chase the move just because everyone has become bullish. Watch liquidity first.
Despite the clear positivity in the market and traders crowding into Long positions, the liquidity map shows a completely different picture.
📉 First: a clear gap in liquidity
The range between $0.1000 – $0.1250 looks very weak in terms of liquidity, while larger volumes are concentrated below the price, especially between $0.0900 – $0.0750.
This means that breaking $0.1000 could open the way for a fast downward move, because the price is moving within a range that lacks strong support and liquidity zones.
⚠️ Second: contracts are getting crowded with Long
Open Interest is around 530.87M, with a positive Funding Rate of 0.0095%.
In other words, there is a clear positioning toward bullishness. And with leverage increasing, any opposite move becomes more dangerous, because it may trigger a chain of Long Liquidations.
Most importantly, the price rally isn’t matched by the same momentum in Spot CVD, which makes me even more cautious about chasing the price at these levels.
🎯 What am I watching?
The price has reached an important resistance area near $0.1300, so I don’t think chasing the upside from here is the best idea.
If a correction starts and $0.1000 breaks, we may see acceleration toward the bigger liquidity zones:
$0.0900 → $0.0750
Don’t chase the move just because everyone has become bullish. Watch liquidity first.