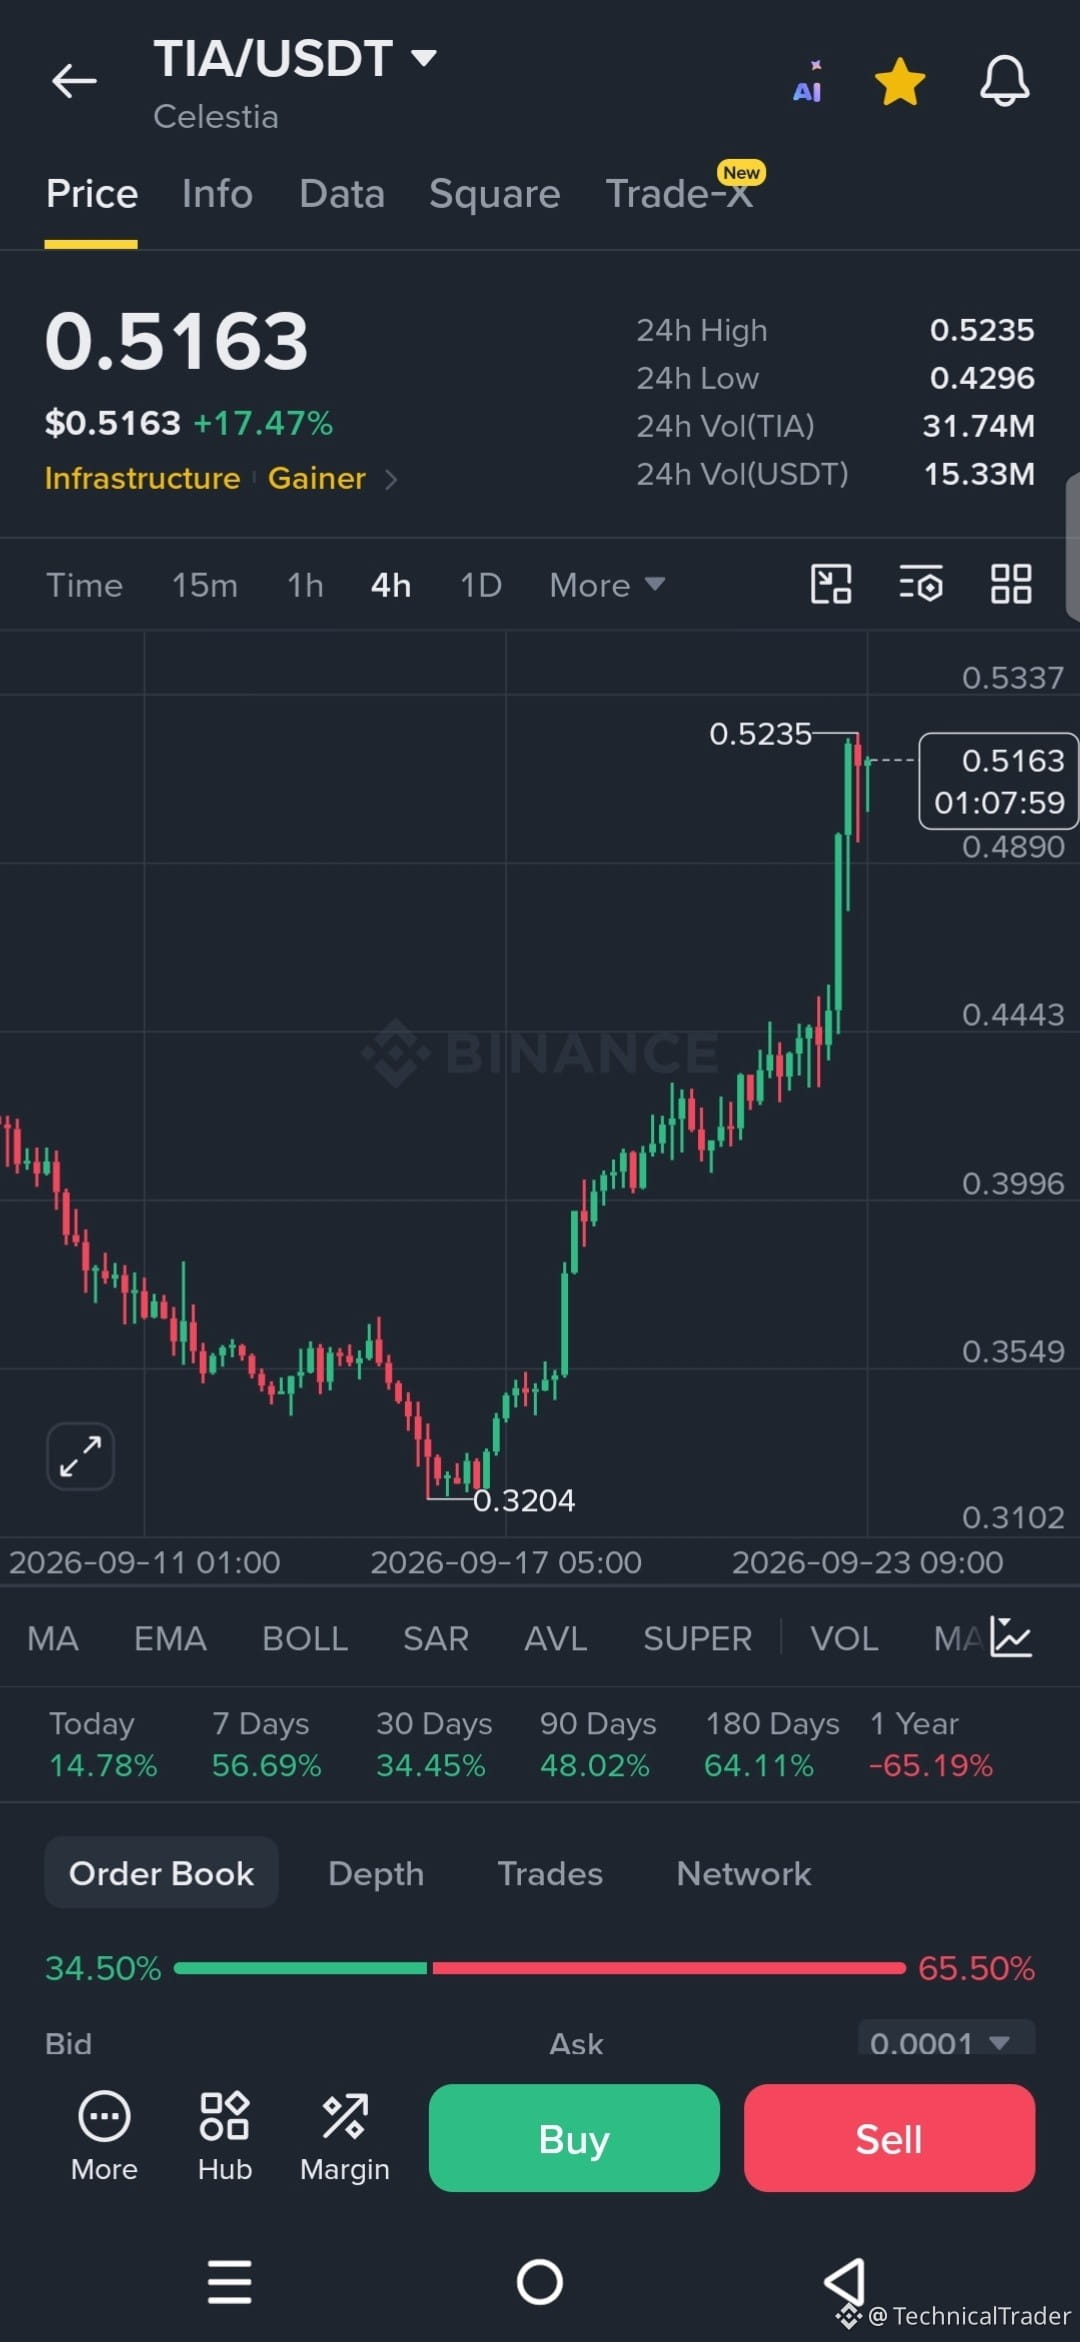
Look at this $TIA rocket price just ripped from that 0.3204 low and is sitting right under the 0.5235 high after a clean +17% day.
What we’re seeing is a strong recovery. After the sell-off bottomed out around 0.3204, buyers stepped in hard and started printing higher lows all the way up. The structure flipped into a clear series of higher highs and higher lows, with that last vertical push taking us straight into the 0.52 area. Current price is holding 0.5163 after tagging 0.5235.
Key levels right now: the recent high at 0.5235 is the first resistance to watch. Below us, the last strong green leg started around the 0.44–0.45 zone, and further down that 0.3996–0.40 area looks like a solid demand pocket from the climb. The order book is currently heavier on the ask side, which matches the slight pullback we’re seeing from the high.
Bullish continuation needs a clean break and hold above 0.5235. If that happens, the next leg higher opens up with the previous momentum still intact. On the flip side, if we lose the 0.4890–0.48 area with conviction, the move starts looking tired and we could see a deeper retrace toward 0.44 or even the 0.40 zone.
I’m watching how price reacts right here under 0.5235. A strong rejection or a decisive break will tell us the next direction.
Guys, follow for more chart analysis 😎 I’ll keep showing you exactly what the chart is telling us. 👀🔥
What we’re seeing is a strong recovery. After the sell-off bottomed out around 0.3204, buyers stepped in hard and started printing higher lows all the way up. The structure flipped into a clear series of higher highs and higher lows, with that last vertical push taking us straight into the 0.52 area. Current price is holding 0.5163 after tagging 0.5235.
Key levels right now: the recent high at 0.5235 is the first resistance to watch. Below us, the last strong green leg started around the 0.44–0.45 zone, and further down that 0.3996–0.40 area looks like a solid demand pocket from the climb. The order book is currently heavier on the ask side, which matches the slight pullback we’re seeing from the high.
Bullish continuation needs a clean break and hold above 0.5235. If that happens, the next leg higher opens up with the previous momentum still intact. On the flip side, if we lose the 0.4890–0.48 area with conviction, the move starts looking tired and we could see a deeper retrace toward 0.44 or even the 0.40 zone.
I’m watching how price reacts right here under 0.5235. A strong rejection or a decisive break will tell us the next direction.
Guys, follow for more chart analysis 😎 I’ll keep showing you exactly what the chart is telling us. 👀🔥