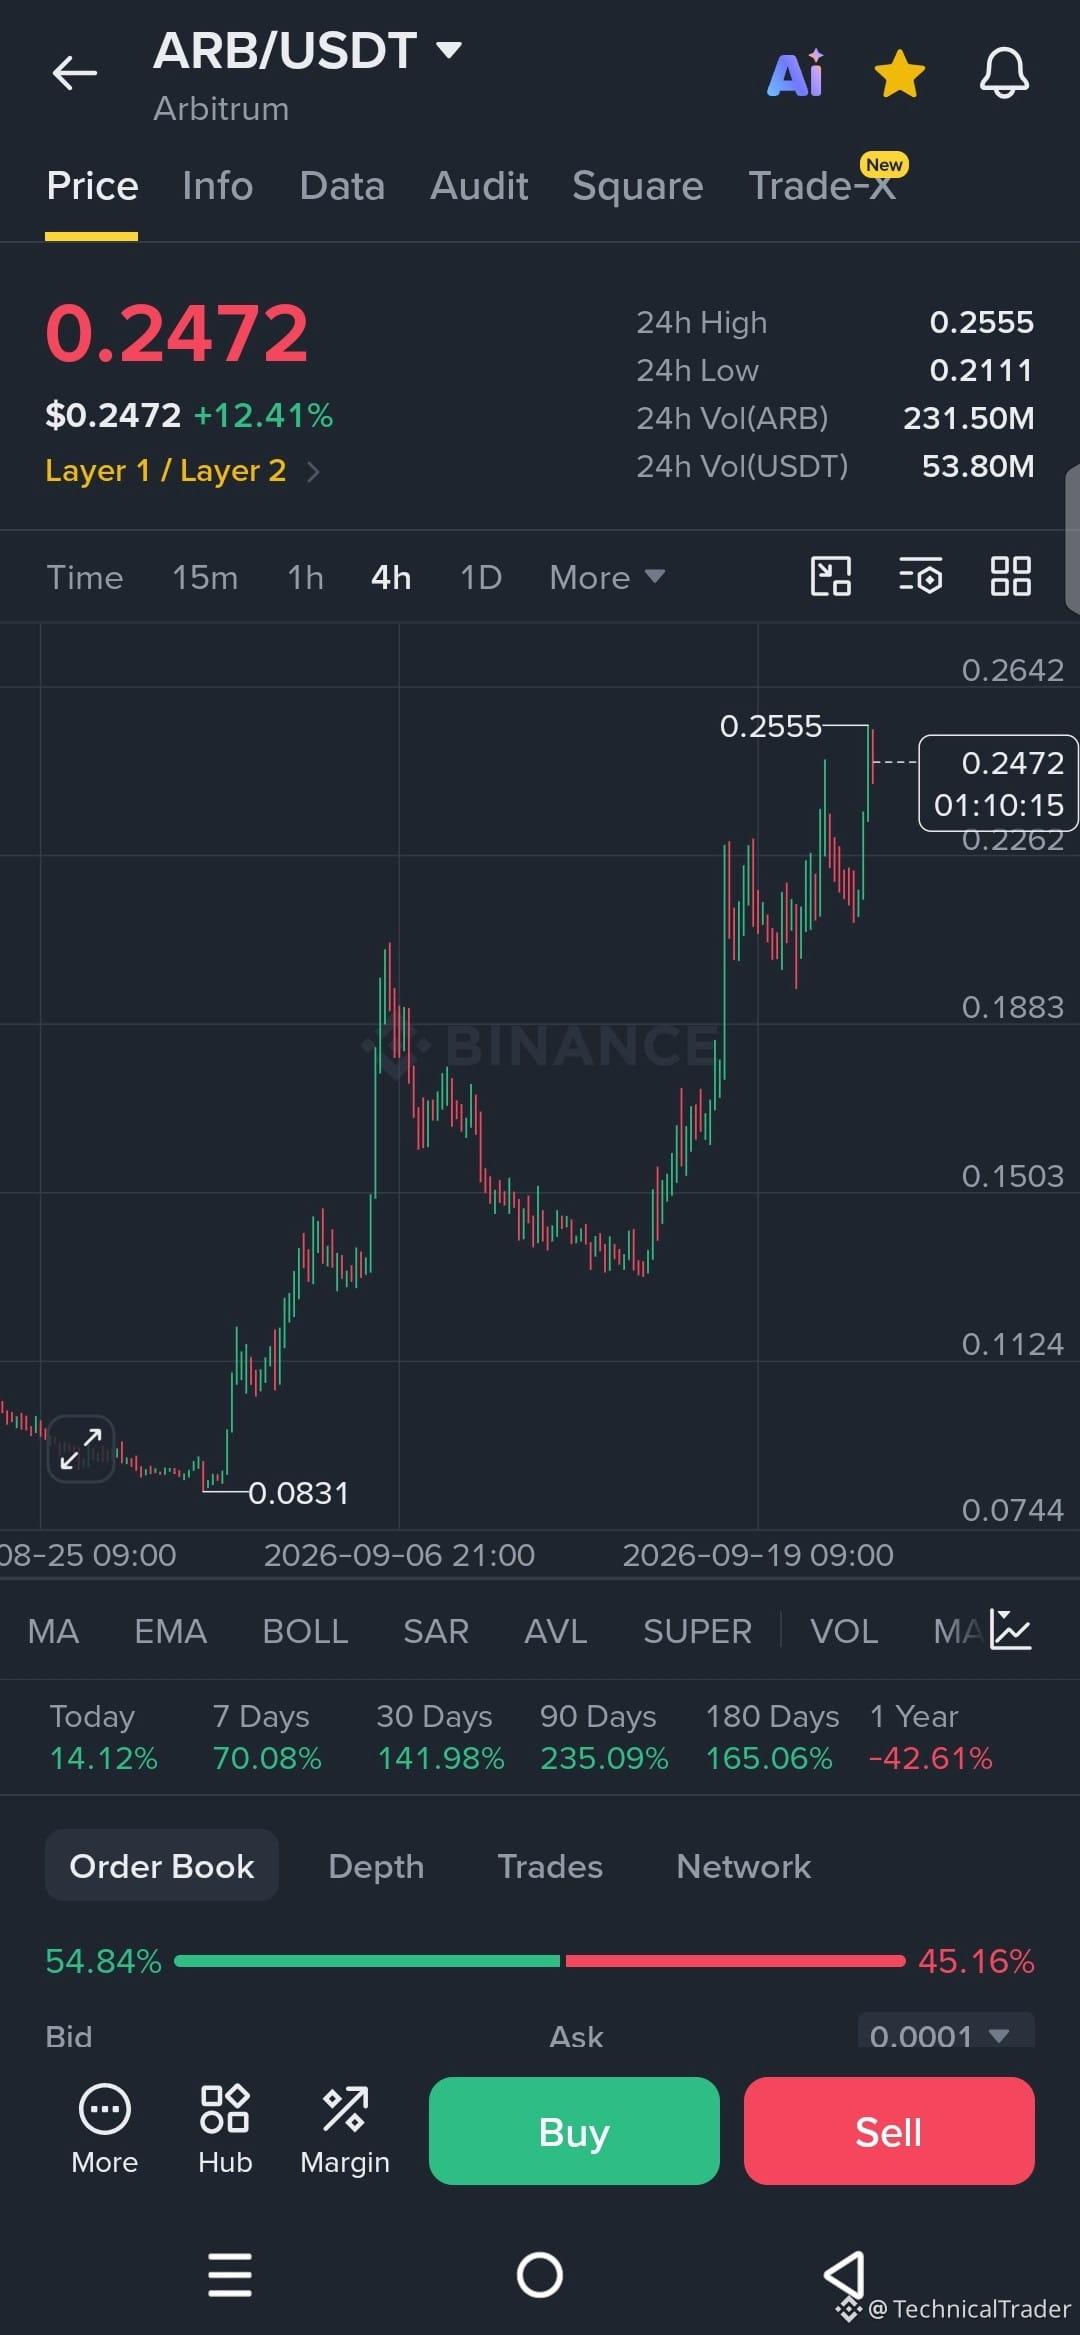
Look at this $ARB chart… price just tagged 0.2555 and is now sitting at 0.2472 after a massive run. That recent high is staring right at us.
From the low around 0.0831 this thing has been printing higher highs and higher lows the whole way up. Clear uptrend structure on the 4h — strong impulse legs followed by shallow pullbacks. The latest push took out previous highs cleanly and left that 0.2555 wick.
Key levels right now: 0.2555 is the obvious resistance that just rejected. Below us the last demand zone sits around the 0.22–0.226 area where price previously held and launched higher. That mid-range around 0.1883 also acted as support earlier in the move.
Right now price is consolidating just under the high after that sharp green candle. Volume has been solid on the upside legs.
Bullish continuation needs a clean break and hold above 0.2555. If that happens, the next liquidity sits higher and the structure stays intact. Bearish side would be a drop back under the 0.226 zone — that would open the door for a deeper retrace toward the previous demand around 0.188.
Watching how price reacts at this 0.2472–0.2555 range next. A strong rejection from here keeps the higher-high sequence alive; a breakdown through 0.226 changes the short-term picture.
Guys, follow for more chart analysis 😎 I’ll keep showing you exactly what the chart is telling us. 👀🔥
From the low around 0.0831 this thing has been printing higher highs and higher lows the whole way up. Clear uptrend structure on the 4h — strong impulse legs followed by shallow pullbacks. The latest push took out previous highs cleanly and left that 0.2555 wick.
Key levels right now: 0.2555 is the obvious resistance that just rejected. Below us the last demand zone sits around the 0.22–0.226 area where price previously held and launched higher. That mid-range around 0.1883 also acted as support earlier in the move.
Right now price is consolidating just under the high after that sharp green candle. Volume has been solid on the upside legs.
Bullish continuation needs a clean break and hold above 0.2555. If that happens, the next liquidity sits higher and the structure stays intact. Bearish side would be a drop back under the 0.226 zone — that would open the door for a deeper retrace toward the previous demand around 0.188.
Watching how price reacts at this 0.2472–0.2555 range next. A strong rejection from here keeps the higher-high sequence alive; a breakdown through 0.226 changes the short-term picture.
Guys, follow for more chart analysis 😎 I’ll keep showing you exactly what the chart is telling us. 👀🔥