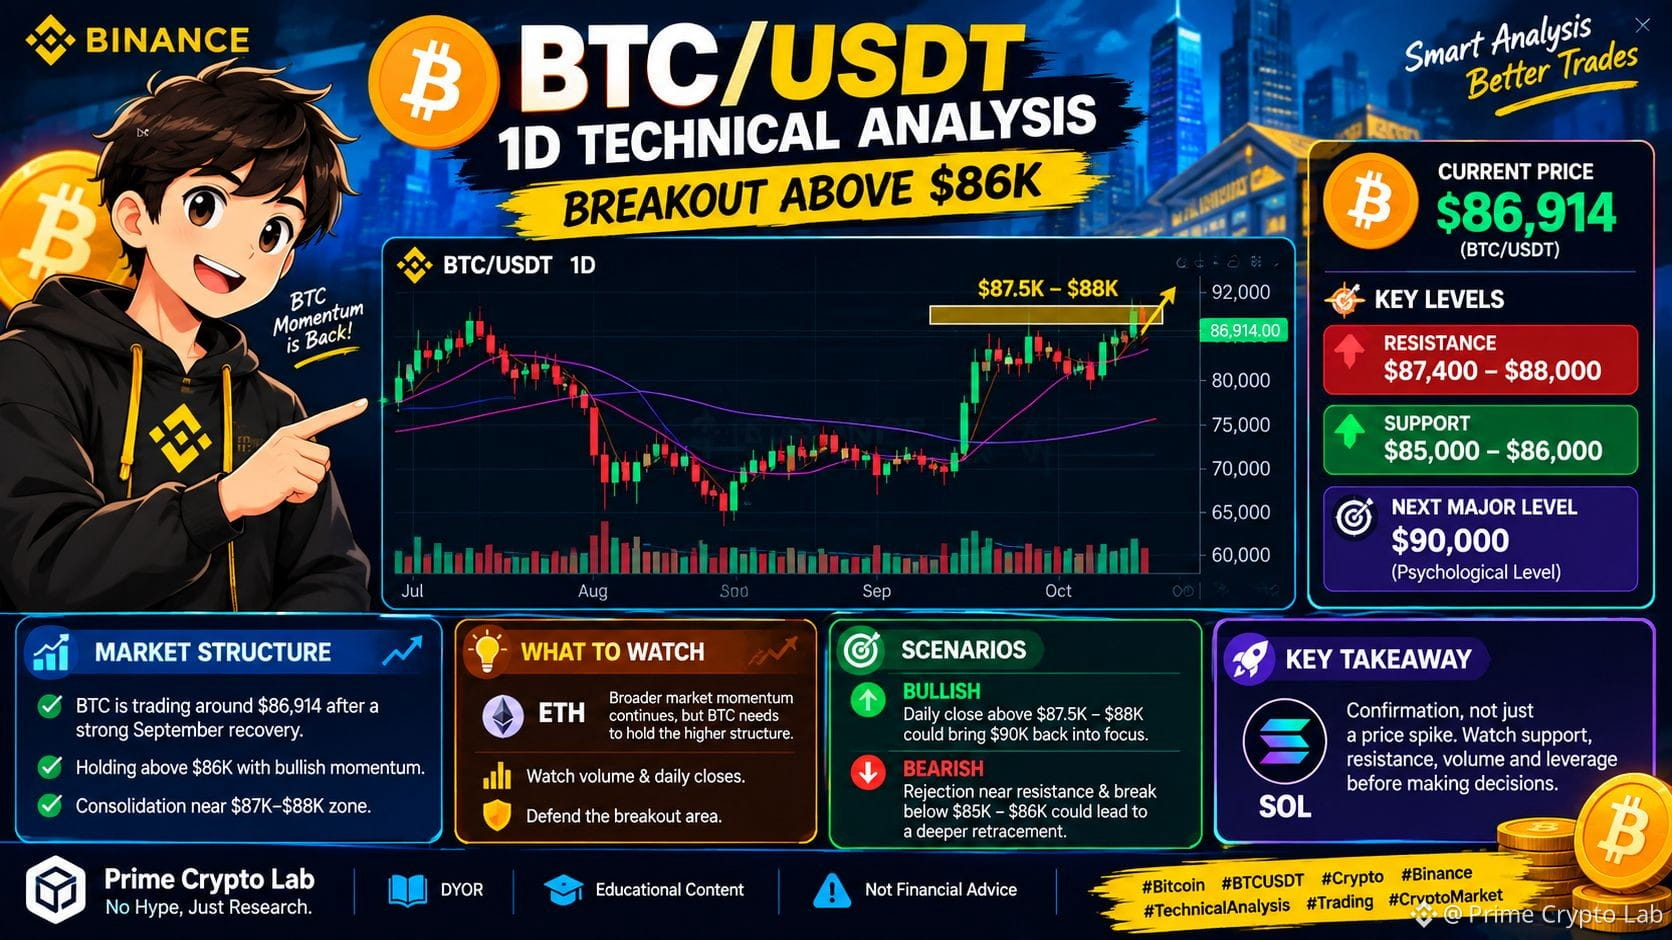
📊 BTC/USDT 1D Technical Analysis — Breakout Above $86K
🟠Current Market Structure
Bitcoin $BTC is trading around $86,914 in the uploaded Binance BTC/USDT Spot 1D chart. The chart shows a strong recovery from the lower range, followed by consolidation and another push toward the $87K–$88K area. Recent market data also shows BTC holding above $86K after a strong September recovery.
📈Key Resistance & Support
The immediate resistance zone is around $87,400–$88,000, based on the recent chart high and current price structure. A confirmed daily close above this area could strengthen the breakout structure, while rejection may bring price back toward the $85,000–$86,000 support region.
Market analysis is also watching the $90,000 psychological level, while recent derivatives data shows substantial Bitcoin options positioning around $90K ahead of the September 25 quarterly expiry.
🔎 What Traders Should Watch
Ethereum $ETH — The broader crypto market is also showing increased momentum, but BTC needs to maintain its higher-price structure rather than simply making a short-lived spike. Watch volume, daily closes, and whether buyers can defend the breakout area.
⚠️Bullish vs. Bearish Scenario
Bullish: Daily close above $87.5K–$88K could put $90K back into focus.
Bearish: Rejection near resistance followed by a break below $85K–$86K could lead to a deeper retracement.
🎯 Key Takeaway
Solana $SOL — The important signal is confirmation, not simply the current price spike. Traders should monitor support, resistance, volume and leverage before making decisions.
Prime Crypto Lab — No Hype, Just Research.
DYOR | Educational Content | Not Financial Advice
#bitcoin #crypto #BTCUSDT #cryptotrading
🟠Current Market Structure
Bitcoin $BTC is trading around $86,914 in the uploaded Binance BTC/USDT Spot 1D chart. The chart shows a strong recovery from the lower range, followed by consolidation and another push toward the $87K–$88K area. Recent market data also shows BTC holding above $86K after a strong September recovery.
📈Key Resistance & Support
The immediate resistance zone is around $87,400–$88,000, based on the recent chart high and current price structure. A confirmed daily close above this area could strengthen the breakout structure, while rejection may bring price back toward the $85,000–$86,000 support region.
Market analysis is also watching the $90,000 psychological level, while recent derivatives data shows substantial Bitcoin options positioning around $90K ahead of the September 25 quarterly expiry.
🔎 What Traders Should Watch
Ethereum $ETH — The broader crypto market is also showing increased momentum, but BTC needs to maintain its higher-price structure rather than simply making a short-lived spike. Watch volume, daily closes, and whether buyers can defend the breakout area.
⚠️Bullish vs. Bearish Scenario
Bullish: Daily close above $87.5K–$88K could put $90K back into focus.
Bearish: Rejection near resistance followed by a break below $85K–$86K could lead to a deeper retracement.
🎯 Key Takeaway
Solana $SOL — The important signal is confirmation, not simply the current price spike. Traders should monitor support, resistance, volume and leverage before making decisions.
Prime Crypto Lab — No Hype, Just Research.
DYOR | Educational Content | Not Financial Advice
#bitcoin #crypto #BTCUSDT #cryptotrading